
Juventus FC stock forecast: Third-party price targets
Juventus FC is a publicly listed Italian football club, with its shares trading on Borsa Italiana. Explore JUVE’s price action, third-party price targets and technical analysis.
Juventus FC (JUVE) is trading around €2.80 in intraday European dealing, with the price testing the top of its session range between €2.66 and €2.80 as of 3:14pm UTC on 16 January 2026. Past performance is not a reliable indicator of future results.
The share price action comes amid a busy period on and off the pitch. In late-2025, Juventus confirmed that it is subject to a UEFA investigation into potential financial fair play breaches covering the 2022–2025 period. The matter, disclosed in the club’s financial statements, could result in financial or sporting sanctions once proceedings conclude (Reuters, 16 October 2025). More broadly, Italian equities have traded against a backdrop of modest gains in the FTSE MIB index in mid-January 2026 (Trading Economics, 16 January 2026).
Juventus FC stock forecast 2026–2030: Third-party price targets
As of 16 January 2026, third-party Juventus FC stock predictions present a broad mix of traditional broker targets, model-driven projections and technical signals. Price markers are expressed in both euro and US-dollar terms and typically span intraday fair-value estimates, 12-month horizons and short-term monthly paths. As with all third-party forecasts, these figures remain subject to revision as new price and fundamental data emerge.
MarketScreener (consensus snapshot)
MarketScreener lists a Juventus mean target price of €2.70 in its consensus snapshot, based on two contributing analysts and referencing a last close of €2.682. This suggests a marginal premium of roughly 0.7% to the reference price, consistent with a broadly neutral analyst stance following recent updates (MarketScreener, 16 January 2026).
Simply Wall St (analyst target update)
Simply Wall St indicates that the average JUVE stock forecast stood at approximately €2.70. The platform attributes those cuts to lowered earnings expectations and balance-sheet considerations, while noting that the latest target sits close to prevailing market levels (Simply Wall St, 11 January 2026).
Investing.com (analyst survey)
Investing.com cites an average 12‑month Juventus price target of around €2.70, with a high estimate of €3.05 and a low of €2.35, based on projections from two analysts. The platform notes these figures amid a mixed recommendation backdrop, as contributors weigh balance‑sheet risks and revenue volatility against potential upside from sporting performance (Investing.com, 16 January 2026).
Predictions and third-party forecasts are inherently uncertain, as they cannot fully account for unexpected market developments. Past performance is not a reliable indicator of future results.
JUVE stock price: Technical overview
The JUVE stock price hovers around €2.80 as of 3:14pm UTC on 16 January 2026, remaining above a rising cluster of moving averages, with the 20-, 50-, 100- and 200-day SMAs located around €2.76, €2.59, €2.71 and €2.87 respectively. This configuration leaves a short-over-medium-term alignment in place. RSI(14) reads near 57, placing it in the upper-neutral zone, while ADX(14) around 33 indicates an established trend, suggesting directional momentum without clear signs of technical exhaustion.
On the topside, the nearest classic pivot above spot is R1 at approximately €3.19, with R2 near €3.49 potentially coming into view if price sustains a daily close above initial resistance. On pullbacks, initial support lies around the classic pivot at €2.68, with the 100-day SMA near €2.71 acting as a nearby moving-average reference. S1 sits lower, around €2.38, which may come into focus if the pivot and surrounding SMA band fail to hold (TradingView, 16 January 2026).
This technical analysis is provided for informational purposes only and does not constitute financial advice or a recommendation to buy or sell any instrument.
Juventus FC share price history (2024–2026)
Juventus FC’s share price has trended higher overall during the past two years, rising from around €2.19 in mid-January 2024 to approximately €2.80 by 16 January 2026. During this period, the stock has experienced notable swings on both sides of €3.00, including a move above €3.30 in late June 2025 before easing back toward the high-€2.00s into year end.
In 2024, JUVE spent much of the year below €2.50, briefly dipping near €2.00 in June before gradually moving higher through the autumn and ending December just above €3.00. By contrast, 2025 proved more volatile, with prices fluctuating between roughly €2.20 and €3.50. Several advances above €3.30 occurred during May and June, followed by a late-year pullback toward €2.60, before the share recovered to trade just under €2.80 in early January 2026.
Past performance is not a reliable indicator of future results. Share prices are indicative and may differ from live market prices.
Juventus FC (JUVE): Capital.com analyst view
The JUVE stock price has spent much of the past two years oscillating within a broad €2.00–€3.50 range. In 2025, a move into the mid-€3.00s during May was followed by a pullback toward the low-€2.00s in December, before recovering to around €2.80 by mid-January 2026. For some market participants, this pattern illustrates how on-pitch performance, European qualification prospects and broader Italian equity sentiment can provide support at times, while the same factors may also weigh on valuations during periods of weaker results or reduced risk appetite.
From a fundamental perspective, recent assessments point to a mix of constructive and challenging signals. Independent reviews note that Juventus reduced losses and increased revenue in its 2024/25 accounts, which some investors may interpret as supportive for the longer-term equity narrative. However, the ongoing UEFA investigation into potential financial fair play breaches for the 2022–2025 period introduces an element of regulatory uncertainty, with possible financial or sporting consequences depending on the outcome.
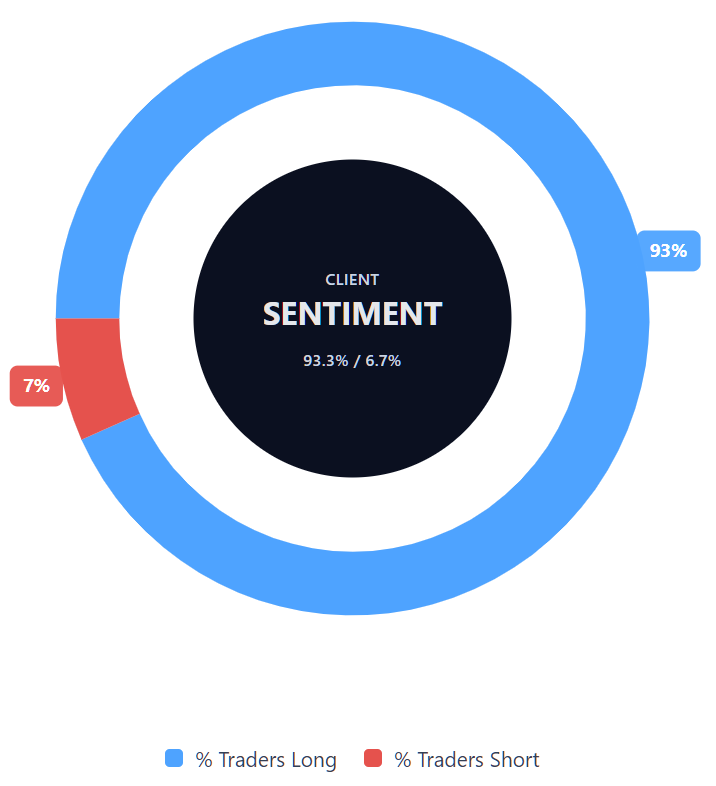
Capital.com’s client sentiment for Juventus FC CFDs
As of 16 January 2026, Capital.com client positioning in Juventus FC CFDs is currently heavily skewed towards long positions, with 93.3% buyers versus 6.7% sellers. This places buyers ahead by 86.7 percentage points and keeps sentiment in a strongly long-leaning configuration. The data reflects open CFD positions on Capital.com and can change as new trades are opened or existing positions are closed.
Summary – Juventus FC 2026
- Juventus FC (JUVE) is trading around €2.80 as of 3:14pm UTC on 16 January 2026, positioned near the upper end of its intraday range between €2.66 and €2.80 on Capital.com’s feed.
- Over the past two years, the share has moved within a broad €2.00–€3.50 range, with multiple advances above €3.30 during mid-2025 before easing back toward the high-€2.00s into year end.
- Technical indicators show JUVE holding above a rising 20-, 50-, 100- and 200-day SMA cluster around €2.76, €2.59, €2.71 and €2.87. RSI(14) near 57 and ADX(14) around 34 point to an established trend that is not yet stretched.
- Classic daily pivots place initial resistance near €3.19 and support around €2.68, with the 100-day SMA at roughly €2.71 acting as a nearby reference area on pullbacks.
Past performance is not a reliable indicator of future results.