Trading Gold Above $4K: Fear, Foresight or Simply FOMO?
The technicals remain bullish with plenty of factors cited on the fundamental front, and traders both large and small remain very much in majority buy territory.
Gold seems to have gone parabolic, breaking the $4,000 mark for the first time ever. Traders on our end were majority long a year ago but the public in general wouldn’t have believed it would be this high this fast in reaching the noteworthy level. Plenty of reasons have been cited including (1) massive ETF inflows which according to the World Gold Council have had their strongest quarter on record with $26bn piling in, (2) strong central bank demand amidst rising uncertainty and geopolitical tension, (3) with plenty of smaller investors also piling in as the world feels like it’s teetering on the edge of about ten different crises, and a (4) dollar that while recovering off the lows is still down 9% this year with the Federal Reserve (Fed) expected to keep on cutting rates. Wall Street’s big names are fanning the flames too and forecasters have emerged with higher price targets and more so if investors really start ditching Treasuries.
Speaking of Treasuries, yields fell back slightly yesterday and so too in real terms, and market pricing (CME’s FedWatch) remains nearly fully in favor of a rate cut later this month out of the Fed, via significant majority on another 25bp (basis point) reduction in December, while a significant minority for a rate decrease in January.
In terms of central bank action, we had the Reserve Bank of New Zealand going for a larger 50bp rate cut taking their rate down to 2.5% and the kiwi with it falling about 1% this morning with policymakers citing subdued activity and downside risks and the Committee open to further easing. And while gold isn’t priced in the New Zealand dollar here, it goes to show that weakness in the economy – and US economic data disappointed yesterday – will likely result in more rate cuts globally that in turn aids the non-yielding precious metal.
As for the Fed where it matters most, we heard from a few FOMC (Federal Open Market Committee) members yesterday: Daly saying she doesn’t see a potential AI bubble threatening broader financial stability, Kashkari warning that drastic rate cuts could stoke inflation, and Miran who sees less tensions between their two goals compared to other policymakers. We’ll hear from FOMC members today, but more importantly minutes from their latest minutes will be on offer later today, and the 10-year auction to see if demand can keep up with supply.
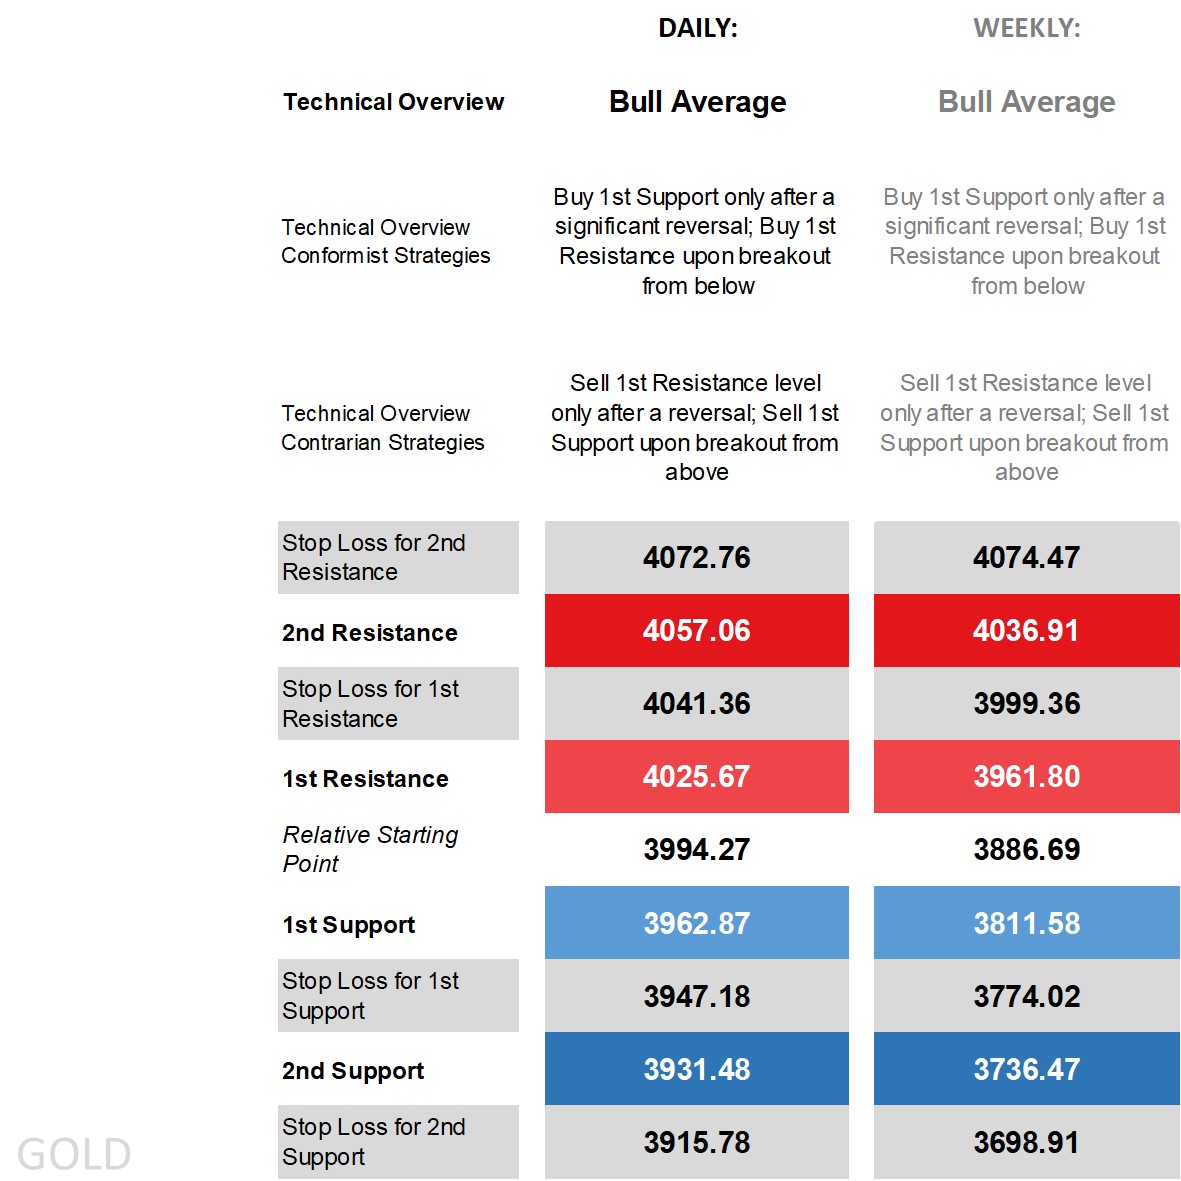
Gold’s technical overview, strategies and levels
Looking at the daily time frame and price is (given we’re at a record high) obviously above all its main moving averages (MA), walking the upper end of the band, on the DMI (Directional Movement Index) front positive given the clear margin of the +DI over the -DI, an RSI (Relative Strength Index) well in overbought territory (nearing 90), and an ADX (Average Directional Movement Index) clearly in trending territory. Positive technicals across the board makes it a bullish technical overview labelled as “bull average” in the table below in both daily and weekly time frames where the latter’s key technical indicators are also all flashing green. There is the matter of a record high combined with an uptick in volatility and gold getting further attention that can at times make the overview more volatile than bullish.
That matters from a strategic standpoint, as currently traders who believe the current trend will continue fall into the conformist camp with buy strategies but where if via 1st Support (whether the weekly or daily) only done after a significant reversal to avoid any volatile move going opposite, which would mean if price were (for any reason) to go back down to only buy after the level breaks significantly and price recovers. Those working off the 1st Resistance doing so via breakout where it has already reached this week’s 2nd Resistance giving weekly conformist buy-breakouts the win and so far the edge for daily conformist buy-breakout strategies.
Those who see a reversal or exhaustion and some sort of pullback in price fall into the contrarian camp with sell strategies whether selling after a reversal off the 1st Resistance (or if working off the 2nd Resistance on the weekly time frame), or via sell-breakout should price manage to make it back down to the 1st Support levels.
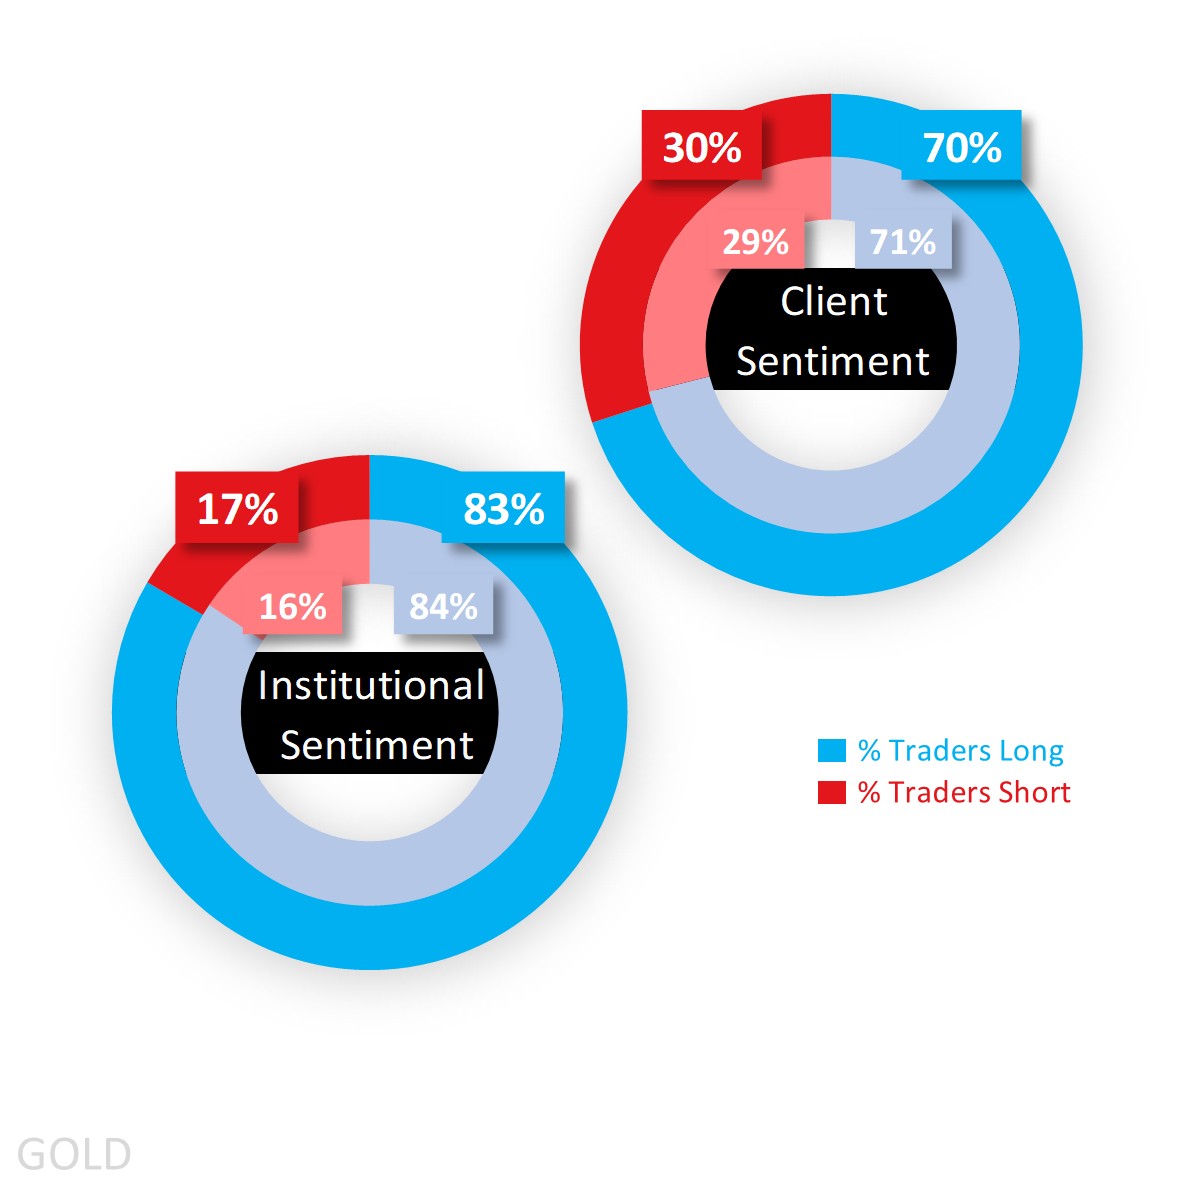
Capital.com’s client sentiment for Gold
When it comes to Capital.com’s own clients, it’s been a consistent story of majority buy bias, and when the trend really got going looked for opportunities to go long and stay long as it shook out range-traders who initially found zones to briefly short, with those selling against the trend not looking to stay in it for long. The latest print as of this morning is a heavy buy 70% and little changed from the start of the week where it was 71% with moves requiring oscillations and/or pullbacks to shift the narrative from trend-trading back to profit-taking.
As for CoT speculators (according to the latest Commitment of Traders report out of the CFTC), we didn’t get last Friday’s report due to the US government shutdown, but the figures from the week before shows they’re still extreme buy only a notch lower than a few weeks back when they were at 84% with the increase in longs (by 6,030 lots) larger than the increase in shorts (by 5,691 lots) but not in percentage terms.
Client sentiment mapped on the daily chart
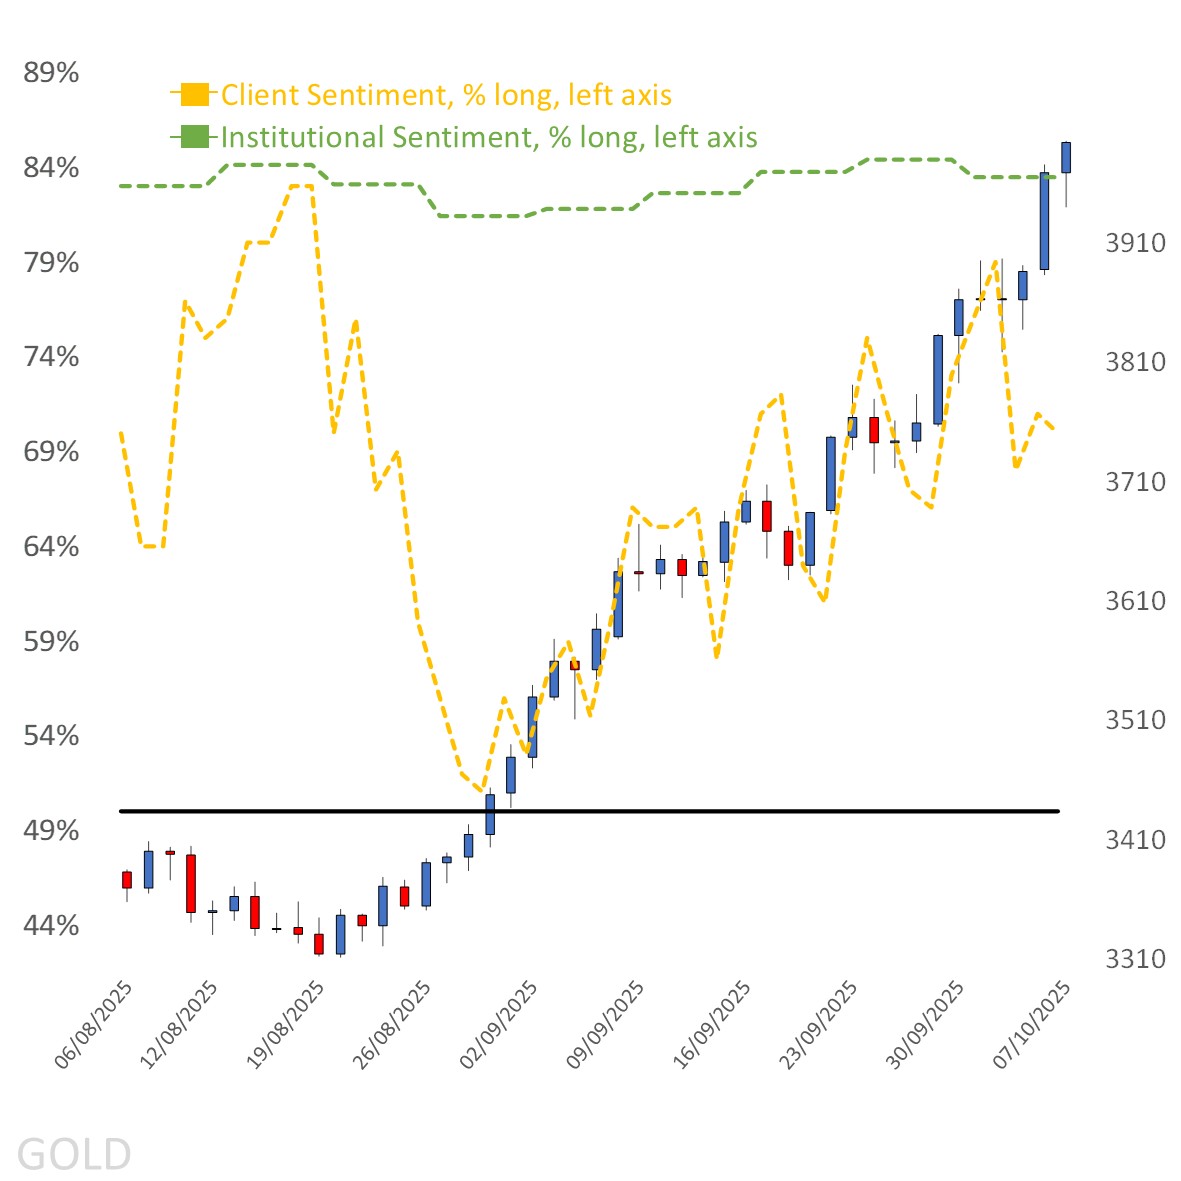 Source: Capital.com
Period: August 2025 – October 2025
Past performance is not an indicator of future results.
Gold’s chart on Capital.com’s platform with key technical indicators
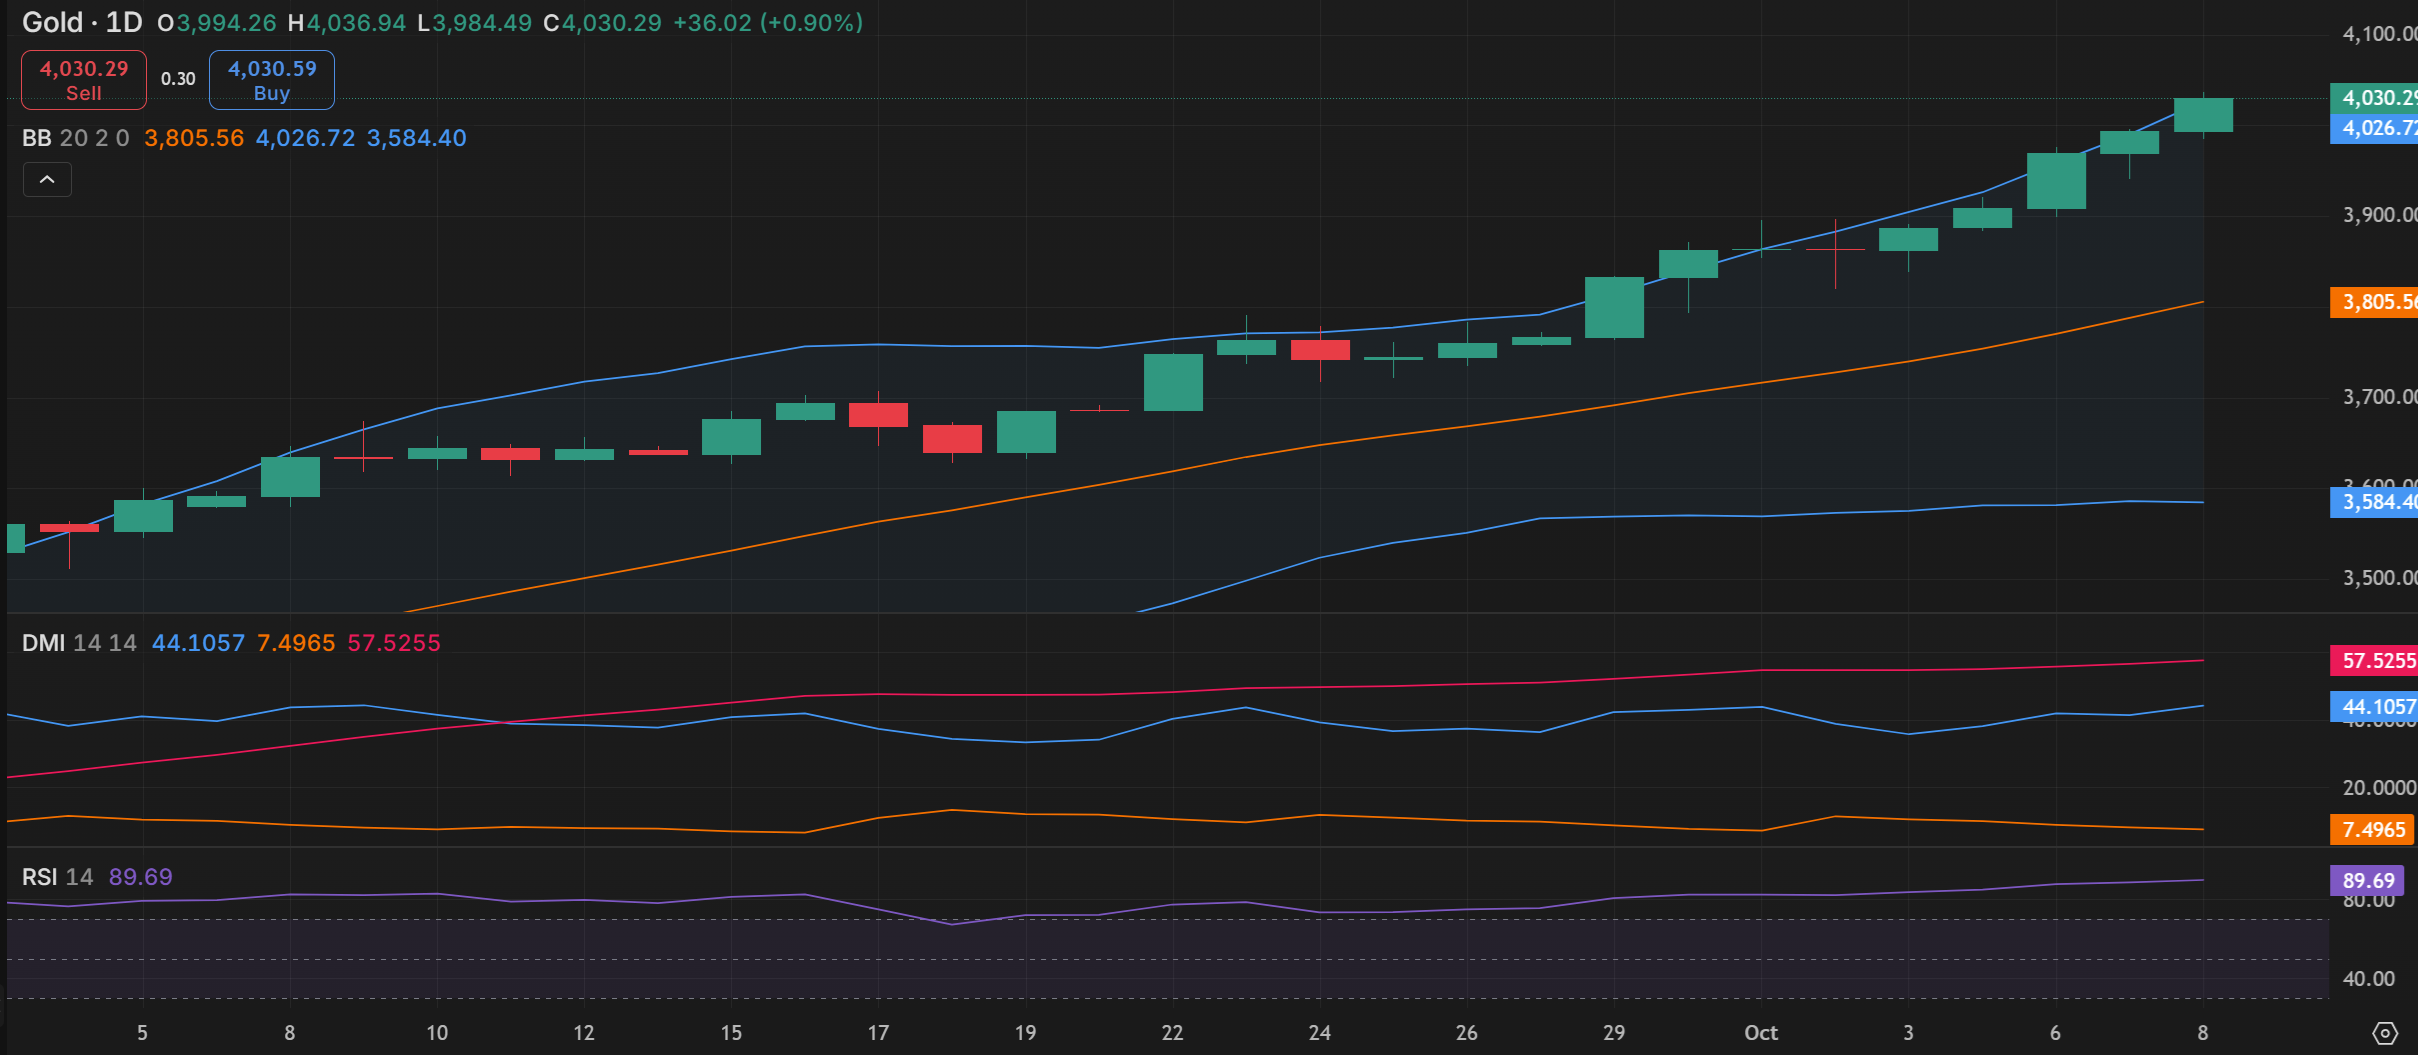
Source: Capital.com
Period: September 2025 – October 2025
Past performance is not an indicator of future results.