A new dimension to your trading charts
In response to client demand, we’ve boosted your trading charts by introducing multi-chart functionality on the Capital.com web platform – a flexible new way to display several charts on a single screen.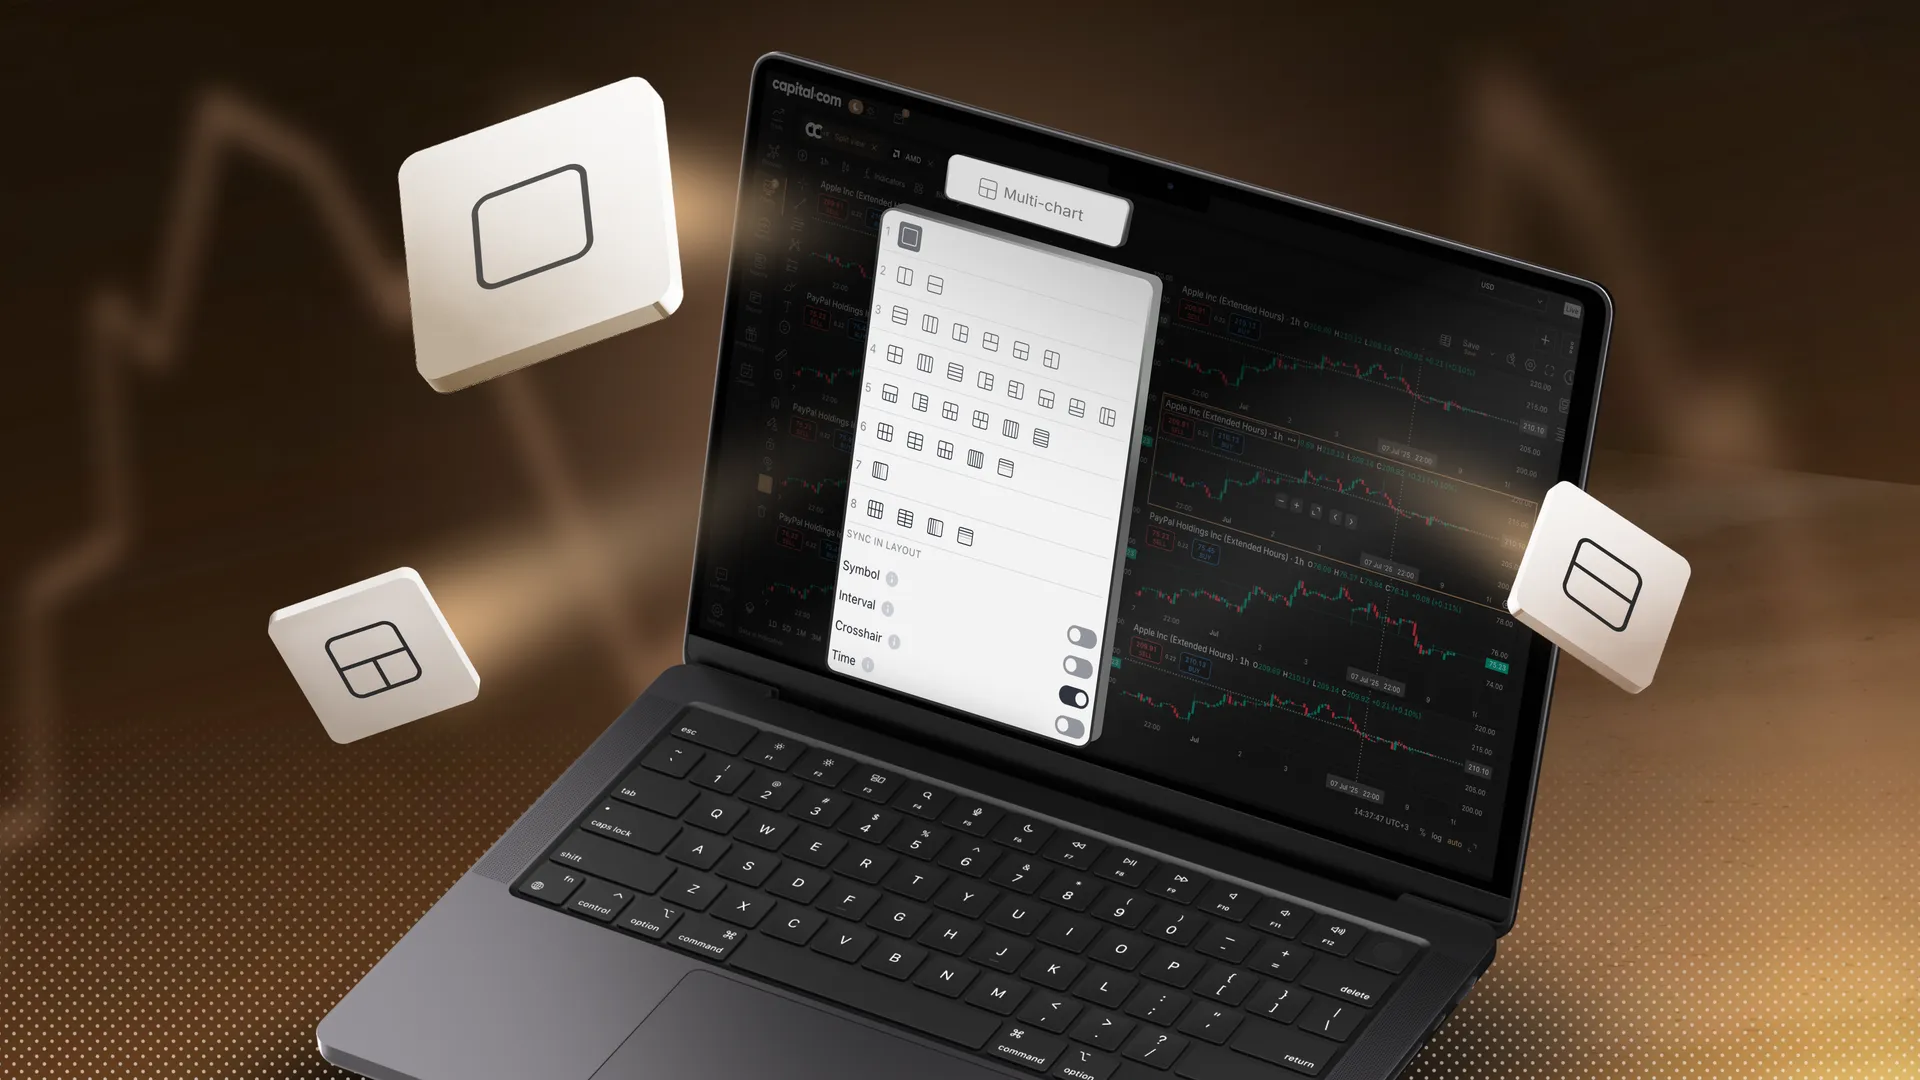
In response to client demand, we’ve boosted your trading charts by introducing multi-chart functionality on the Capital.com web platform – a flexible new way to display several charts on a single screen.
Whether you want to compare different timeframes of the same market or track multiple instruments side by side, multi-chart helps you monitor, analyse, and act with greater clarity – all within a layout that suits your trading style.
With multi-chart, you can:
- Track up to six charts side by side
- Explore diverse layouts to fine-tune your strategy
- Sync symbols, intervals, and crosshairs, as well as date and time ranges
Where to find it
You can access this feature by following these steps:
- Step 1Log in to the web platform and head to the ‘Charts’ tab.
- Step 2Choose your chart by clicking on the ‘+’ button in the top-right of the screen.
- Step 3Click the button at the top of the chart panel, next to ‘Save’. The default option shows a square.
- Step 4Choose your preferred layout.
- Step 5Enjoy a new freedom and flexibility in your trading.
How it works
-
One chart is always active, highlighted with a coloured border.
-
Chart tools (eg, indicators or drawings) apply only to the active chart.
-
You can create multiple chart tabs, each with its own configuration.
Want everything in sync?
Toggle options in the ‘Sync in layout’ section let you synchronise:
-
Symbols
-
Time intervals
-
Crosshairs
-
Time
-
Date range
Please note, multi-chart is available on our web platform only. For more information on this charting feature, see our additional help centre piece.