

Nvidia results preview: what to expect from Q3 after the AI sell-off
Revenue guidance of USD 108bn, a new interim CEO and an AI sell-off: what investors are watching as Nvidia reports its fiscal Q3 2027 results.
Nvidia reports its fiscal third-quarter 2027 results (August–October) on Tuesday 17 November, after the Wall Street close, at around 21:20 GMT. The company has guided revenue of USD 108bn, plus or minus 2%, which would be about 89% more than a year earlier.
The results arrive at a difficult moment for the stock. After a sell-off across AI-related stocks and a board inquiry, chief executive Jensen Huang resigned on 12 November and CFO Colette Kress became interim CEO. That day the shares fell as much as 14.3%, to USD 148.80, about 38% below their 6 October closing high (USD 239.24), and closed at USD 166.05 (−4.4%), 31% below that high. The day's low was the lowest since June 2025 and took the shares back to levels traded in November 2024.
Key data
| Ticker / exchangeNVDA · Nasdaq | Results date17 Nov, ~21:20 GMT | Market capUSD 4.01trn |
|---|---|---|
| Close (12/11)USD 166.05 (−4.4%) | 52-week rangeUSD 148.80 – 243.37 | Change in 2026 (to 12/11)−11.0% |
| P/E (TTM)21.0x | Beta (5Y)2.25 | Dividend yield0.60% |
All figures are in USD. Returns may increase or decrease as a result of currency fluctuations.
Source: StockAnalysis.com (NVDA quote, statistics and daily closes, close on 12/11/2026), Capital.com calculations. Results timing: NVIDIA.
Past performance is not a reliable indicator of future results.
Jensen Huang leaves Nvidia days before the results
On 12 November the board announced that Jensen Huang had resigned as president, chief executive and member of the board, effective immediately. Colette Kress, CFO since 2013, becomes interim CEO and will remain CFO until a permanent successor is named; the board will consider internal and external candidates. Harvey C. Jones was appointed the company's first chair of the board. Nvidia said it expected operations, customer commitments and the product roadmap to continue without interruption and kept its results date of 17 November.
The case began on 8 November, with a board inquiry into Huang's relationship with a former executive of Megaspeed, a Singapore data centre customer, whom US intelligence agencies suspect of links to Chinese intelligence services, according to CBS News. On 11 November The New York Times reported a second relationship, with a company vice president, according to The Next Web.
The results on 17 November cover the August–October quarter, which has already ended; the reports concern the company's leadership, not its accounts for that period.
Past performance is not a reliable indicator of future results.
Previous results: four quarters above guidance
In each of the last four quarters, Nvidia's revenue came in about 5% above the midpoint of its own guidance. The share price reaction the following day was negative in three of the four.
| Quarter | Revenue guidance (USD bn) | Revenue (USD bn) | vs guidance | Y/Y | GAAP gross margin | Share price, next day |
|---|---|---|---|---|---|---|
| Q2 FY27 (to Jul 2026) | 91.0 | 96.2 | +5.7% | +106% | 75.0% | +8.7% |
| Q1 FY27 (to Apr 2026) | 78.0 | 81.6 | +4.6% | +85% | 74.9% | −1.8% |
| Q4 FY26 (to Jan 2026) | 65.0 | 68.1 | +4.8% | +73% | 75.0% | −5.5% |
| Q3 FY26 (to Oct 2025) | 54.0 | 57.0 | +5.6% | +62% | 73.4% | −3.2% |
Source: NVIDIA CFO commentaries (8-K, SEC) for guidance and results; StockAnalysis.com (daily closes) for the share price change on the trading day after each report; Capital.com calculations. vs guidance = revenue versus the midpoint of the previous quarter's guidance.
Past performance is not a reliable indicator of future results.
Q2 FY27 in detail. Revenue reached a record USD 96.2bn, up 106% year on year. Data Center revenue rose 117% to USD 89.0bn, driven by the ramp of Blackwell Ultra, and GAAP net income was USD 59.7bn.
Balance sheet and commitments. Supply and capacity commitments rose from USD 119bn to USD 279bn, mostly for memory, and receivables rose to USD 63.1bn, which the company linked to extended payment terms on large multi-quarter agreements. Nvidia also agreed to guarantees capped at USD 105bn for a data centre campus in Ohio linked to leases to OpenAI.
What the market expects
Analysts' average estimates are slightly above the company's revenue guidance, according to data compiled by Yahoo Finance.
| Revenue guidance Q3 FY27USD 108.0bn ±2%Company, 26/08/2026 | Revenue consensus Q3USD 109.0bnRange USD 104.9–116.3bn | EPS consensus Q3USD 2.47Range USD 2.34–2.70 |
|---|---|---|
| Gross margin guidance74.0% ±0.5 ptsQ2: 75.0% | Revenue consensus Q4 FY27USD 124.7bnEPS USD 2.75 | Consensus fiscal 2027 / 2028USD 412bn / USD 692bnRevenue |
Source: NVIDIA Q2 FY27 CFO commentary (guidance); Yahoo Finance (consensus estimates as of 11/11/2026; 44 analysts for Q3 revenue).
Past performance is not a reliable indicator of future results.
What options are pricing in. Options data compiled by Bloomberg and cited by Investing.com on 10 November, before Huang's departure, pointed to a move of about 6.7% in Nvidia's shares, in either direction, after the results. This measure, known as the implied move, is derived from option prices and is not a Capital.com forecast.
Forecasts are not a reliable indicator of future performance.
Points to watch on 17 November
- Revenue against the USD 108bn guidance and the USD 109bn consensus, and above all the guidance for the fourth quarter, against a consensus of USD 124.7bn.
- The ramp of Vera Rubin, Nvidia's new generation of AI chips and systems that succeeds Blackwell: the CFO said she expected it to account for about 20% of Data Center revenue (sales to data centres) in Q3, according to The Motley Fool.
- Gross margin, guided down to 74.0% from 75.0%, and working capital: receivables, inventory and supply commitments.
- China, which is excluded from the outlook, and the first comments from Colette Kress as interim CEO, including on the company's investment commitments.
Market catalysts: what else could move the shares
Beyond the numbers, several events around the results could add to volatility.
- New leadership. Bernstein said it was not worried about near-term effects on the business but pointed to uncertainty over the ability of any new CEO to replace Huang. Stifel's Ruben Roy said that, for the shares, how the transition is executed matters more, according to Yahoo Finance. These are the views of third-party analysts, not Capital.com.
- China and Congress. The Information reported that at least USD 7.5bn of Nvidia hardware has reached Chinese companies through a network linked to that executive, which Nvidia has not confirmed. Three House committee chairs have asked Huang for a closed-door briefing on 18 November, the day after the results, according to Yahoo Finance.
- AI spending and regulation. Investors are questioning how long AI infrastructure spending can be sustained, which pushed the Nasdaq 100 into correction on 2 November, according to Bloomberg. Part of the early-November sell-off was also linked to concerns about stricter rules after the midterm elections, according to Fox Business.
- Anthropic IPO. On 10 November Anthropic set a range of USD 70 to 78 per share for its stock market listing, which could value the company at about USD 1.4trn. Alongside the offering, a group of technology companies including Nvidia plans to invest USD 26bn in the company. Demand for the initial public offering and CoreWeave's results were linked to the rebound in AI-related stocks on the morning of 11 November, before the Wall Street open, according to City AM.
AI stocks have already fallen sharply, but the outlook remains uncertain
Nvidia is not alone. Several AI-related stocks, from chipmakers and cloud providers to suppliers of networking, power and data centre infrastructure, are well below their highs of the past year.
| Company | 52-week closing high | Change from high (to 12/11) | Change in 2026 (to 12/11) |
|---|---|---|---|
| CoreWeave (CRWV) | USD 137.98 (06/05) | −59.0% | −21.0% |
| Intel (INTC) | USD 140.94 (22/06) | −56.6% | +65.9% |
| Arm (ARM, ADR) | USD 439.46 (18/06) | −54.5% | +82.8% |
| Credo (CRDO) | USD 302.52 (22/06) | −53.8% | −2.9% |
| Astera Labs (ALAB) | USD 483.02 (30/06) | −52.8% | +36.9% |
| Oracle (ORCL) | USD 248.15 (01/06) | −48.8% | −34.8% |
| Marvell (MRVL) | USD 316.43 (04/06) | −48.0% | +93.5% |
| Comfort Systems USA (FIX) | USD 2,066.51 (22/06) | −45.5% | +20.7% |
| Vertiv (VRT) | USD 376.23 (14/05) | −44.3% | +29.4% |
| Bloom Energy (BE) | USD 345.85 (22/06) | −41.6% | +132.4% |
| Micron (MU) | USD 1,213.56 (25/06) | −34.2% | +179.7% |
| Nvidia (NVDA) | USD 239.24 (06/10) | −30.6% | −11.0% |
| Broadcom (AVGO) | USD 481.57 (02/06) | −24.3% | +5.3% |
| Meta (META) | USD 777.59 (24/09) | −19.8% | −5.5% |
| TSMC (TSM, ADR) | USD 485.80 (05/10) | −16.5% | +33.5% |
| AMD (AMD) | USD 649.42 (06/10) | −9.9% | +173.2% |
| Microsoft (MSFT) | USD 555.80 (04/11) | −5.9% | +8.2% |
Source: StockAnalysis.com (daily closes, last 12 months to 12/11/2026), Capital.com calculations.
Past performance is not a reliable indicator of future results.
Many of these companies supply products for the same data centres that use Nvidia's chips, from networking and memory to power and cooling. As a result, Nvidia's results could also influence the shares of these companies, in either direction.
Technical analysis
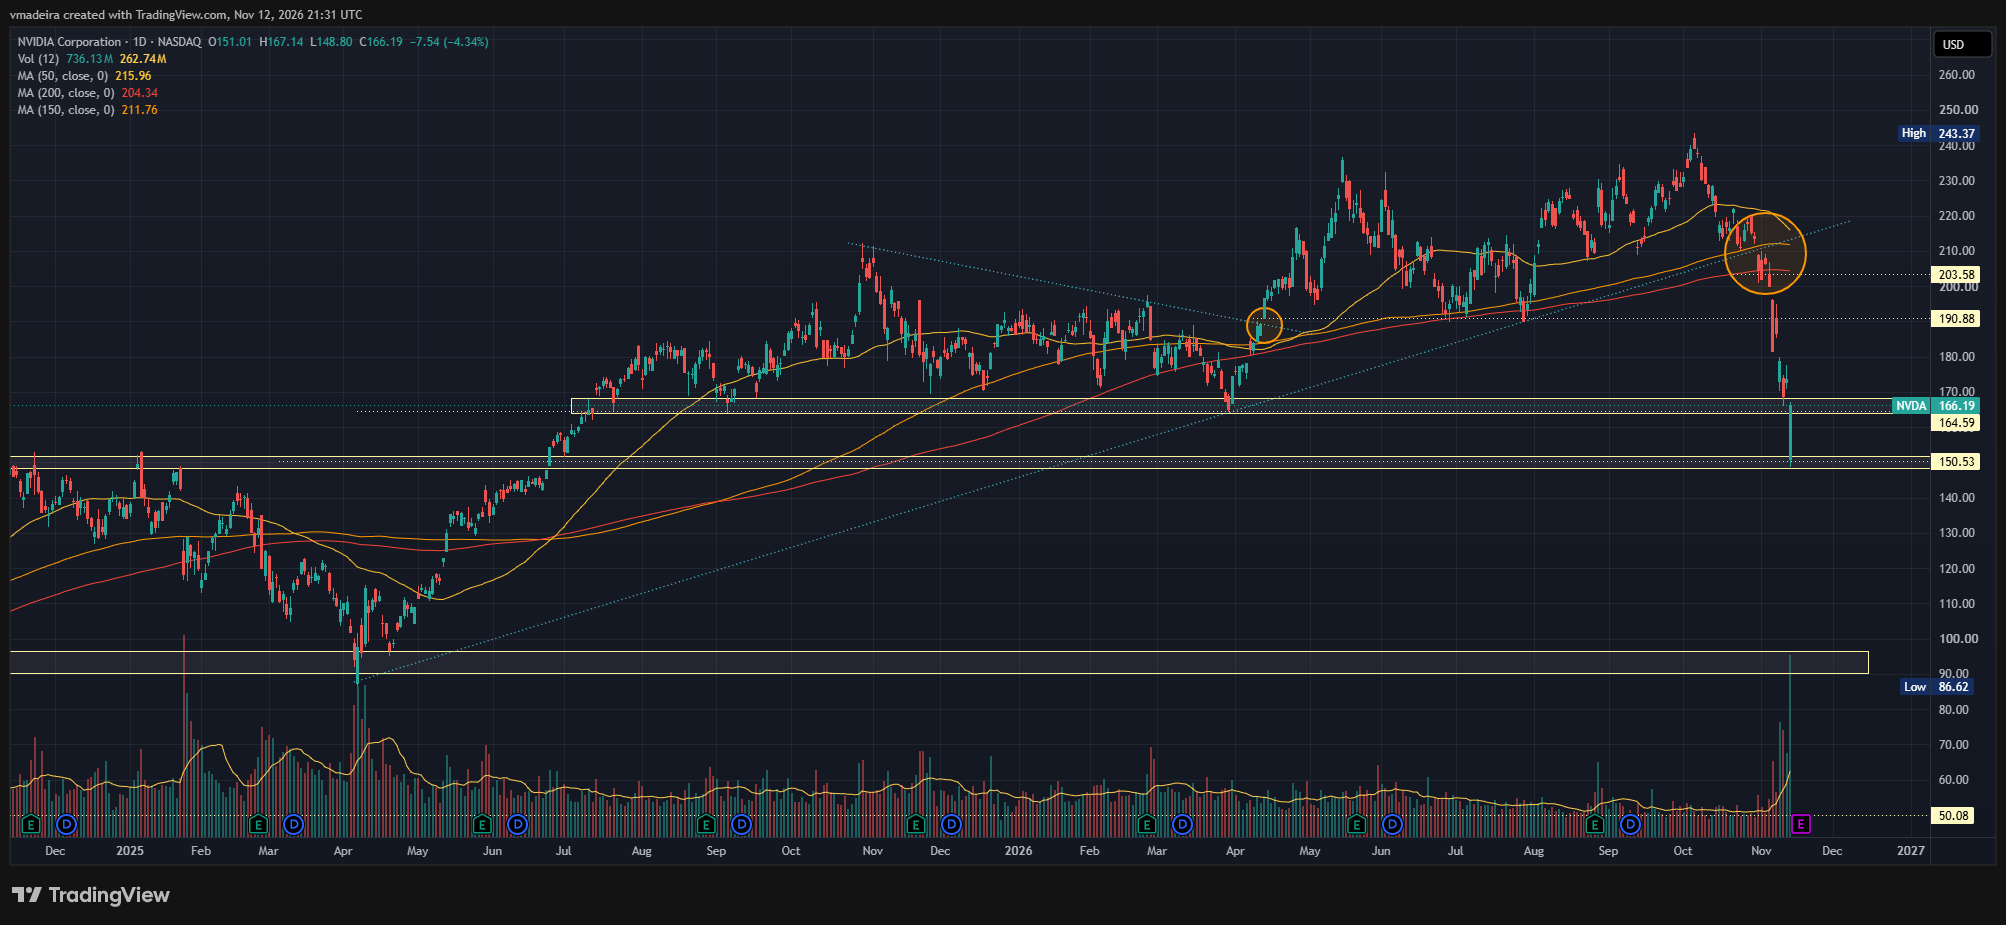
Nvidia's shares are 31% below their 6 October closing high of USD 239.24 and below their 50-, 150- and 200-day simple moving averages an which could indicate that the short-term trend is no longer upward. During the 12 November session they were as much as about 39% below their 52-week intraday high (USd the trend line marked in blue on the chartD 243.37). The fall was steep: between the 22 October close (USD 212.21) and the 12 November low (USD 148.80), the shares lost about 30%, breaking the areas near USD 204 and USD 191 and the area between around USD 164 and USD 168, formed by the lows of late March 2026. The 12 November low, set on the day the CEO resigned, was in the area between around USD 148 and USD 153, where the highs of November 2024 (USD 152.89 on 21 November 2024) and January 2025 (USD 153.13 on 7 January 2025) lie. By the close that day the shares had moved back to about USD 166, inside the USD 164–168 area.
The nearest resistance is near USD 191, the area of the June and July 2026 lows (USD 190.01 on 29 July), followed by the area near USD 204, formed by the mid-July 2026 lows (USD 203.00 on 13 July).
Source: TradingView (Capital.com), daily chart, NVDA, December 2024 to November 2026; data as of 12/11/2026 (chart taken at 21:31 UTC, after the close). Moving averages: 50-day (yellow), 150-day (orange) and 200-day (red); trend line in blue.
Past performance is not a reliable indicator of future results.
Reference data: close on 12/11 USD 166.05 (−4.4%); 12/11 session low USD 148.80; 52-week range USD 148.80–243.37 (StockAnalysis.com).