

Netflix stock forecast: Q2 results, softer Q3 guidance
Netflix is a US streaming company whose shares fell after its July 2026 results, as third-quarter guidance pointed to slower growth and it reduced the frequency of viewership reporting. Explore third-party NFLX price targets and technical analysis.
Netflix, Inc. (NFLX) was trading near $68.89 at 3:49pm UTC on 23 July 2026, within the day’s range of $68.01–$70.32. Past performance is not a reliable indicator of future results.
The pressure followed Netflix's second-quarter 2026 earnings release on 16 July. The company reported adjusted earnings per share (EPS) of $0.80 on revenue of $12.56bn, broadly in line with expectations. However, third-quarter revenue guidance of $12.86bn implied a slowdown to 11% foreign exchange-neutral growth, contributing to a negative market reaction (Reuters, 16 July 2026).
Sentiment weakened further after Netflix said it would publish its 'What We Watched' viewer engagement report annually rather than twice a year (Variety, 16 July 2026). Some market participants said the change would provide less frequent insight into audience trends (Deadline, 16 July 2026). Shares fell as much as 8.7% in the following session as investors weighed the weaker near-term outlook against management's reaffirmed full-year 2026 growth target of 13%–14% (FinancialContent, 17 July 2026).
Third-party Netflix outlook: Q3 guidance and varied targets
As of 23 July 2026, third-party Netflix stock predictions indicate a wide range of possible outcomes over the next 12 months, reflecting different assessments of the company's slowing growth.
Baird (individual broker target)
Baird set a $90 price target for Netflix and maintained an Outperform rating; the target was above the market price at the time of publication. The forecast partly reflected expectations that advertising revenue growth would continue into 2027 (Yahoo Finance, 22 July 2026).
Morgan Stanley (individual broker target)
Morgan Stanley set a 12-month price target of $83 and maintained an Overweight rating, while reducing its previous estimate of $90. The 17 July 2026 forecast assumed that margin pressure would ease as content spending normalised in 2027 (MarketScreener, 17 July 2026).
Pivotal Research (individual broker target)
Pivotal Research set a 12-month price target of $70, the lowest of the active Wall Street estimates cited here, and maintained a Hold rating. Its 17 July 2026 projection reflected expectations of limited near-term price growth as subscriber growth slowed further in late 2026 (MarketBeat, 17 July 2026).
MarketBeat (consensus overview)
MarketBeat's aggregation of 55 analysts showed an average 12-month price target of $103.48, with estimates ranging from $70–$151.40 and a Moderate Buy consensus rating. The 24 July 2026 update highlighted continued variation between forecasts as analysts revised their 2027 earnings assumptions (MarketBeat, 24 July 2026).
Investing.com (consensus overview)
Investing.com reported an average 12-month price target of $95.28, based on 45 analyst estimates. Targets ranged from $70–$135, with a Buy consensus among 42 contributors. The forecast, dated 16 July 2026, preceded some analysts' post-earnings revisions (Investing.com, 16 July 2026).
Predictions and third-party forecasts are inherently uncertain, as they cannot fully account for unexpected market developments. Past performance is not a reliable indicator of future results.
Netflix earnings: latest results and next report
Netflix reported second-quarter 2026 revenue of $12.56bn on 16 July, up 13.4% year on year, with diluted EPS of $0.80. The results were broadly in line with LSEG's Wall Street consensus forecasts of $12.60bn in revenue and $0.79 a share (Netflix Investor Relations, 15 June 2026; Reuters, 16 July 2026).
Net income totalled $3.40bn. The company also said viewing hours increased by 2% in the first half of 2026, compared with 1.5% in the same period of 2025. Netflix attributed the comparison partly to competing sporting events, including the Winter Olympics and World Cup (CNBC, 16 July 2026).
Alongside the results, Netflix issued third-quarter guidance of $12.86bn in revenue and diluted EPS of $0.82. Both figures were below analyst forecasts of $13bn and $0.84 a share (Reuters, 16 July 2026).
The company also confirmed that it would publish viewing-hours data less frequently, moving the 'What We Watched' report to an annual schedule from January 2027 (Variety, 16 July 2026). Netflix had already stopped publishing quarterly subscriber figures in 2025 (IMDb, 18 April 2026).
Netflix said the change was intended 'to keep the focus on our primary financial metrics, revenue and operating profit'. Shares fell by more than 8% in after-hours trading following the announcement (Deadline, 16 July 2026).
Netflix's next earnings release, covering the third quarter of 2026, is expected on 20 October 2026, according to financial data providers. The company had not formally confirmed the date at the time of writing (Wall Street Horizon, 24 July 2026).
NFLX stock price: technical overview
As of 3:49pm UTC on 23 July 2026, the NFLX stock price trades at $68.89, below the cited moving-average cluster. The 20-, 50-, 100- and 200-day simple moving averages (SMAs) stand at approximately $73, $79, $87 and $93, respectively. The 200-day exponential moving average (EMA) sits near $90, providing a similar longer-term reference.
The 20-day SMA remains below the 50-day SMA, an alignment that technical analysts may interpret as weaker short-term momentum. However, moving averages track past prices and do not predict future movements.
The 14-day relative strength index (RSI) stands near 33, close to the level commonly described as oversold. The 14-day average directional index (ADX) reads near 35, indicating an established directional move under conventional interpretations, according to TradingView data.
The moving average convergence divergence (MACD) reading remains negative at approximately −2.8, while the stochastic %K stands near 27. Together, these readings suggest that downward momentum remained present at the time of measurement, although technical indicators can produce delayed or false signals.
Above the current price, the classic S1 level near $70, central pivot near $76 and R1 pivot near $82 provide successive technical reference points, according to TradingView’s pivot table. The 100-day SMA near $87 and R2 pivot near $93 provide further overhead references (TradingView, 23 July 2026).
These levels change with the underlying data and should not be treated as guaranteed support, resistance or price targets. This technical analysis is for informational purposes only and does not constitute financial advice or a recommendation to buy or sell any instrument.
Netflix share price history (2024–2026)
On 24 July 2024, NFLX’s stock price closed at $63.90. During that period, market commentary often linked its performance to subscriber growth in the ad-supported tier and measures addressing password sharing.
The stock continued to rise through 2025, reaching an all-time closing high of $133.91 on 30 June. Commentators cited factors including Netflix’s content slate and advertising growth.
Price movements then became more variable. NFLX fell to $91.10 by 2 January 2026 during a period of weaker sentiment towards technology shares, before recovering to $108.05 on 15 April. It fell to $97.48 in the following session.
Volatility increased in July 2026. Shares traded near $77.79 on 2 July before falling to $67.85 on 16 July following the second-quarter earnings release. The move came after the company issued lower-than-expected revenue guidance and confirmed that it would publish viewership data less frequently.
NFLX closed at $68.82 on 23 July 2026, approximately 44.6% below its June 2025 peak and around 24.4% lower since the start of the year.

Past performance is not a reliable indicator of future results. Share prices are indicative and may differ from live market prices.
Netflix (NFLX): Capital.com analyst view
Netflix’s share price fell from its June 2025 peak of $133.91 to approximately $68.89 by 23 July 2026.
The decline coincided with slower revenue growth guidance, less frequent viewership disclosures and questions about whether subscriber growth could maintain its earlier pace. Some market participants may regard reduced disclosure as a potential constraint on sentiment. Others may see the greater emphasis on revenue and operating profit as a way to focus attention on core financial performance rather than engagement data alone.
The move also occurred during a broader reassessment of streaming-sector valuations, as investors weighed slower subscriber growth against continued advertising revenue expansion and reaffirmed full-year guidance.
Capital.com’s client sentiment for Netflix CFDs
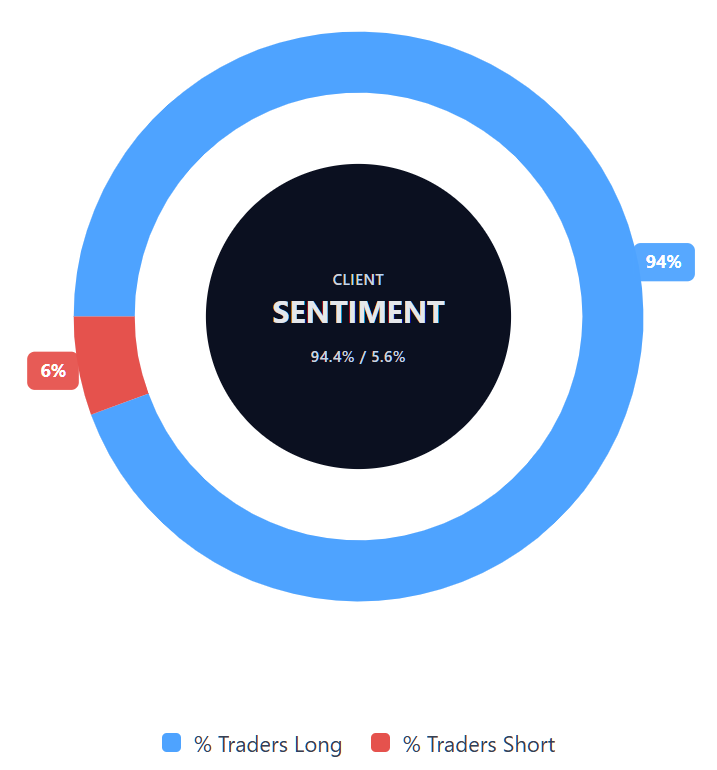
As of 23 July 2026, Capital.com client positioning in Netflix CFDs is weighted towards long positions, with 94.4% long and 5.6% short. This represents a difference of 88.8 percentage points. The figures reflect open positions held by Capital.com clients at the time of measurement. They do not represent the wider market and can change. Client sentiment does not indicate how the price will move in future.
Summary – Netflix 2026
- As of 3:49pm UTC on 23 July 2026, Netflix (NFLX) traded near $68.89, below its June 2025 all-time high of $133.91.
- Technical indicators placed the price below the cited moving-average cluster. The RSI stood near 33, while the ADX reading of approximately 35 indicated an established directional move under conventional technical interpretations.
- Factors under consideration included slower revenue growth guidance, less frequent viewership disclosures and questions about subscriber momentum following an earlier period of expansion.
- Market attention focused on the 16 July earnings report, which showed second-quarter results broadly in line with consensus forecasts but third-quarter guidance below analysts’ estimates. Several analysts subsequently revised their price targets.
Past performance is not a reliable indicator of future results.
FAQ
Who owns the most Netflix stock?
The article does not identify Netflix’s largest shareholder. Ownership figures can also change as institutional investors rebalance their holdings and companies update regulatory filings. Investors researching Netflix’s shareholder structure should check the latest company filings and institutional ownership data. These records can show which asset managers, funds or individual shareholders hold the largest positions at a given reporting date.
What is the five-year Netflix share price forecast?
The article does not provide a five-year NFLX stock forecast. The analyst targets cited cover a 12-month period and range from $70–$151.40, with consensus averages between approximately $95 and $103. Longer-term forecasts involve greater uncertainty because they depend on assumptions about revenue, margins, advertising growth, subscriber trends, competition and wider market conditions. Forecasts can change and may prove inaccurate.
Is Netflix a good stock to buy?
Whether Netflix is a suitable stock depends on an individual’s objectives, financial circumstances and risk tolerance. The article highlights both supportive and negative factors, including advertising revenue growth, reaffirmed full-year guidance, slower near-term growth and less frequent viewership disclosures. Analyst targets also vary widely. This information does not establish whether Netflix is a good stock to buy and should not be treated as financial advice.
Could Netflix stock go up or down?
Yes. Netflix’s share price could move in either direction in response to earnings, guidance, advertising performance, subscriber trends, content spending, competition and wider market conditions. The article also shows that analyst expectations differ significantly, while technical indicators can produce delayed or false signals. Price targets and forecasts are not guarantees, and unexpected developments can affect the stock more quickly than published estimates account for.
Should I invest in Netflix stock?
The article does not recommend investing in Netflix stock. It presents recent financial results, analyst forecasts, technical indicators and price history for informational purposes. Any decision to invest would require consideration of personal goals, time horizon, financial position and ability to absorb losses. Past performance is not a reliable indicator of future results, and third-party forecasts cannot account for every factor that may affect Netflix’s share price.
Can I trade Netflix CFDs on Capital.com?
Yes, you can trade Netflix CFDs on Capital.com. Trading share CFDs lets you speculate on price movements without owning the underlying asset and to take long or short positions. However, contracts for difference (CFDs) are traded on margin, and leverage amplifies both profits and losses. You should ensure you understand how CFD trading works, assess your risk tolerance, and recognise that losses can occur quickly.