

Michael Kramer: How to Analyse Costco's Earnings: A Framework
An earnings preview article by Michael Kramer (Mott Capital Management), commissioned as part of Capital.com's Earnings Preview Content Series.
(Past performance is not a reliable indicator of future results)
The Results
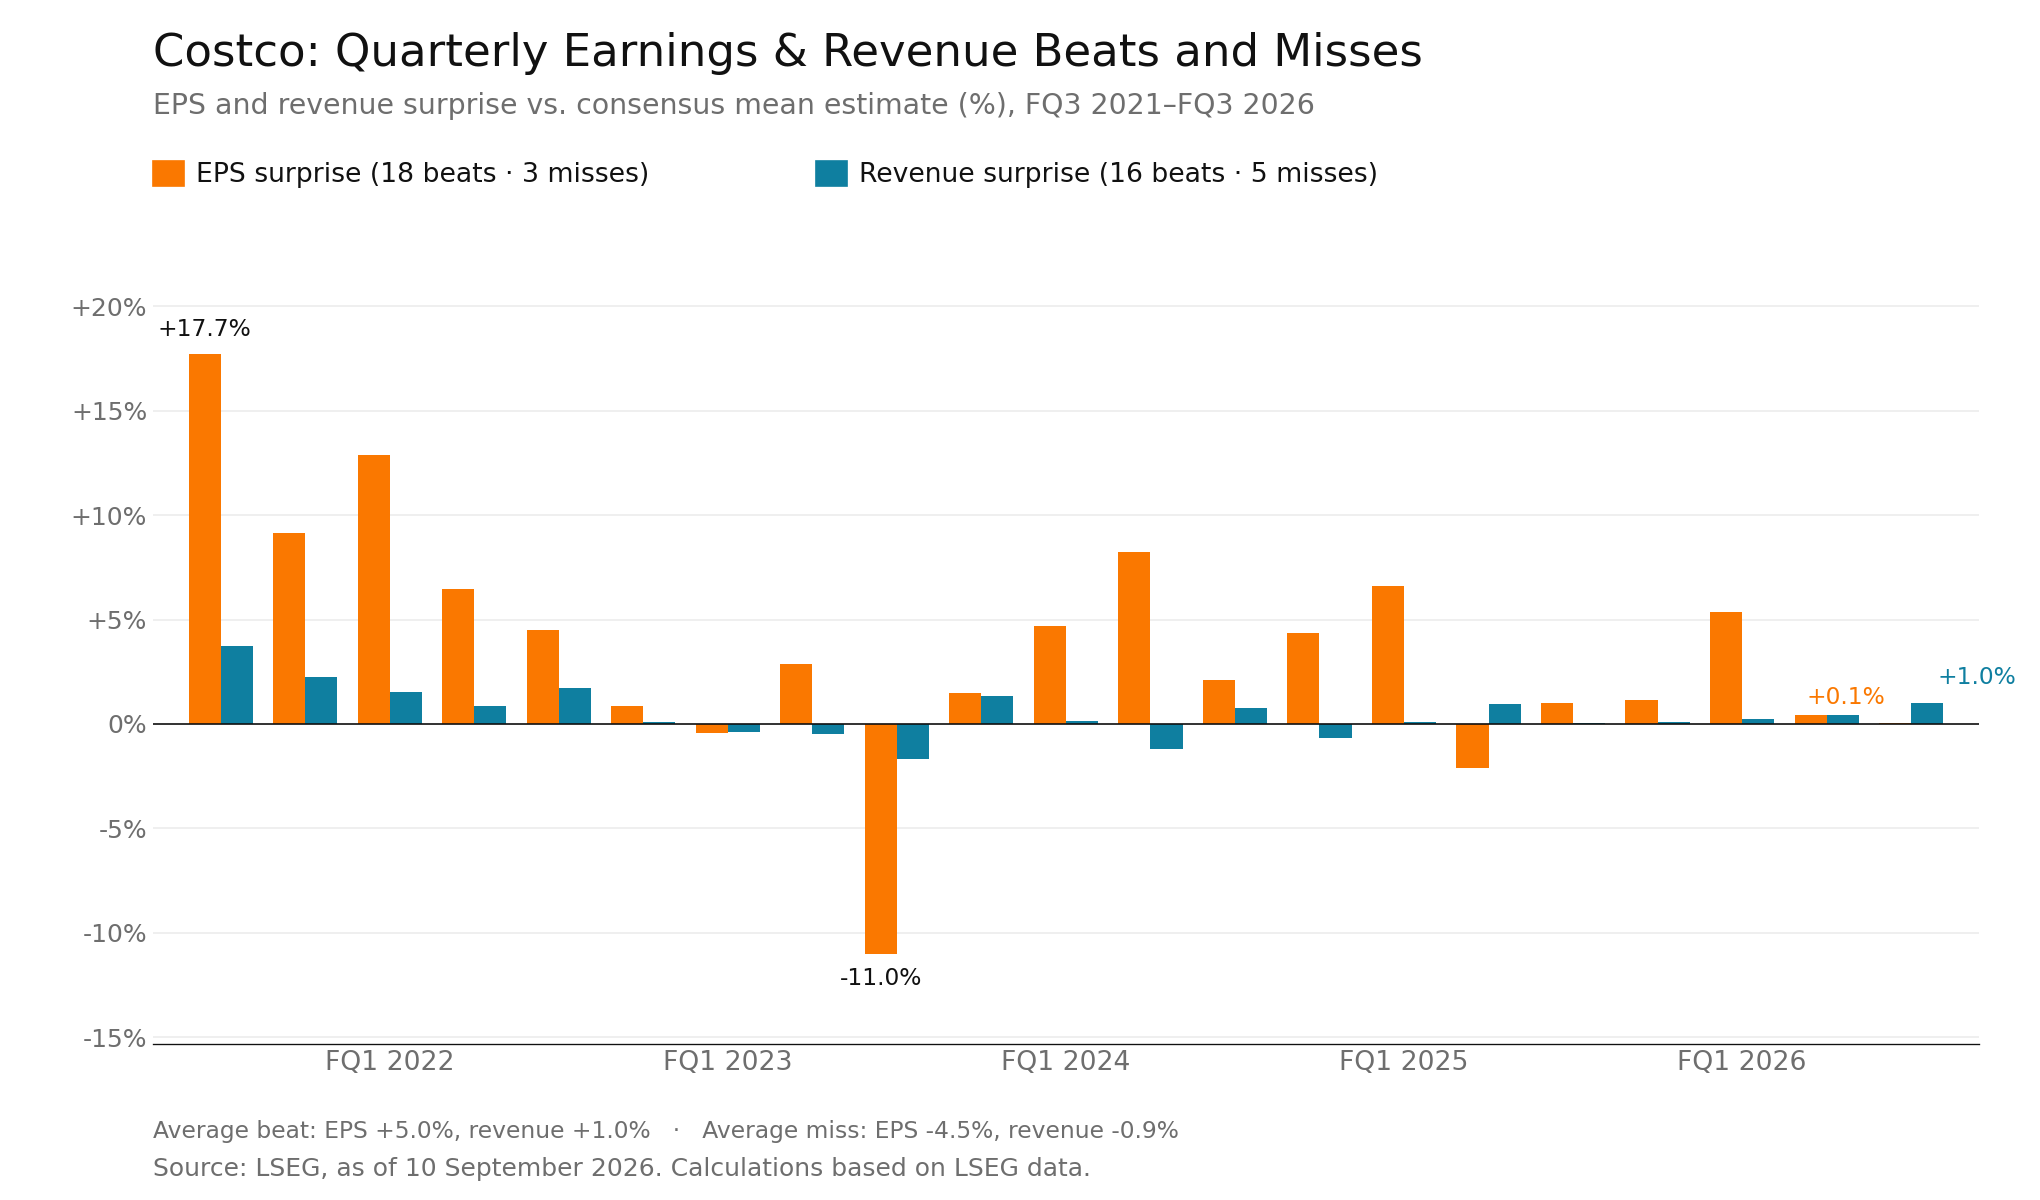
Costco’s earnings-per-share (EPS) surprises have varied more widely than its revenue surprises relative to analysts’ consensus estimates. Since the fiscal third quarter of 2021, Costco has beaten analysts’ revenue estimates 16 of 21 times and earnings estimates 18 of 21 times. Across the positive surprises shown, EPS exceeded the consensus mean estimate by an average of 5.0%. Across the negative surprises, EPS was below consensus by an average of 4.5%. Positive revenue surprises averaged 1.0%, while negative revenue surprises averaged 0.9%.
(Past performance is not a reliable indicator of future results)
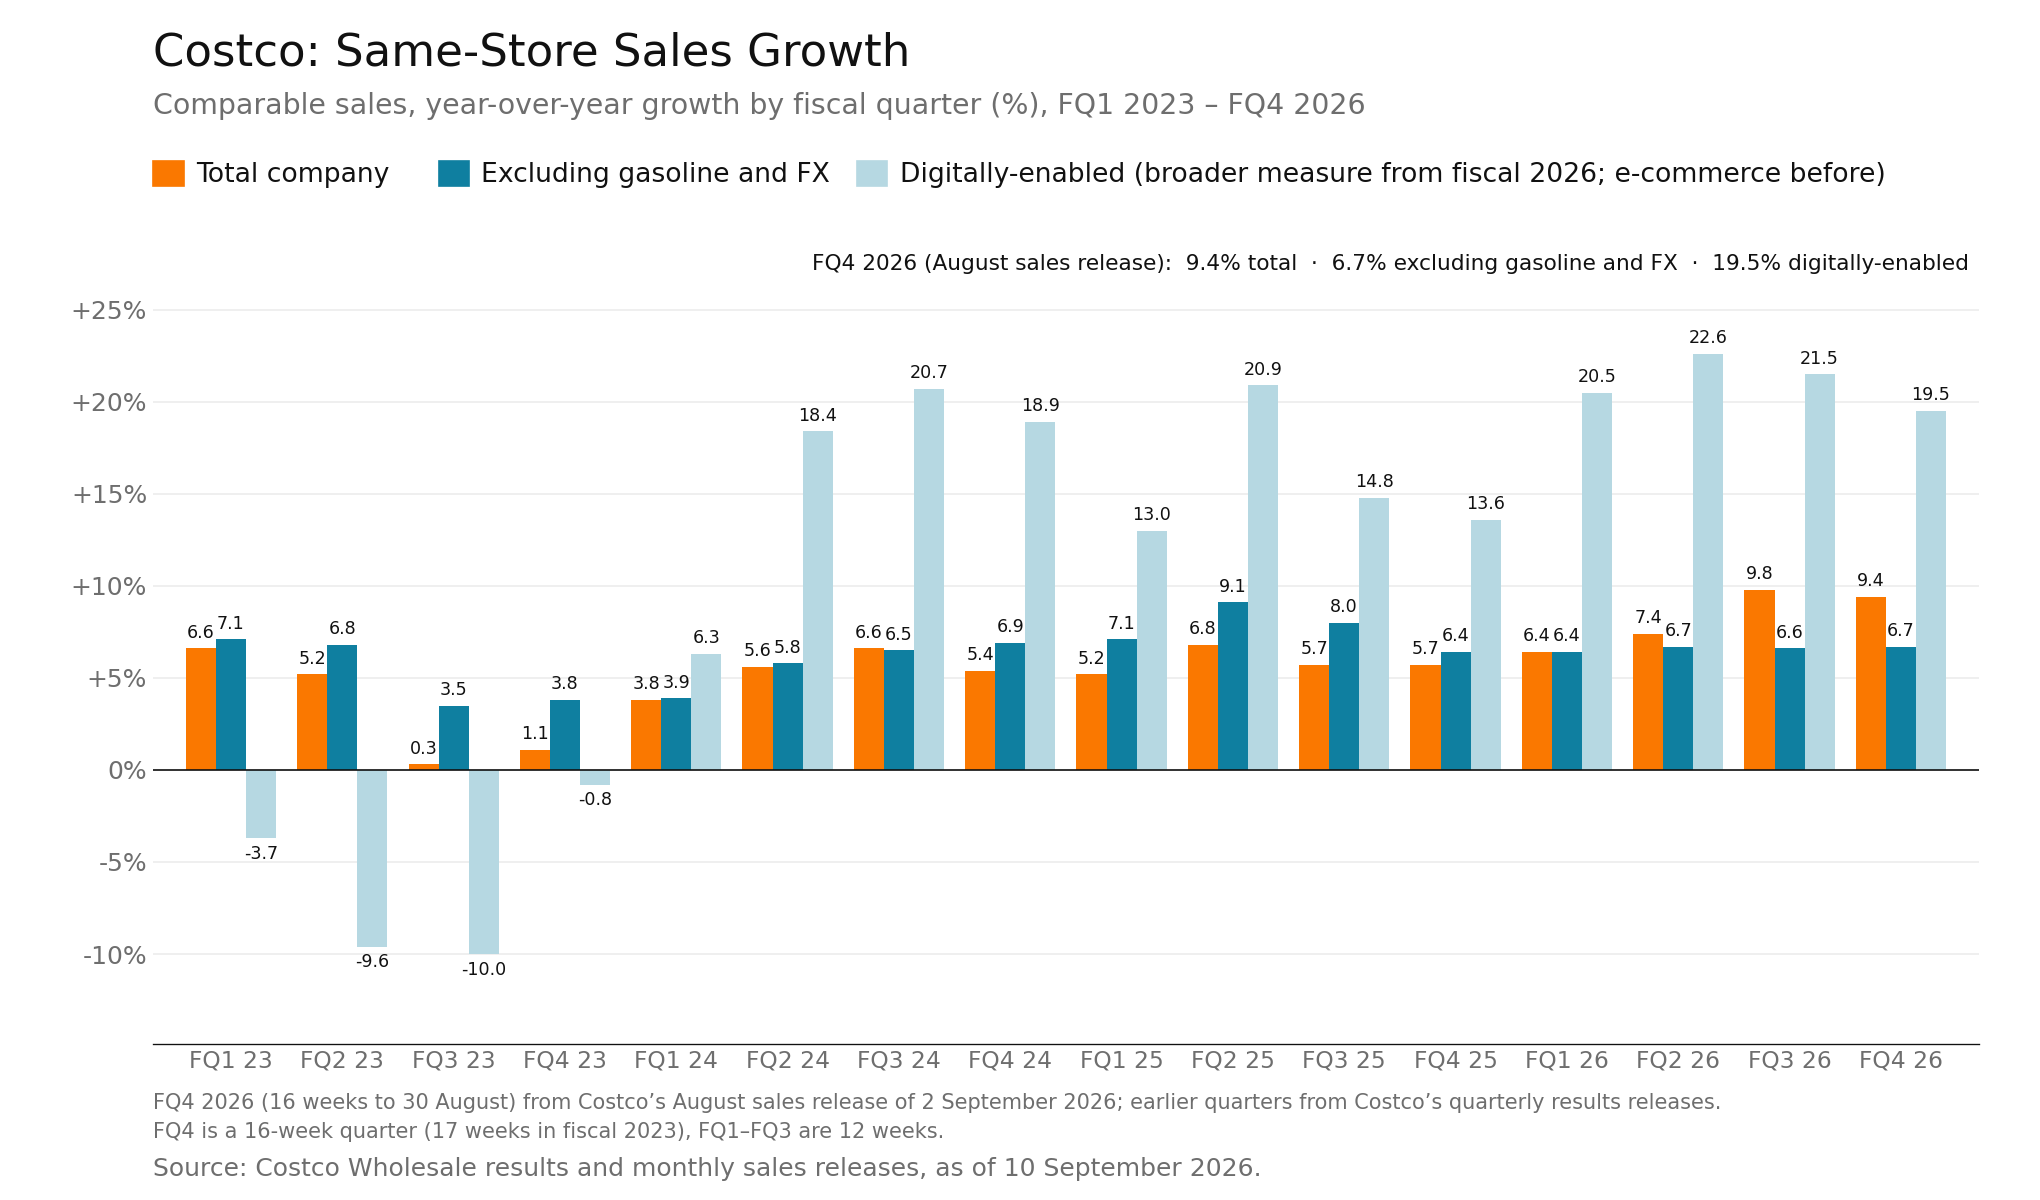
Costco publishes monthly comparable sales figures, which can provide an early indication of quarterly sales trends ahead of the full results. Its August 2026 sales release covered the fiscal fourth quarter of 2026. Digitally-enabled comparable sales grew 19.5%, the slowest quarterly rate in fiscal 2026. The historical series shown has ranged from approximately 13% to 23% since the fiscal second quarter of 2024. However, it combines earlier e-commerce figures with the broader digitally-enabled measure introduced in fiscal 2026.
(Past performance is not a reliable indicator of future results)
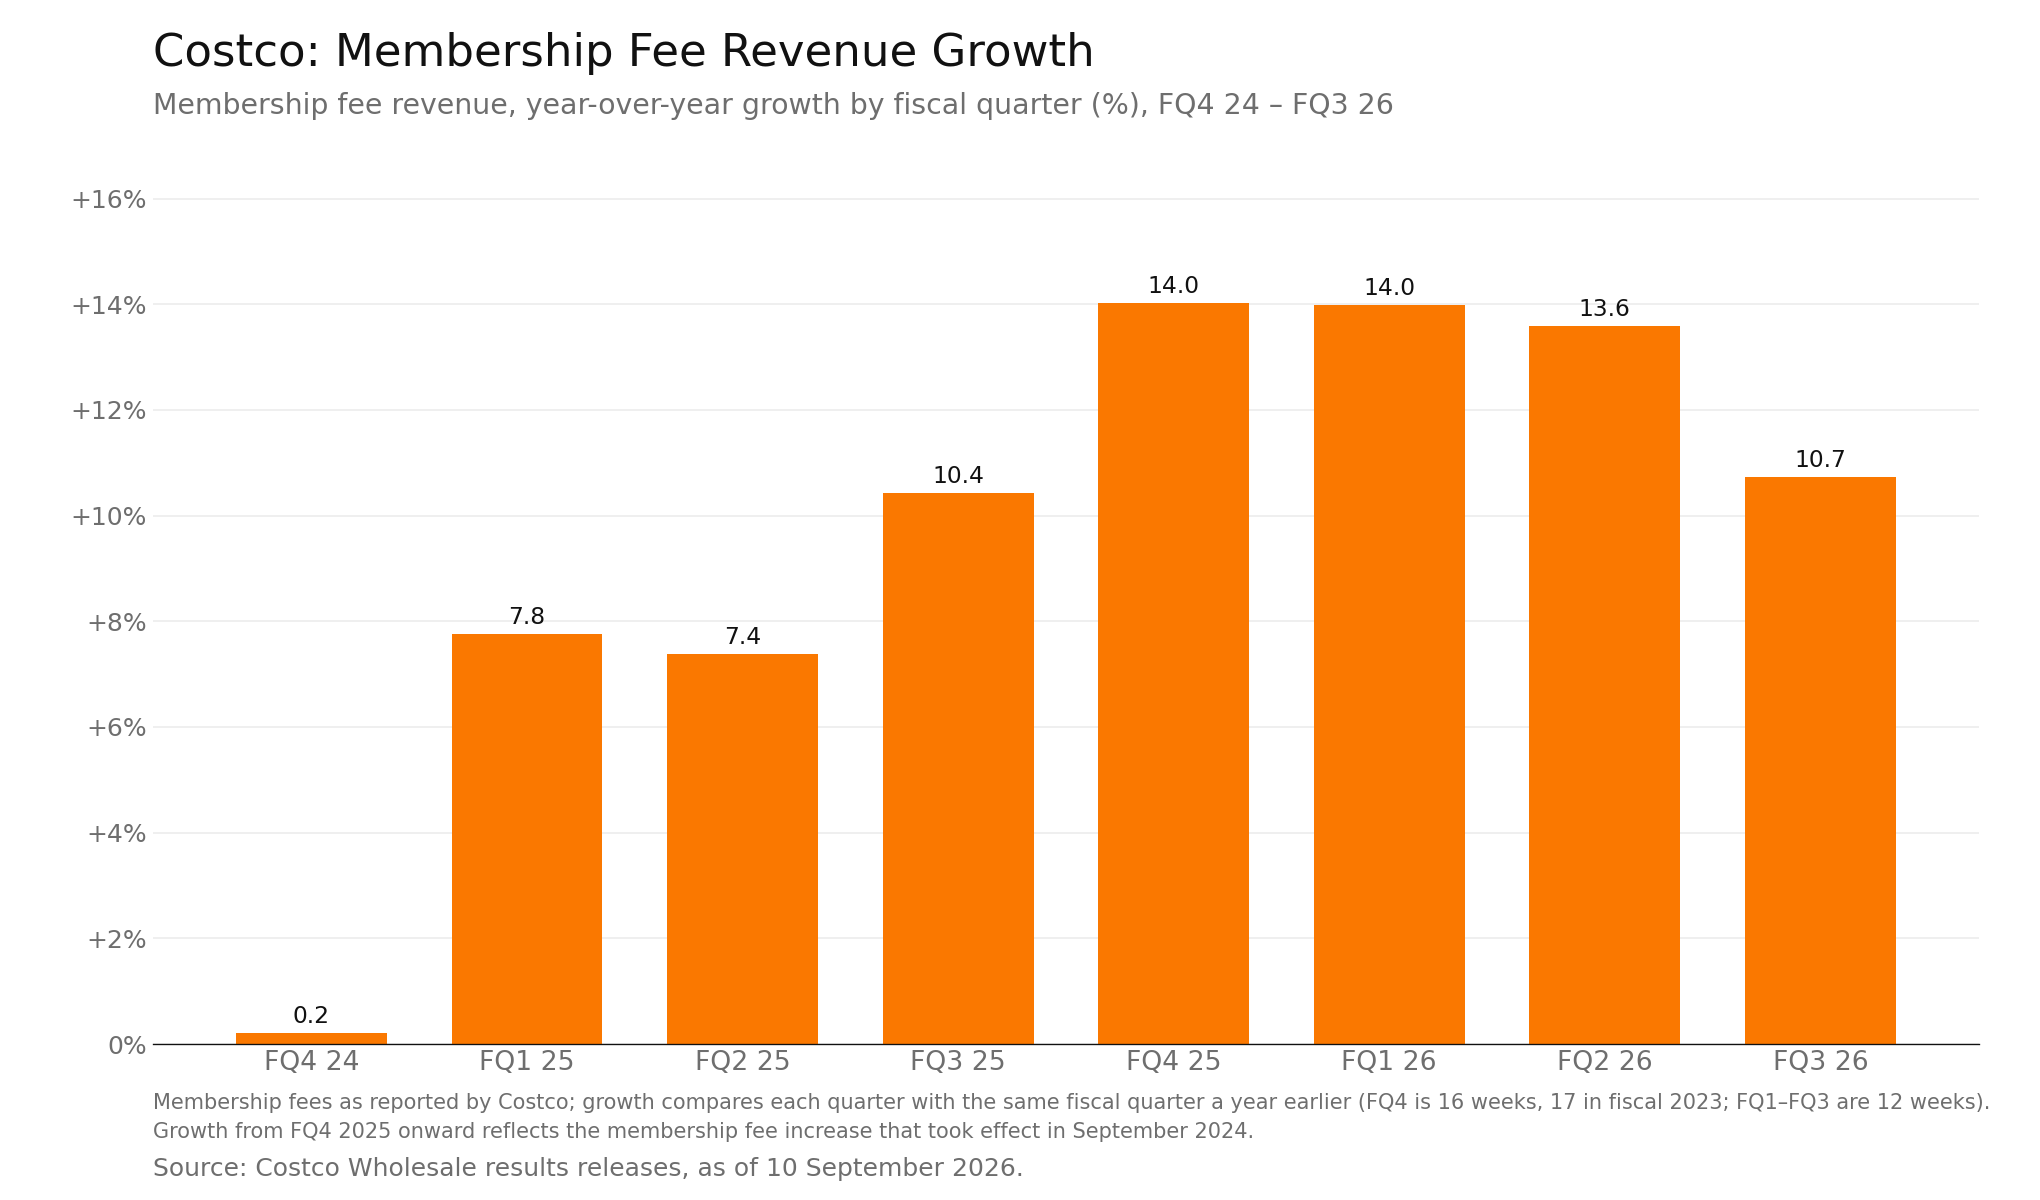
Membership fee revenue growth has been steady since the third fiscal quarter of 2025, remaining in the 10% to 14% range through the fiscal third quarter of 2026. Membership fee revenue is a small piece of total company revenue, representing about 2% of total revenue during the first three quarters of fiscal year 2026.
(Past performance is not a reliable indicator of future results)
Options Price Uncertainty
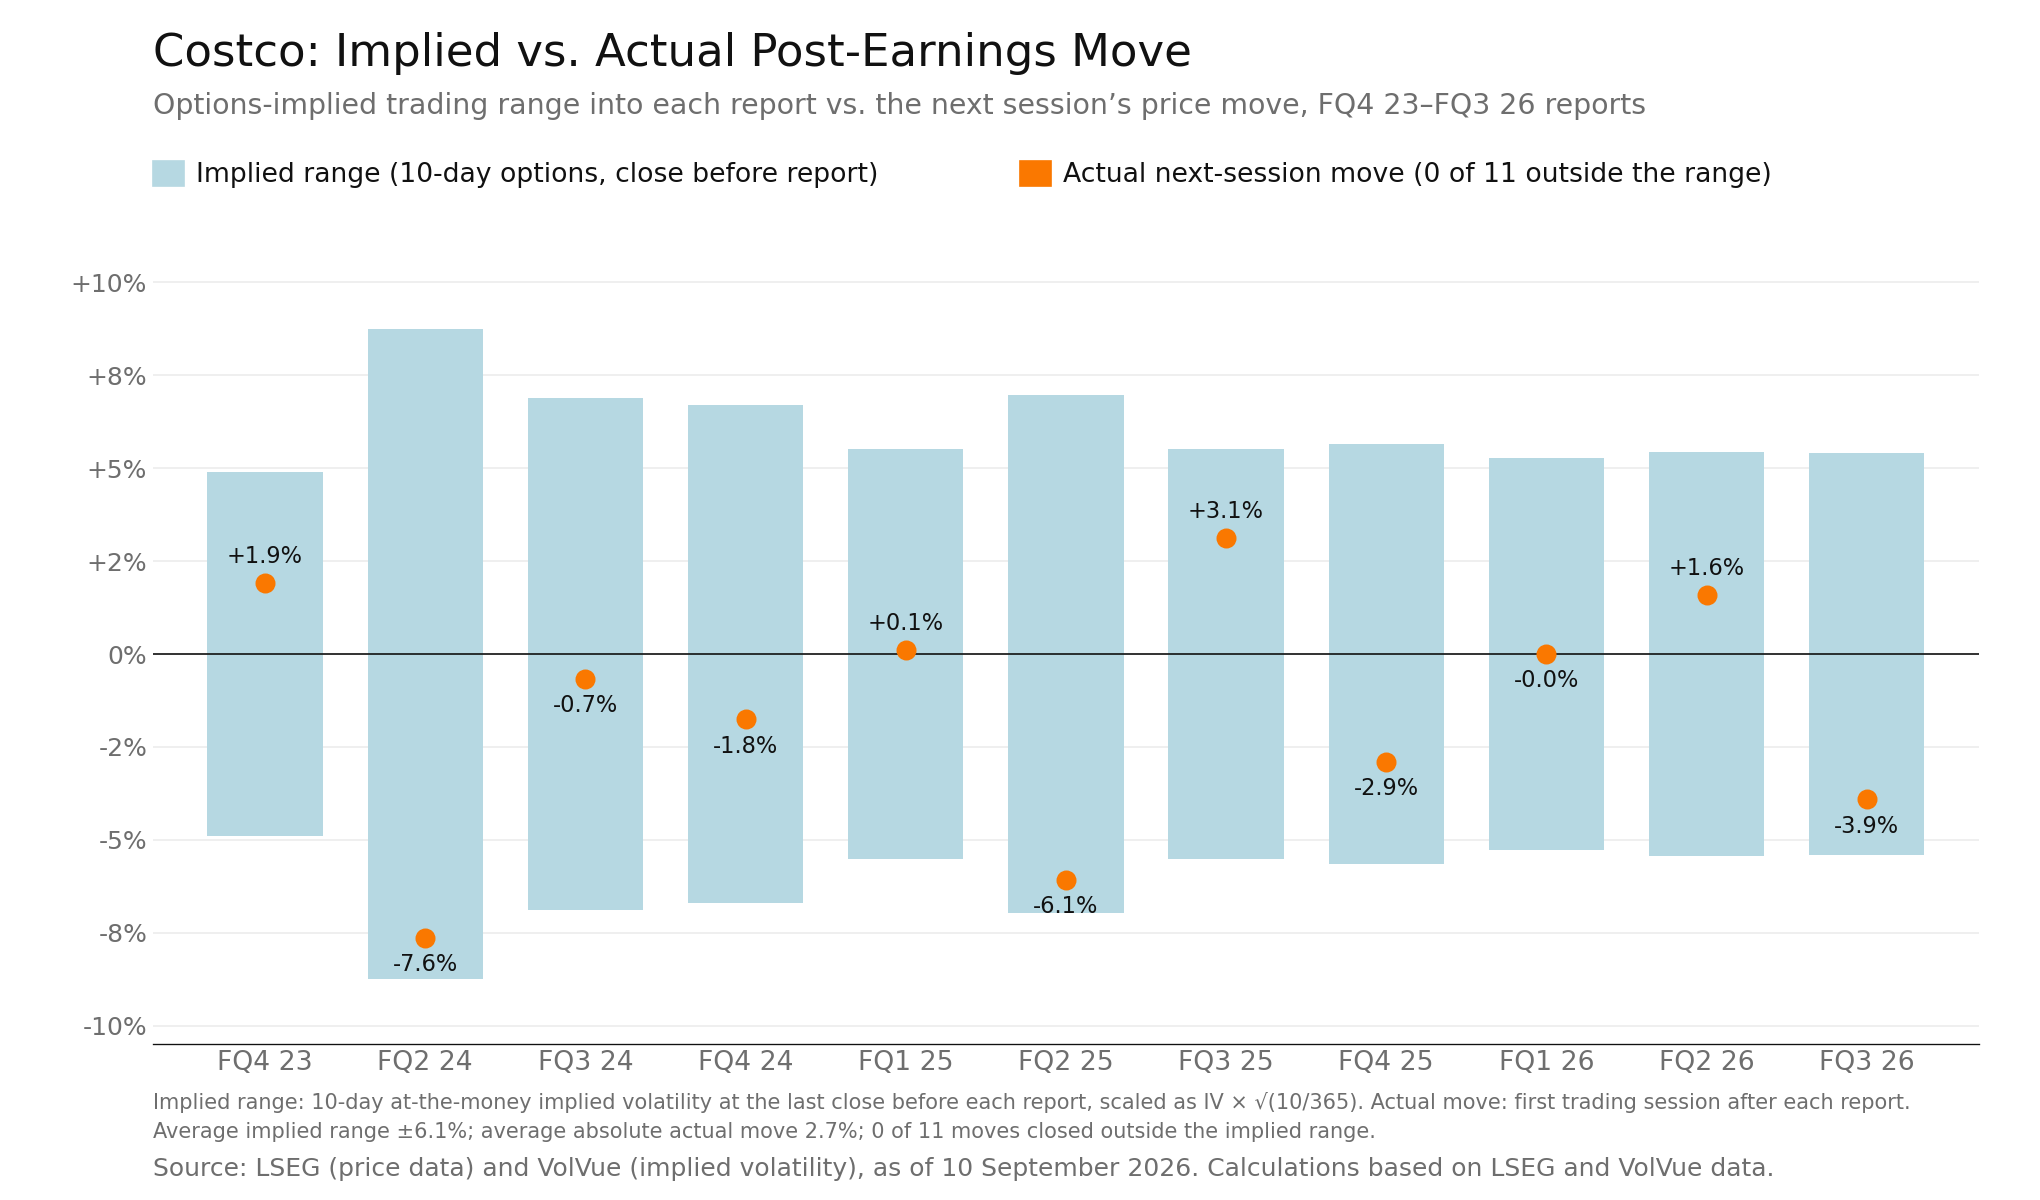
Option prices can be used to calculate an implied trading range around an earnings announcement. Across the 11 announcements shown, 10-day at-the-money implied volatility produced an average one-standard-deviation range of ±6.1%, while the average absolute realised next-session move was 2.7%. The next-session share-price move remained within the calculated range in eleven out of eleven cases.
The implied range was estimated using the 10-day at-the-money implied volatility observed at the last close before each report, scaled to the option’s 10-day term using implied volatility × √(10/365) and applied to the share price. This yields a one-standard-deviation range based on option prices. It does not represent a forecast or indicate the direction of the share-price move.
(Past performance is not a reliable indicator of future results)
Valuation Metrics
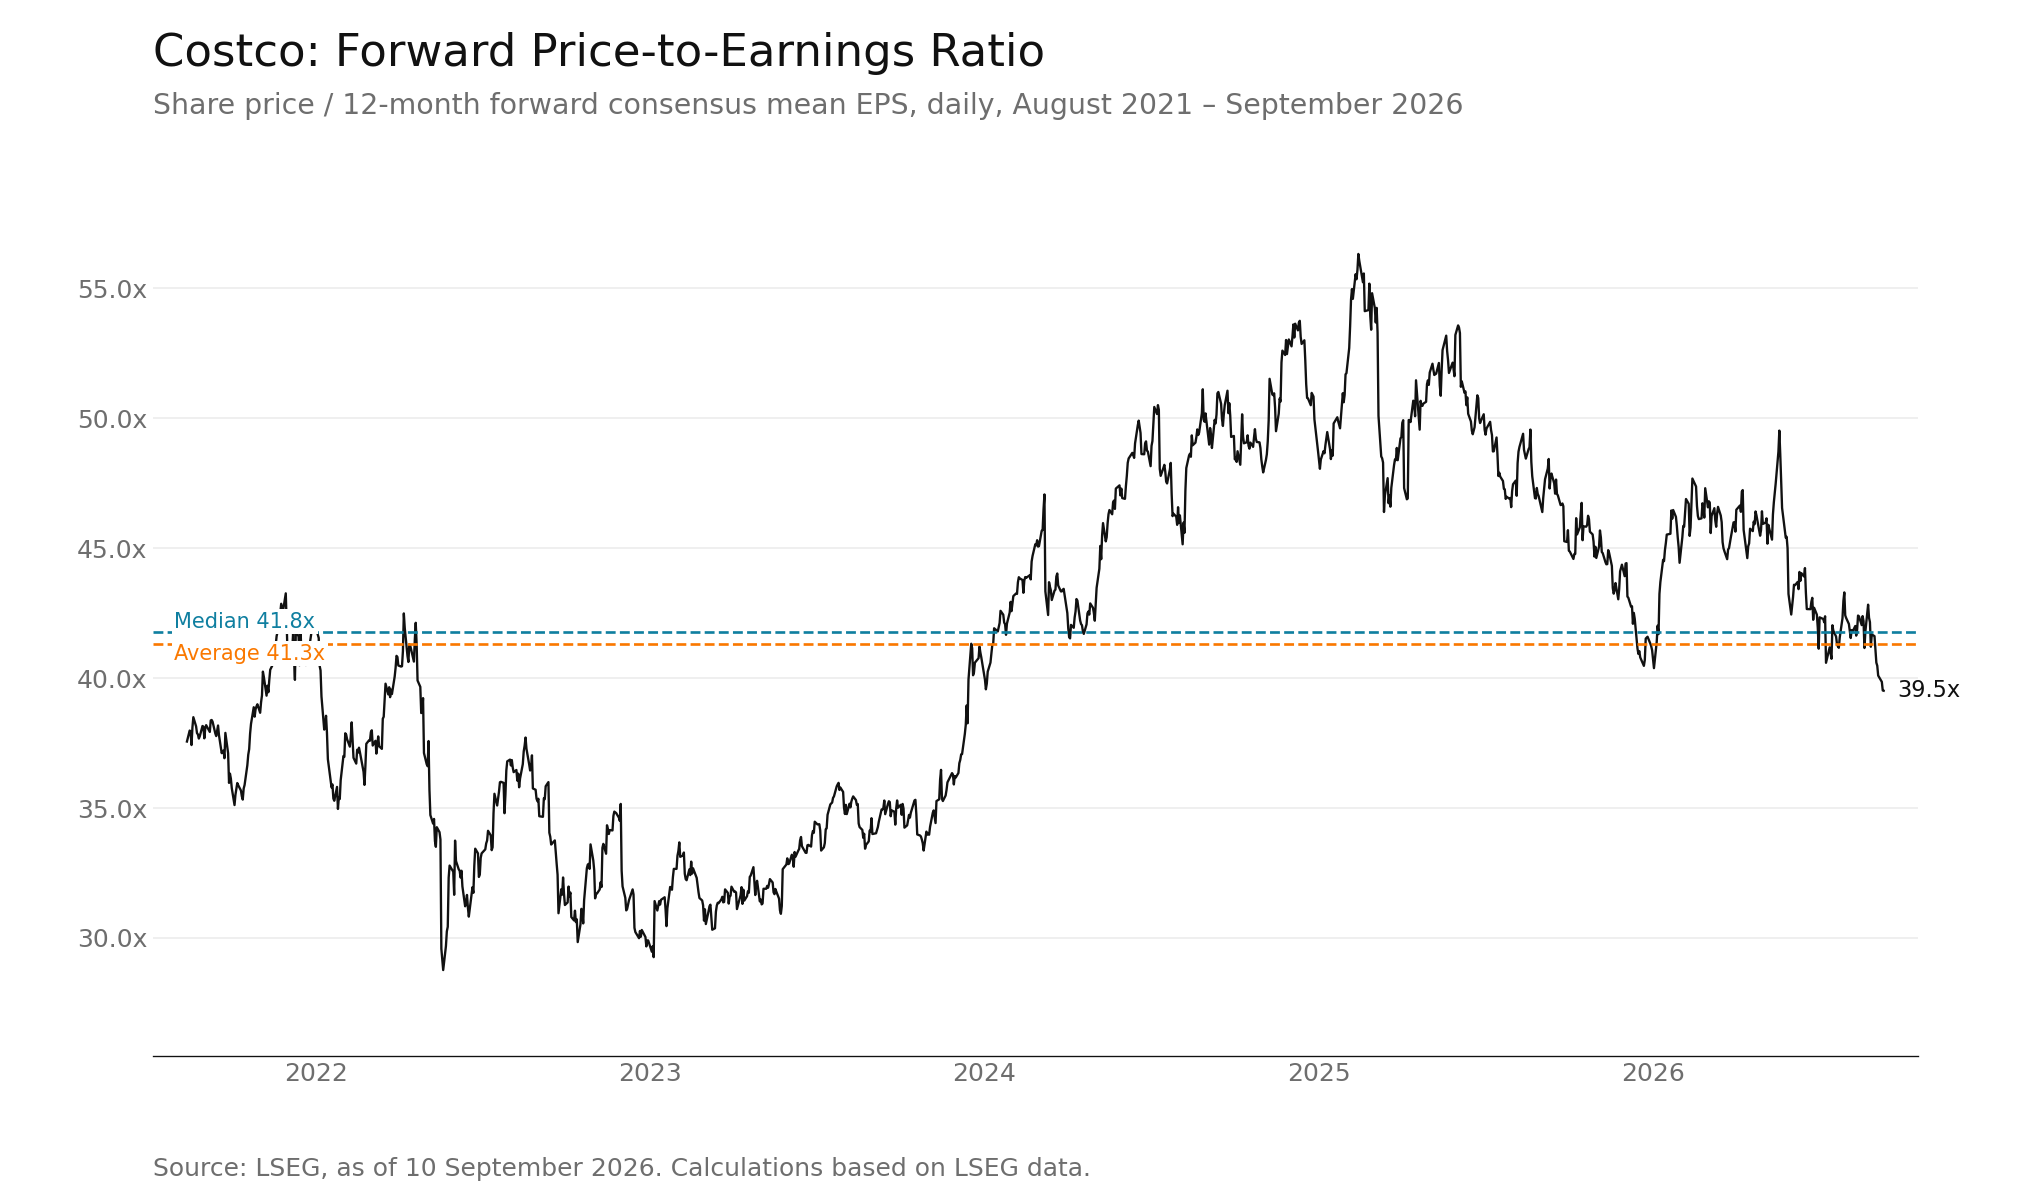
As of 10 September 2026, Costco’s forward price-to-earnings ratio, based on analysts’ estimates for the next twelve months, was 39.5. From August 2021 through September 2026, Costco's average P/E was 41.3, and its median was 41.8, placing that observation below both its historical average and median over the period.
Historical valuation multiples provide context for how the market has priced the company over time. No conclusion about whether the shares are overvalued or undervalued is drawn from these historical comparisons.
(Past performance is not a reliable indicator of future results)
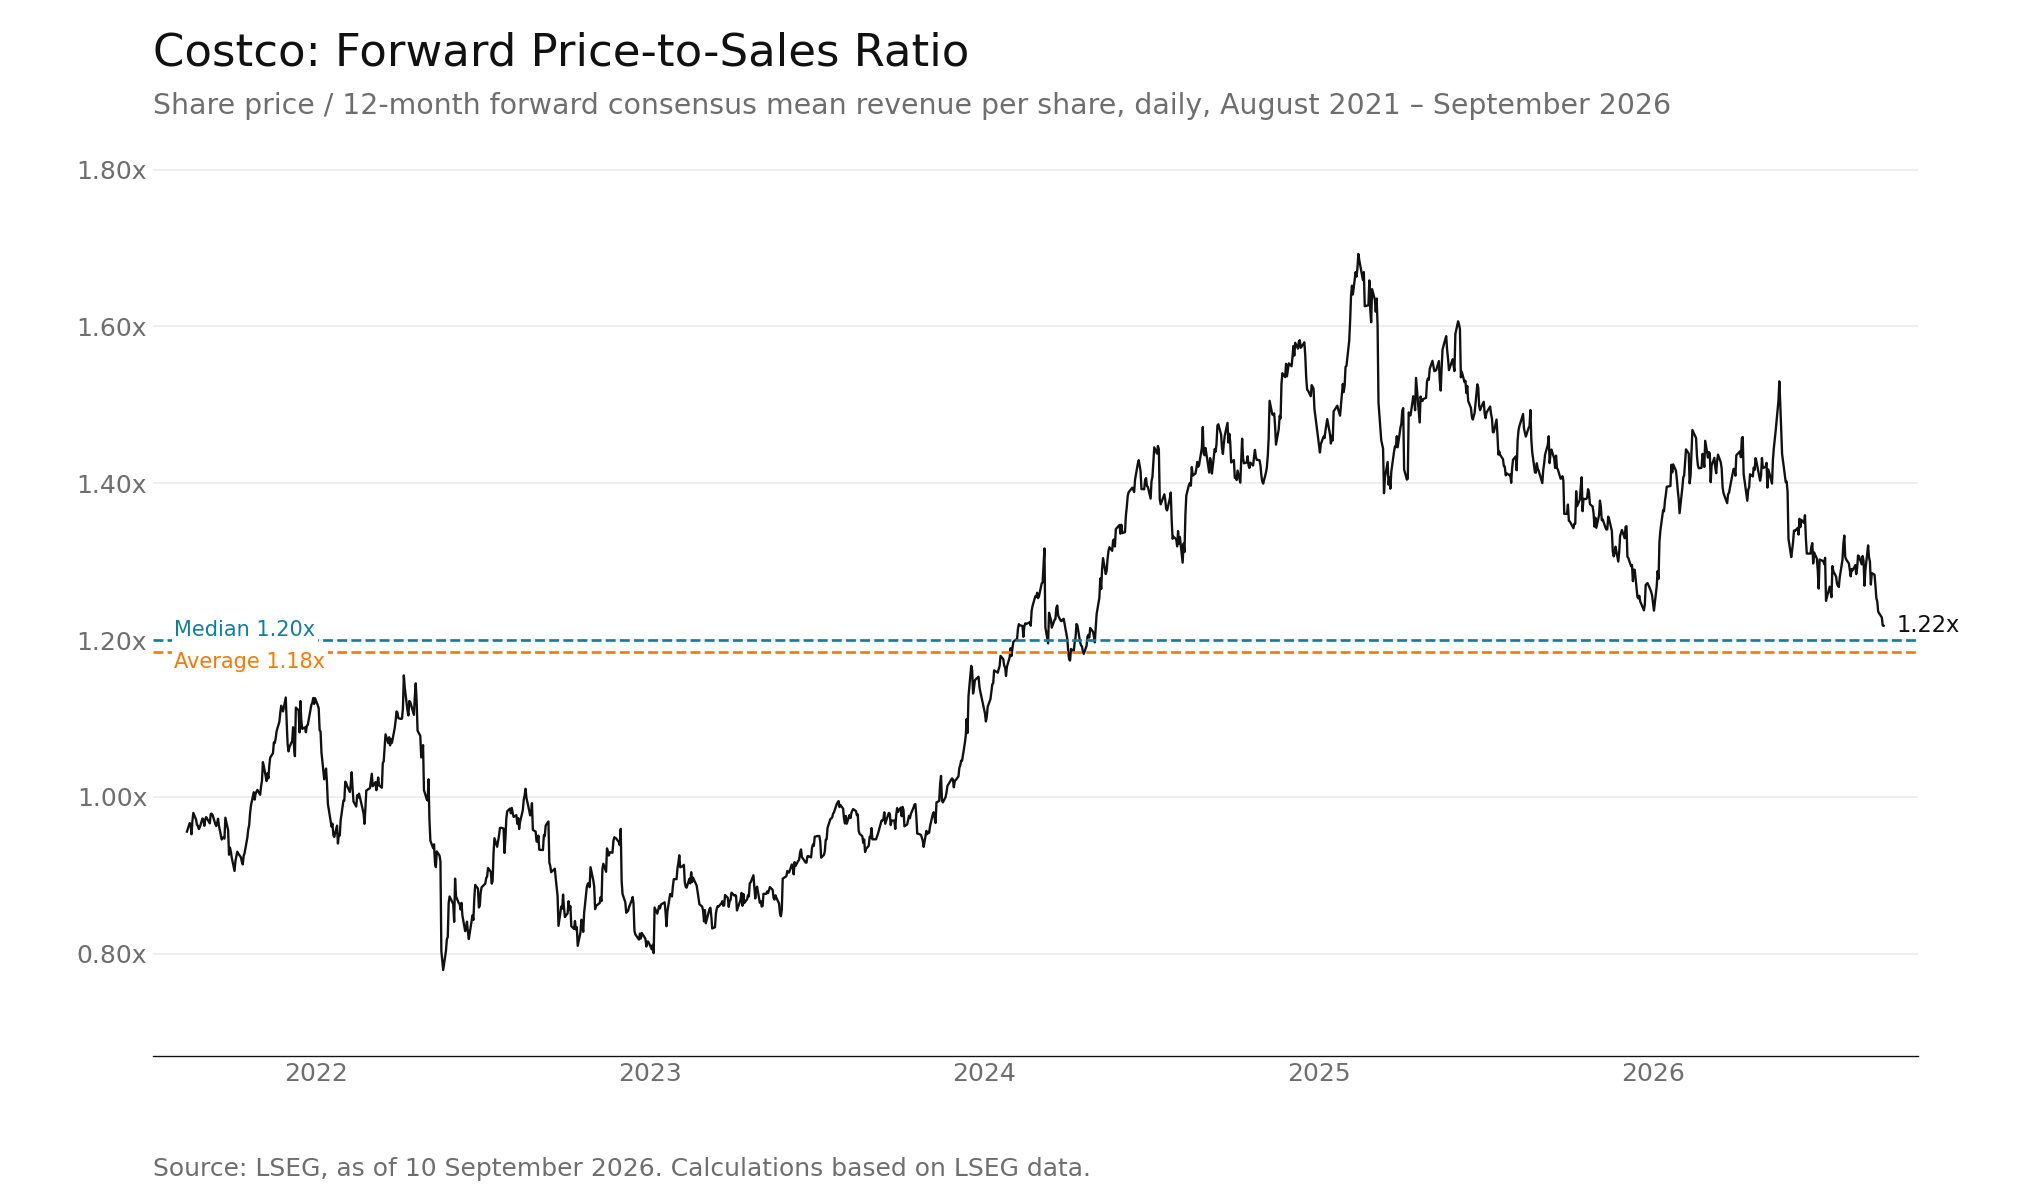
As of 10 September 2026, Costco’s forward price-to-sales ratio, based on analysts’ consensus next-twelve-month revenue estimates, was 1.22. From August 2021 through September 2026, its average P/S ratio was 1.18, and its median was 1.20, so the ratio is above both its historical average and median over the period shown.
(Past performance is not a reliable indicator of future results)
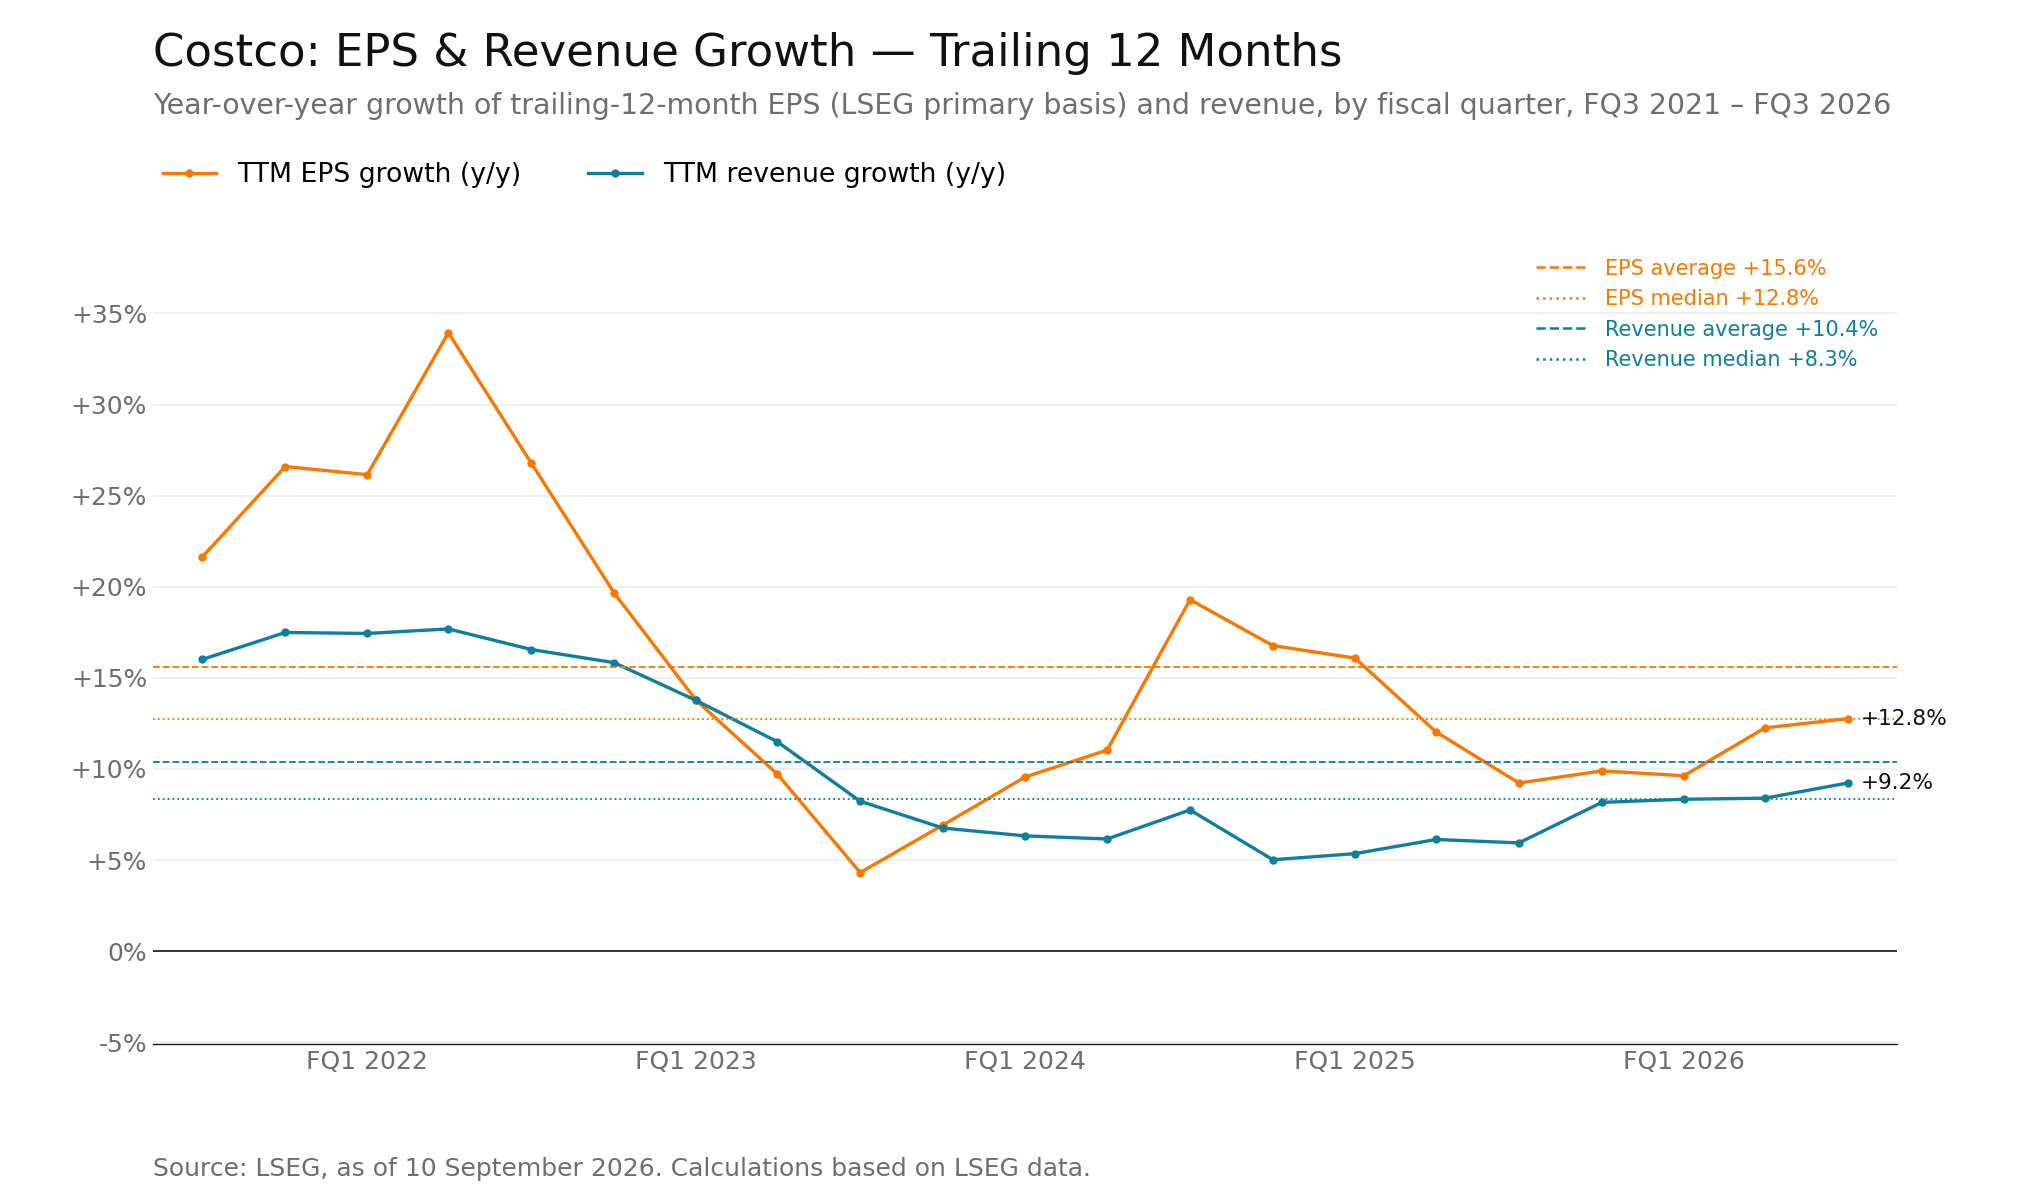
Over the period shown, Costco’s trailing-12-month EPS growth averaged 15.6% year over year, with a median of 12.8%. Revenue growth averaged 10.4%, with a median of 8.3%. In the fiscal third quarter of 2026, the corresponding observations were 12.8% for EPS growth and 9.2% for revenue growth.
(Past performance is not a reliable indicator of future results)
The charts present historical observations of Costco’s results relative to consensus estimates, digital and membership revenue growth, options-implied ranges, actual next-session moves, and valuation multiples. These measures describe past observations and do not forecast the outcome of any future earnings announcement.