

Amazon's USD 220bn bet: how record AI spending could reshape the company
Amazon plans about USD 220bn of capex in 2026. We look at AWS, profitability, debt, valuation and the key catalysts and risks for AMZN shares.
Amazon is in the middle of the largest investment programme in its history: capex of about USD 220bn in 2026, up from USD 132bn in 2025, with "meaningfully more" planned for 2027. The bet is already visible in AWS, which grew 39% in Q3, its fastest pace in nearly five years. It is also visible in trailing free cash flow of −USD 42.4bn and in the move from net cash to net debt. The question for investors is whether this spending turns into durable growth and margins, or into a longer period of weaker cash generation.
Amazon grew revenue 12% in Q3 2026 and posted its highest operating margin ever, 13.9%, with AWS up 39%. Even so, earnings per share missed expectations and trailing free cash flow fell to −USD 42.4bn as quarterly capex more than doubled. On 30 October the shares opened 4.6% lower and fell as much as 5.9% during the session, but recovered to close 1.4% down at USD 240.35. Since then, the shares have recovered: at the close on 4 November they stood at USD 266.03, 10.7% above the 30 October close.
Key data
| Ticker / exchangeAMZN · Nasdaq | SectorConsumer Cyclical | Market capUSD 2.88trn |
|---|---|---|
| Previous close (03/11)USD 250.69 | Close (04/11)USD 266.03 (+6.1%) | 52-week rangeUSD 196.00 – 287.20 |
| Dividend yieldNo dividend | Beta (5Y)1.50 | Next resultsFeb 2027 (TBC) |
Source: Yahoo Finance (close on 04/11/2026). Market cap based on 10,811m shares outstanding.
Past performance is not a reliable indicator of future results.
Overview
Amazon reports three segments. North America (USD 112.9bn in Q3 2026, 56% of revenue) and International (USD 43.1bn, 21%) cover the online and physical stores, third-party seller services, advertising and Prime subscriptions. AWS, the cloud business, brought in USD 46.0bn (23% of revenue) but generated USD 17.8bn of the USD 28.1bn group operating income, about 63%. Advertising (USD 19.6bn in the quarter) is the other high-margin engine. Looking ahead, the company is betting on AI: its Trainium chips, the Bedrock inference service and multi-gigawatt compute agreements with OpenAI and Anthropic, in which Amazon is also a major investor. Management says the AWS backlog has reached USD 578bn, according to GuruFocus's summary of the earnings call. Newer bets include Amazon Leo (satellite internet), Zoox (robotaxis), Pharmacy and Alexa+. To fund all this, Amazon expects capex of about USD 220bn in 2026 and "meaningfully more" in 2027.
Profitability
Revenue grew 12% year on year (13% excluding currency effects), held back by Prime Day moving into Q2; without the shift, growth would have been about 4 percentage points higher, according to the company. EBITDA rose 43% to USD 49.0bn and operating income rose 61% to USD 28.1bn, lifted by AWS (38.7% segment margin) and North America (7.7%). Net income fell 2% to USD 20.7bn because Q3 2025 had included USD 9.5bn of gains on Anthropic. Those same stakes inflated earnings in Q1 and Q2 2026. The weak point is cash: net capex reached USD 75.9bn in a single quarter, and free cash flow was −USD 33.5bn.
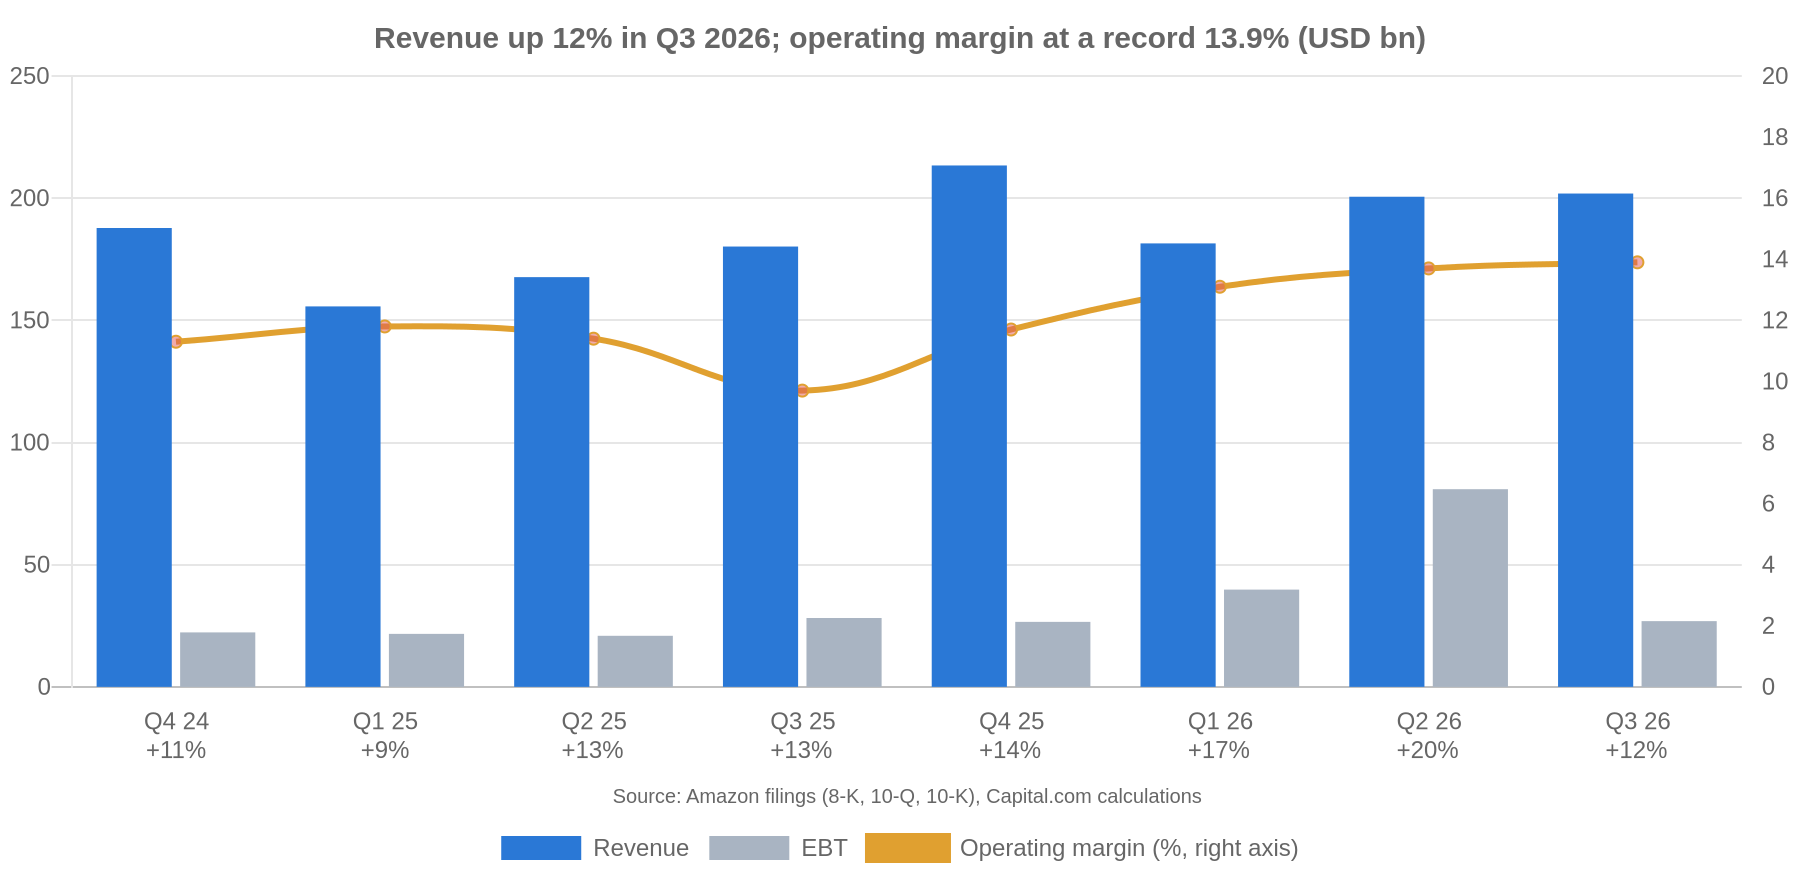
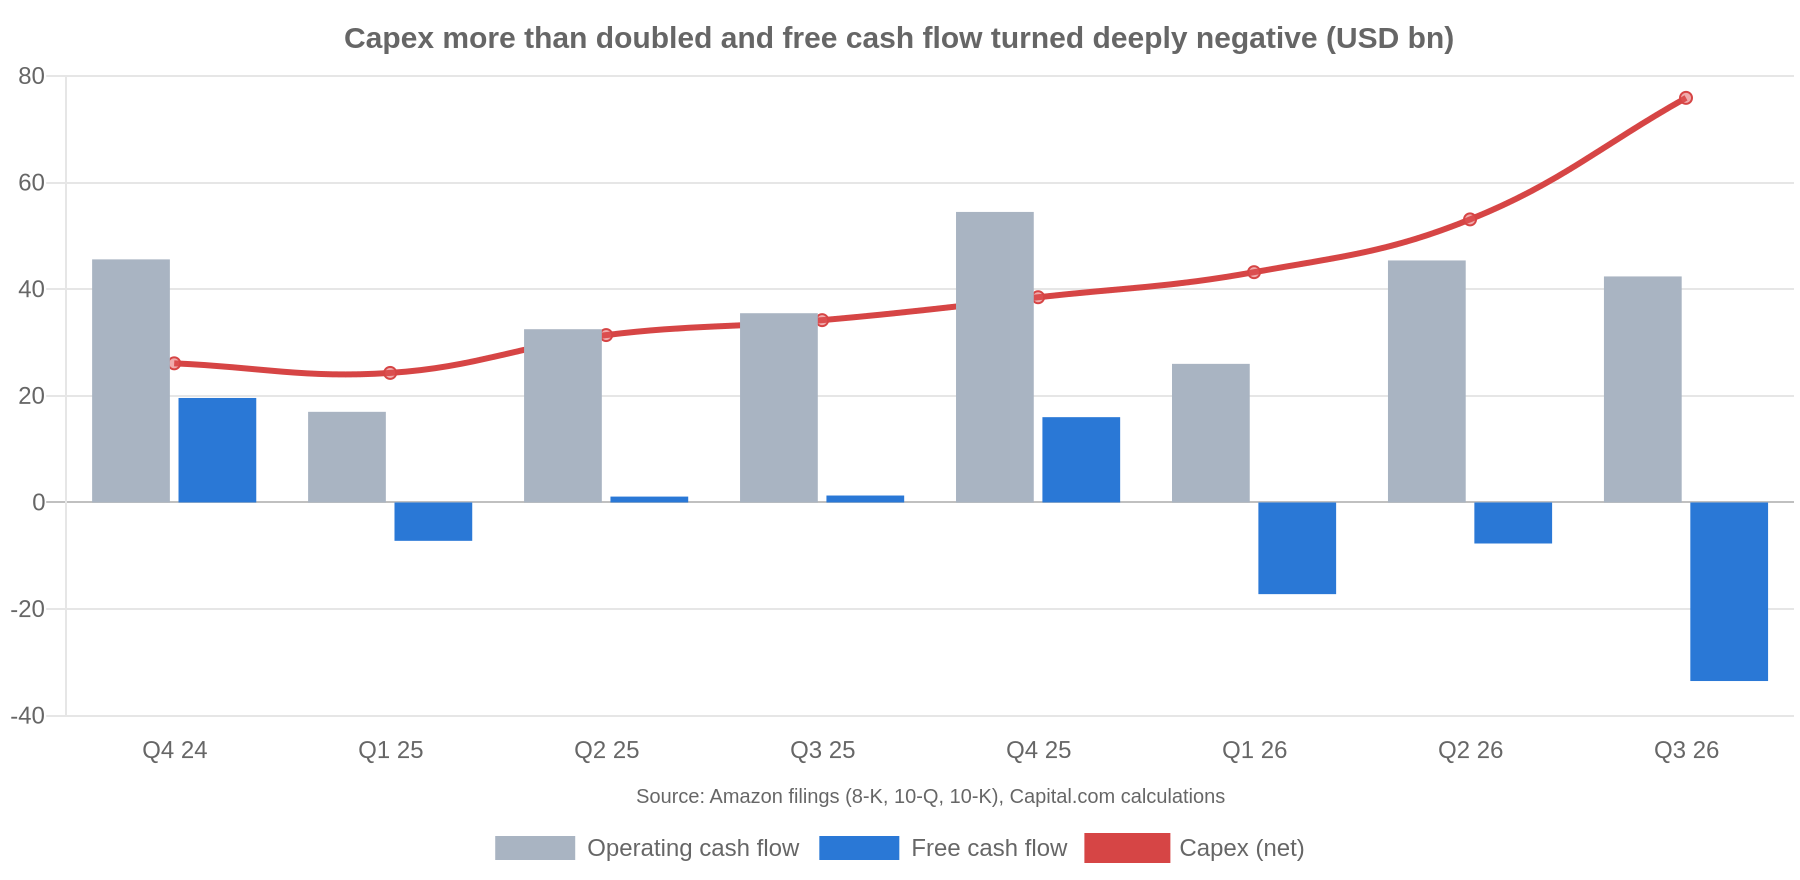
EBITDA = operating income + depreciation and amortisation (including capitalised content costs and operating lease assets). Capex (net) = purchases of property and equipment net of proceeds from sales and incentives; FCF = operating cash flow − capex (net), the company's definition. USD bn. Q1 and Q2 2026 EBT include gains on Anthropic investments.
Past performance is not a reliable indicator of future results.
Quarterly trend: Q/Q and Y/Y changes
| USD bn | Q3 24 | Q4 24 | Q1 25 | Q2 25 | Q3 25 | Q4 25 | Q1 26 | Q2 26 | Q3 26 |
|---|---|---|---|---|---|---|---|---|---|
| Revenue | 158.9 | 187.8 | 155.7 | 167.7 | 180.2 | 213.4 | 181.5 | 200.6 | 201.9 |
| % Q/Q | +7.4% | +18.2% | −17.1% | +7.7% | +7.4% | +18.4% | −14.9% | +10.5% | +0.7% |
| % Y/Y | +11.0% | +10.5% | +8.6% | +13.3% | +13.4% | +13.6% | +16.6% | +19.6% | +12.1% |
| EBT | 18.0 | 22.3 | 21.7 | 20.9 | 28.2 | 26.6 | 39.8 | 80.9 | 26.9 |
| % Q/Q | +18.3% | +23.9% | −3.0% | −3.8% | +35.1% | −5.6% | +49.7% | +103.0% | −66.8% |
| % Y/Y | +48.0% | +63.3% | +67.0% | +36.8% | +56.2% | +19.0% | +83.7% | +287.7% | −4.6% |
| Net income | 15.3 | 20.0 | 17.1 | 18.2 | 21.2 | 21.2 | 30.3 | 62.6 | 20.7 |
| % Q/Q | +13.7% | +30.5% | −14.4% | +6.1% | +16.6% | +0.0% | +42.8% | +107.1% | −67.0% |
| % Y/Y | +55.2% | +88.3% | +64.2% | +34.7% | +38.2% | +5.9% | +76.7% | +244.9% | −2.4% |
| Operating cash flow | 26.0 | 45.6 | 17.0 | 32.5 | 35.5 | 54.5 | 26.0 | 45.4 | 42.4 |
| % Q/Q | +2.7% | +75.7% | −62.7% | +91.1% | +9.3% | +53.3% | −52.2% | +74.4% | −6.5% |
| % Y/Y | +22.4% | +7.5% | −10.4% | +28.6% | +36.8% | +19.3% | +53.0% | +39.6% | +19.4% |
| Capex (net) | 21.3 | 26.1 | 24.3 | 31.4 | 34.2 | 38.5 | 43.2 | 53.1 | 75.9 |
| % Q/Q | +29.8% | +22.4% | −6.9% | +29.3% | +9.1% | +12.4% | +12.4% | +22.8% | +43.0% |
| % Y/Y | +88.3% | +95.1% | +74.1% | +91.3% | +60.9% | +47.7% | +78.2% | +69.2% | +121.7% |
| Free cash flow | 4.7 | 19.6 | −7.2 | 1.1 | 1.3 | 16.0 | −17.2 | −7.7 | −33.5 |
| % Q/Q | −47.2% | +317.3% | n.s. | n.s. | +13.1% | +1132.8% | n.s. | n.s. | n.s. |
| % Y/Y | −52.7% | −32.7% | n.s. | −87.1% | −72.4% | −18.4% | n.s. | n.s. | n.s. |
| Gross margin | 49.0% | 47.3% | 50.6% | 51.8% | 50.8% | 48.5% | 51.8% | 52.3% | 53.2% |
| Operating margin | 11.0% | 11.3% | 11.8% | 11.4% | 9.7% | 11.7% | 13.1% | 13.7% | 13.9% |
Source: Amazon filings (8-K, 10-Q, 10-K), Capital.com calculations. USD bn. Q/Q = change versus the previous quarter; Y/Y = change versus the same quarter a year earlier. n.s. = not meaningful (negative value). Amazon's revenue is seasonal (Q4 holiday quarter), so Y/Y changes are the better guide. Q1–Q2 2026 EBT and net income include gains on Anthropic investments; Q3 2025 operating income includes a USD 2.5bn charge for the FTC settlement over Prime.
Past performance is not a reliable indicator of future results.
Results vs consensus and guidance
Revenue and earnings per share both came in slightly below expectations, but AWS beat estimates. Advertising and the Q4 revenue guidance were weaker than the market had hoped.
| RevenueUSD 201.9bnMiss · est. 202.3bn (−0.2%) | GAAP EPSUSD 1.89Miss · est. 1.96 (−3.6%) | AWS revenueUSD 46.0bnBeat · est. 45.3bn (+1.5%) |
|---|---|---|
| Advertising revenueUSD 19.6bnMiss · est. 20.8bn (−5.7%) | Q4 revenue guidanceUSD 240–247bnMidpoint below est. 244.3bn | Capex≈USD 220bn in 2026"Meaningfully more" in 2027 |
Source: Amazon Q3 2026 earnings release; Yahoo Finance (revenue, EPS and Q4 consensus estimates); StreetAccount, via CNBC (AWS) and Variety (advertising); GuruFocus earnings call summary (2027 capex). Q4 operating income guidance: USD 28.5–33.5bn, versus USD 25.0bn in Q4 2025.
Past performance is not a reliable indicator of future results.
Solvency
Amazon has moved from net cash of USD 57.4bn at the end of 2025 to net debt of USD 58.9bn in September 2026, as long-term debt almost tripled from USD 65.6bn to USD 173.1bn. Leverage is still low relative to earnings (0.32x TTM EBITDA), but interest cover has fallen from 37x to 17x.
| Quarter end | LT debt | Cash + securities | Net debt | Equity | Net debt/TTM EBITDA | EBIT/interest | Current ratio |
|---|---|---|---|---|---|---|---|
| Sep 2026 | 173.1 | 114.2 | 58.9 | 613.6 | 0.32x | 17x | 0.99 |
| Jun 2026 | 128.9 | 123.0 | 5.9 | 551.6 | 0.03x | 21x | 1.03 |
| Mar 2026 | 119.1 | 143.1 | −24.0 | 441.9 | −0.15x | 30x | 1.18 |
| Dec 2025 | 65.6 | 123.0 | −57.4 | 411.1 | −0.39x | 37x | 1.05 |
| Sep 2025 | 50.7 | 94.2 | −43.5 | 369.6 | −0.31x | 32x | 1.01 |
| Jun 2025 | 50.7 | 93.2 | −42.5 | 333.8 | −0.32x | 37x | 1.02 |
| Mar 2025 | 53.4 | 94.6 | −41.2 | 305.9 | −0.32x | 34x | 1.05 |
| Dec 2024 | 52.6 | 101.2 | −48.6 | 286.0 | −0.40x | 37x | 1.06 |
| Year end | LT debt | Cash + securities | Net debt | Equity | Net debt/EBITDA | Current ratio |
|---|---|---|---|---|---|---|
| 2025 | 65.6 | 123.0 | −57.4 | 411.1 | −0.39x | 1.05 |
| 2024 | 52.6 | 101.2 | −48.6 | 286.0 | −0.40x | 1.06 |
| 2023 | 58.3 | 86.8 | −28.5 | 201.9 | −0.33x | 1.05 |
| 2022 | 67.2 | 70.0 | −2.9 | 146.0 | −0.05x | 0.94 |
Source: Amazon balance sheets (10-K, 10-Q and 8-K releases), Capital.com calculations. USD bn. LT debt = long-term debt, excluding the current portion (USD 6.8bn in September 2026) and lease liabilities (USD 98.8bn of long-term lease liabilities in September 2026). Cash + securities = cash and equivalents plus marketable securities. EBIT/interest = quarterly operating income divided by interest expense.
Past performance is not a reliable indicator of future results.
What happened. In 2026 Amazon became one of the largest corporate borrowers in the world to pay for its AI build-out. It drew USD 115.1bn of new long-term debt in nine months, according to its cash flow statement. That included USD 37bn of bonds in March and USD 25bn in July, plus issues in euros (€14.5bn), Swiss francs (CHF2.8bn), Canadian dollars (C$14bn) and sterling (£4.25bn in September), and a USD 17.5bn three-year term loan agreed with banks in June. In the same period it spent USD 63.8bn on acquisitions and non-marketable investments, mainly OpenAI preferred stock (a USD 50bn total commitment, fully funded after June) and Anthropic. Amazon does not buy back shares, so the debt is going into capex and these stakes.
Read the investment figures with care. At 30 September 2026 Amazon's stakes in Anthropic and OpenAI were carried at about USD 290bn: USD 146.2bn of Anthropic convertible notes at fair value, plus USD 143.7bn of preferred stock in the two companies, according to the Q3 10-Q. These are Level 3 valuations of unlisted companies, so they can swing sharply. Revaluations of the preferred stock go through the income statement (USD 50.5bn of upward adjustments in Q2 alone), while gains on the notes go to other comprehensive income (USD 36bn after tax in Q3). Amazon has also agreed to make up to USD 20bn of financing available to Anthropic, linked to compute delivery milestones.
Litigation. In September 2025 Amazon agreed a USD 2.5bn settlement with the US Federal Trade Commission (FTC) over Prime sign-ups and cancellations. The FTC's separate monopolisation case is due to go to trial on 29 March 2027, after a judge refused in October 2026 to postpone it, according to MLex. Related cases brought by California and the District of Columbia are also pending.
Maturities and rating. The debt is long-dated and mostly fixed-rate: the weighted-average remaining life of the notes was 13.9 years at 30 September 2026, and maturities run from 2027 to 2076. The current portion was USD 6.8bn and the USD 30bn commercial paper programme was unused. Amazon is rated A1 by Moody's, AA by S&P and AA− by Fitch, according to Investing.com coverage of the July bond sale.
Shareholder returns
Amazon does not pay a dividend and has not bought back shares since 2022. Shareholders' return depends entirely on share-price growth.
| USD bn | 2022 | 2023 | 2024 | 2025 | 9M 2026 |
|---|---|---|---|---|---|
| Share buybacks | 6.0 | 0.0 | 0.0 | 0.0 | 0.0 |
| Dividends paid | 0.0 | 0.0 | 0.0 | 0.0 | 0.0 |
| Stock-based compensation | 19.6 | 24.0 | 22.0 | 19.5 | 15.5 |
Source: Amazon cash flow statements (10-K, 10-Q, 8-K), Capital.com calculations.
Past performance is not a reliable indicator of future results.
Shares outstanding rose from 10,731m (December 2025) to 10,811m (September 2026), 0.7% dilution in nine months, or 1.2% year on year. Stock-based compensation over the last 12 months was USD 19.9bn, about 2.5% of revenue. Common shares plus stock-based awards outstanding totalled 11,034m.
Relative valuation and competition
Amazon's trailing P/E of 21.5x is inflated by gains on its Anthropic stake. Excluding those gains, the multiple rises to about 34x, while the 24.9x forward P/E sits in the middle of its peers.
| Company | TTM P/E | Forward P/E | Est. revenue growth, next year |
|---|---|---|---|
| Amazon (AMZN) | 21.5x (≈34x ex investment gains) | 24.9x (2027) | +14.6% (2027) |
| Walmart (WMT) | 46.8x | 40.0x (FY to Jan 2028) | +4.4% (FY2028) |
| Microsoft (MSFT) | 29.0x | 27.8x (FY to Jun 2027) | +19.3% (FY2027) |
| Alphabet (GOOGL) | 15.1x | 19.3x (2027) | +27.0% (2027) |
| Meta (META) | 21.5x | 18.6x (2027) | +21.6% (2027) |
Source: Yahoo Finance (closing prices on 04/11/2026, average consensus estimates as of 05/11/2026), Capital.com calculations. Amazon TTM EPS of USD 12.37 (company). The ex-gains P/E taxes TTM operating income (USD 104.4bn) at 20%. Alphabet's P/E is also inflated by gains on equity stakes.
Past performance is not a reliable indicator of future results.
Other Amazon multiples: TTM EV/EBITDA is about 16x and price-to-sales is 3.6x. P/FCF and PEG are not meaningful at the moment. The first reflects negative free cash flow. The second reflects the expected drop in 2027 EPS (USD 10.67) versus a 2026 inflated by investment gains (USD 12.81).
Competition.
- Cloud: AWS remains the market leader, but Google Cloud has been growing faster (+103% in Q3 2026, according to Alphabet); in Q3 2026 AWS accelerated to 39%, its fastest growth in nearly five years.
- Chips: Trainium competes with Nvidia GPUs and Google's TPUs for AI training and inference workloads.
- Retail: Walmart is gaining in e-commerce and delivery speed, while Temu and Shein compete on price.
- Advertising: Amazon is the third-largest digital ad platform, behind Google and Meta.
Analyst consensus. The average price target is USD 326.74, in a range of USD 230 to USD 405, according to data compiled by Yahoo Finance (05/11/2026). After the results, the 2026 EPS estimate fell from USD 12.91 to USD 12.81, while the 2027 estimate rose from USD 10.57 to USD 10.67, compared with the week before the results. On 30/10, UBS analyst Stephen Ju raised his target from USD 348 to USD 352, citing AWS growth prospects and its USD 578bn backlog, according to Stock World. These targets reflect the views of third-party analysts, not Capital.com.
Catalysts and risks
The next big test is the Q4 2026 results in early February, when the company is expected to put a number on 2027 capex.
Catalysts
- The size of 2027 capex, and any sign that the investment cycle is peaking.
- Conversion of the USD 578bn AWS backlog and management's target of more than 40% AWS growth in both 2027 and 2028.
- Trainium adoption: OpenAI's commitment of about 2GW of capacity, ramping from 2027, and Anthropic's of up to 5GW.
- A possible IPO or other liquidity event at Anthropic or OpenAI, which could crystallise the value of Amazon's stakes.
- Advertising re-accelerating to high-teens growth in Q4, as the company expects.
Risks
- Prolonged negative free cash flow and further borrowing.
- Concentration on two AI labs that are both large AWS customers and companies Amazon has invested in.
- Earnings and balance-sheet volatility from Level 3 valuations of the Anthropic and OpenAI stakes.
- Regulation: the FTC monopolisation trial from March 2027 and related state cases.
- Consumer spending, tariffs and memory-chip costs, which the company lists among the factors that could affect its guidance.
- Currency: International accounts for about 21% of revenue.
Technical analysis
Amazon shares continue to show a medium- to long-term uptrend, marked by the rising trendline (blue line) that joins the May 2023 lows and the February–March 2026 lows and now stands near USD 222. Since May, however, the shares have moved sideways in a range between around USD 230 and USD 280, bounded by the June and July lows and the May and August highs, which include the all-time high of USD 287.20. In the days after the results, the shares reacted strongly at the technical support area around USD 230, formed by those lows: on 4 November they closed at USD 266.03, above the 50-day and 200-day moving averages (200-day SMA, red line). Above, the technical resistance area lies between around USD 280 and USD 287.20, formed by the May and August highs, which include the all-time high. 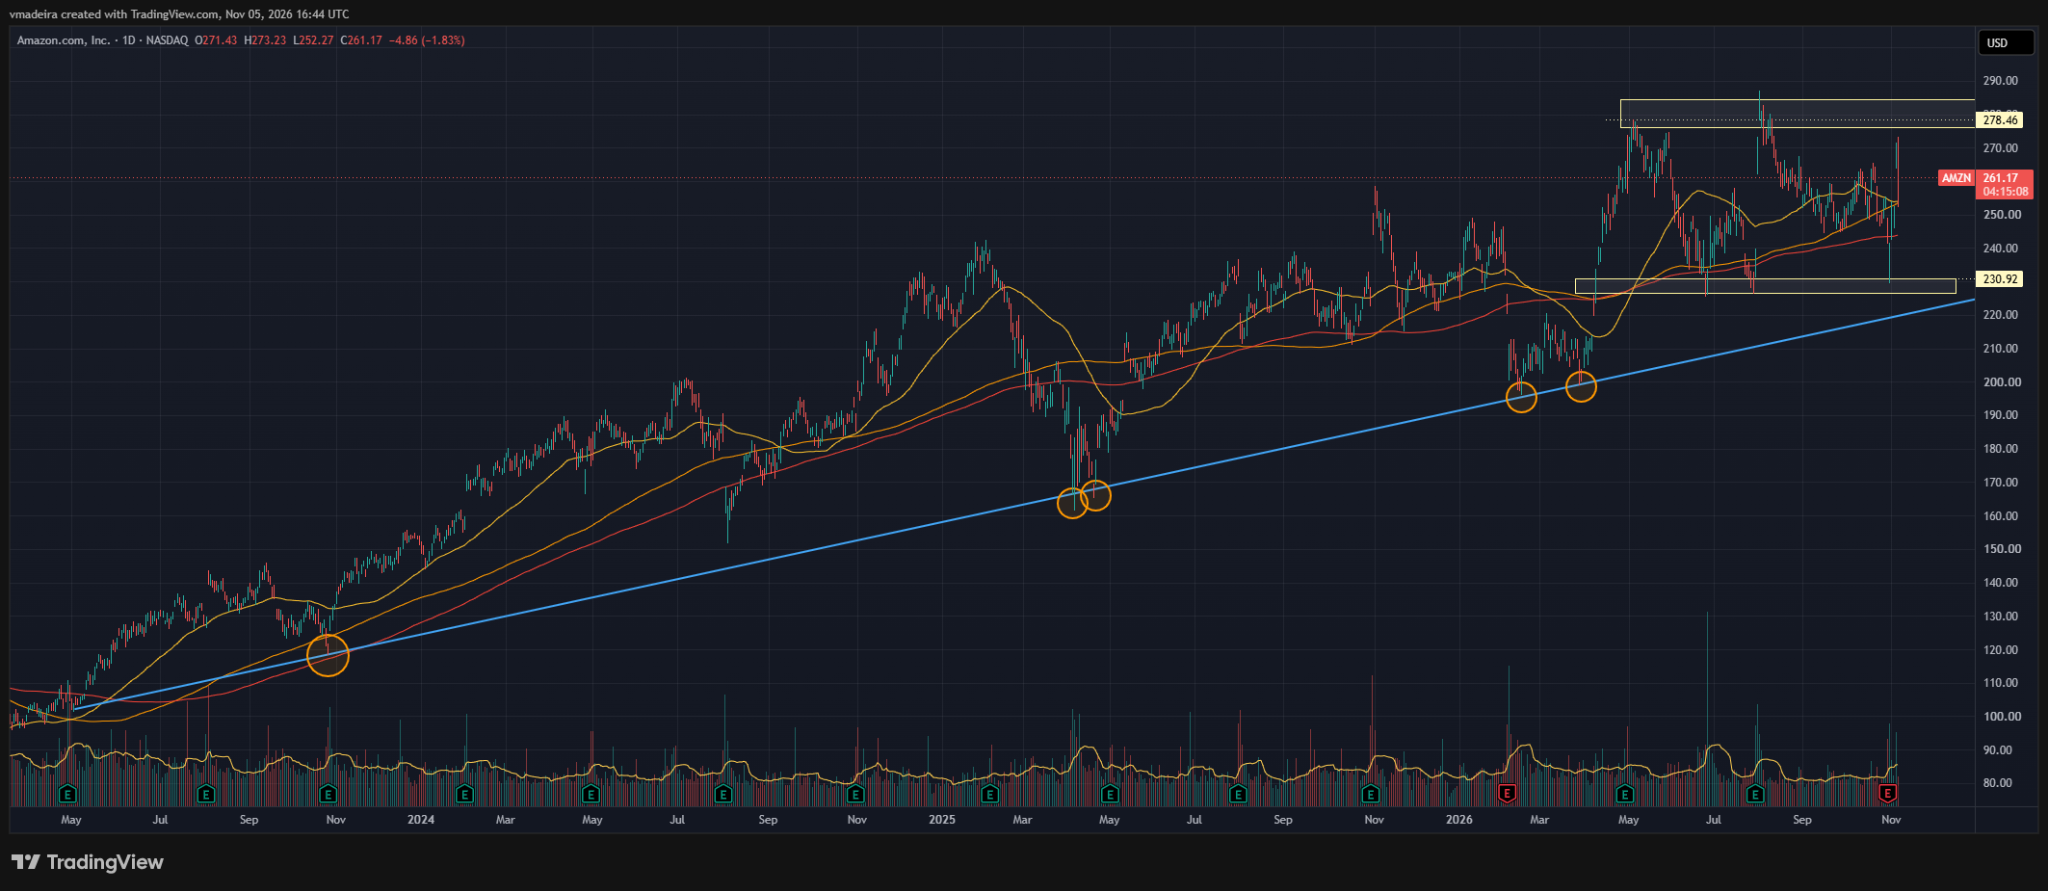
Source: TradingView (Capital.com), daily chart, AMZN
Past performance is not a reliable indicator of future results.
Reference data: 52-week range USD 196.00–287.20; close on 30/10 USD 240.35 (−1.4% on the day), after an intraday low of USD 229.36; close on 04/11 USD 266.03 (+6.1% on the day), with a session high of USD 271.49; 50-day and 200-day simple moving averages at USD 253.89 and USD 243.67 (TradingView, Capital.com). One-year return to 04/11: AMZN +6.7%, S&P 500 +13.5% (Yahoo Finance).
Summary
Amazon's operating business is at its most profitable ever, but the market is now weighing what the AI build-out costs in cash and debt.
Strengths
- AWS growth accelerating to 39%, with a USD 578bn backlog.
- Record operating margin of 13.9% and EBITDA up 43%.
- Large stakes in Anthropic and OpenAI and strong credit ratings (A1/AA/AA−).
Factors to watch
- Trailing free cash flow of −USD 42.4bn and even higher capex in 2027.
- The move from net cash to net debt, with long-term debt almost tripling in 2026.
- Accounting earnings distorted by investment gains: the 21.5x P/E hides a multiple of about 34x on operating earnings.
- Slower advertising growth and the FTC antitrust trial.