Day trading: understanding previous day’s high (PDH) and low (PDL)
The previous day’s high (PDH) and previous day’s low (PDL) are simple yet valuable reference points that show where notable buying or selling activity occurred. By observing these levels, traders can gain a clearer understanding of market structure and short-term sentiment as the new trading day begins.
Day trading focuses on identifying opportunities within a single session while avoiding overnight exposure. On this page, we’ll explore a key concept every day trader should understand: the previous day’s high (PDH) and previous day’s low (PDL). These levels act as useful reference points for assessing intraday structure and sentiment.
How to use PDH and PDL
The PDH and PDL mark the highest and lowest prices reached during the prior trading session. While simple, these levels matter because they highlight areas where price previously met strong buying or selling pressure. As many traders monitor them, they can attract increased activity or short-term reactions when revisited.
Here’s why PDH and PDL are often among the most relevant reference points for day traders.
Gauging strength or weakness
PDH and PDL help traders gauge short-term market tone.
During the early hours of trading, if price stays above the PDH, it may suggest continued buying interest, while failure to hold above the PDL can signal weaker sentiment or selling pressure.
Being aware of this can help traders interpret intraday bias more objectively.
For example:
Sustained trading above PDH may indicate that buyers remain in control (EUR/USD 5-minute chart).
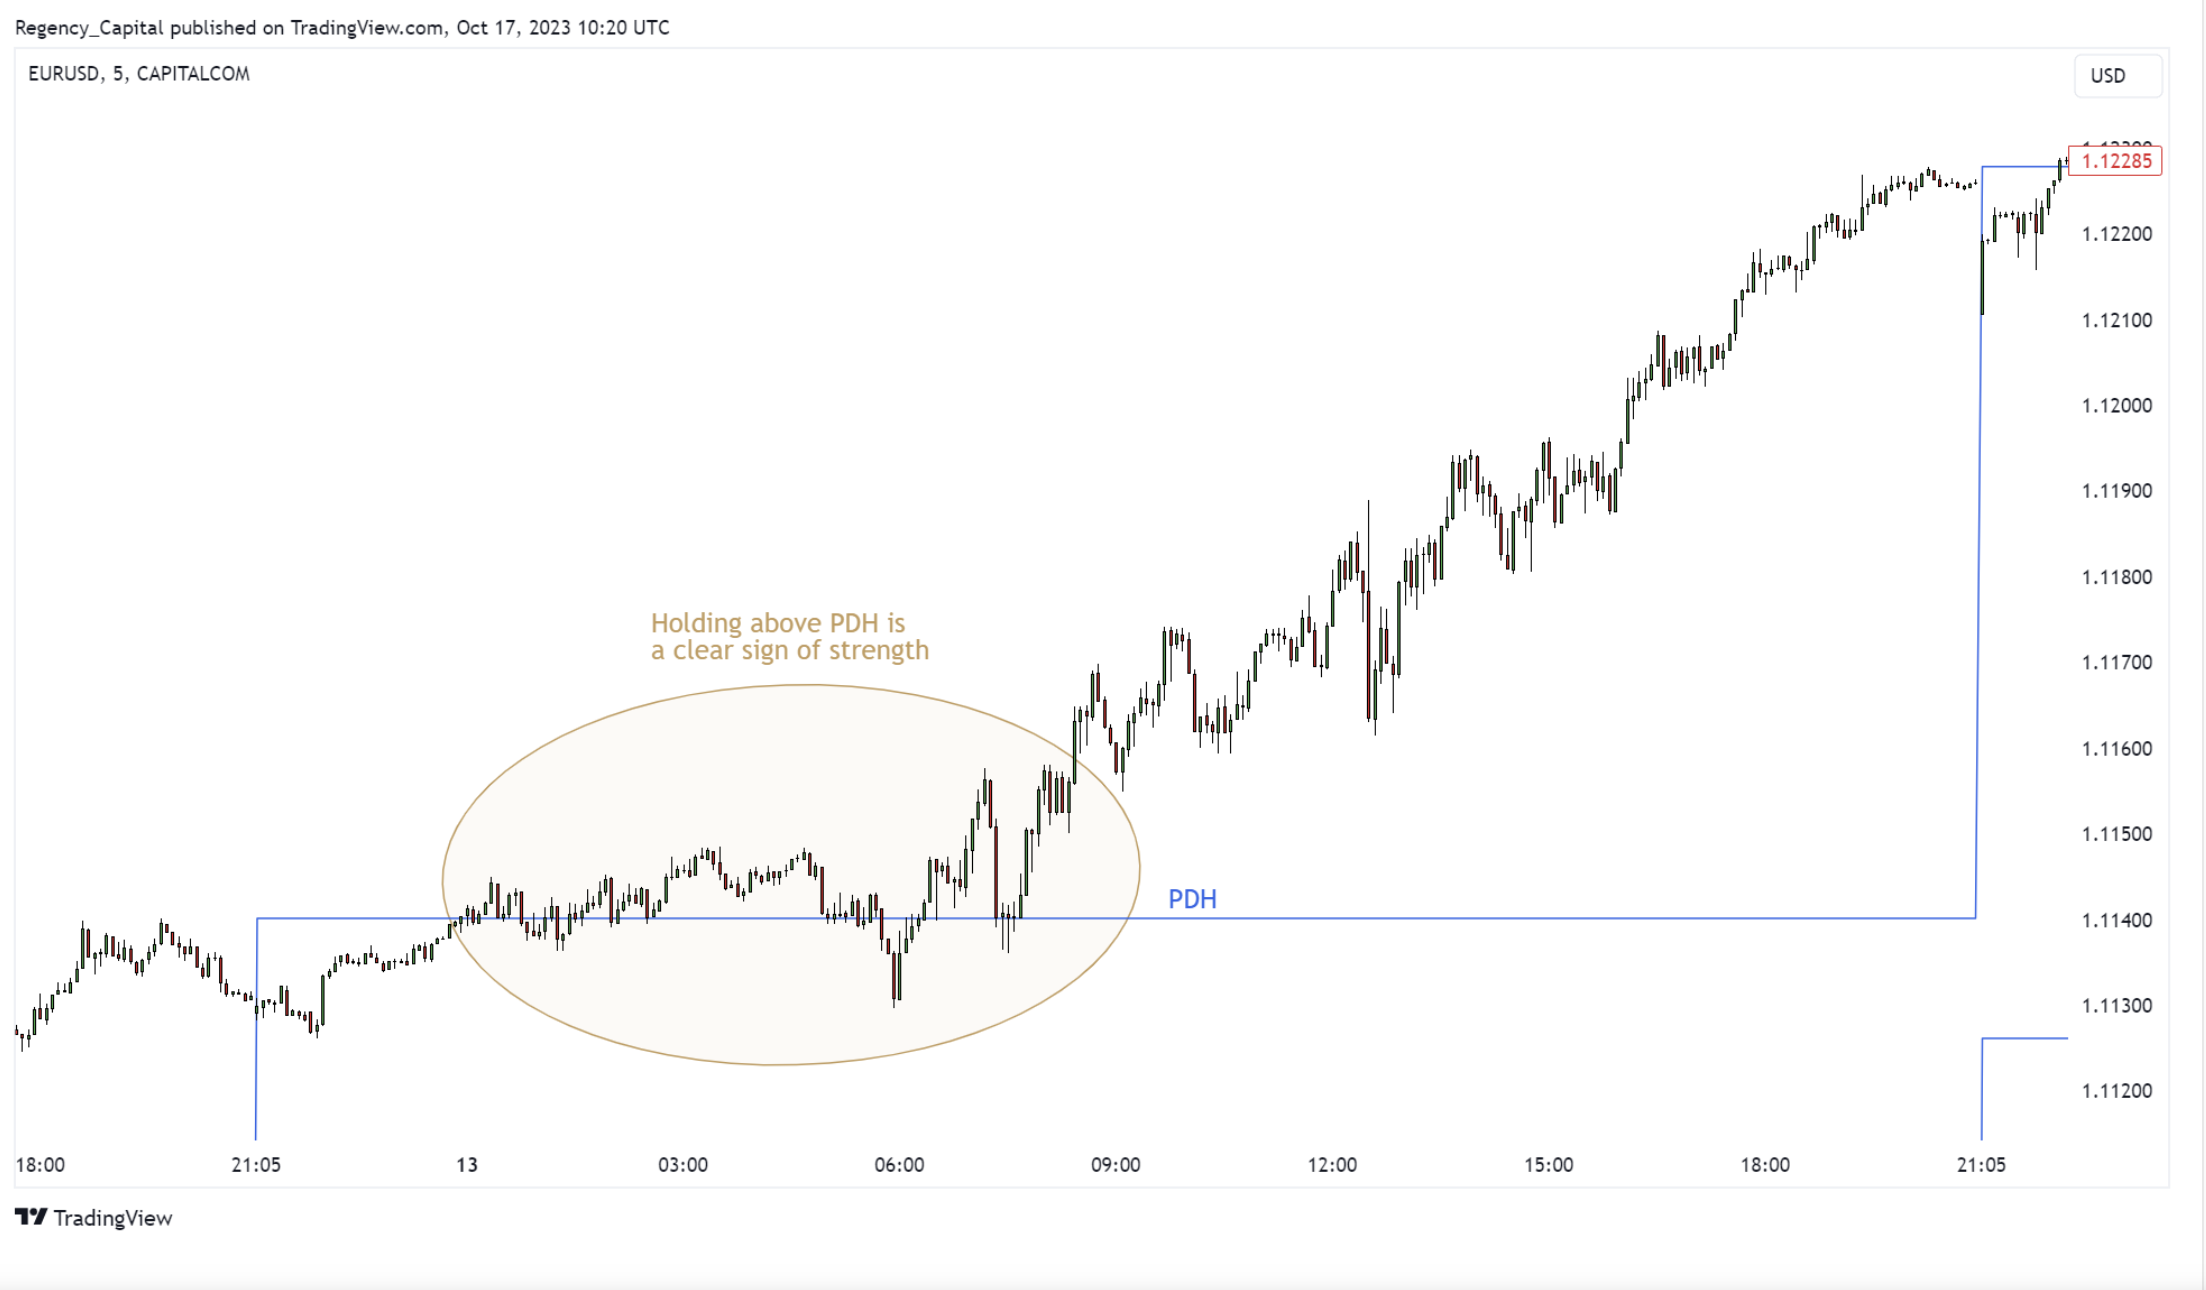
Past performance is not a reliable indicator of future results.
Failure to hold above PDL can suggest persistent selling pressure (EUR/USD 5-minute chart)
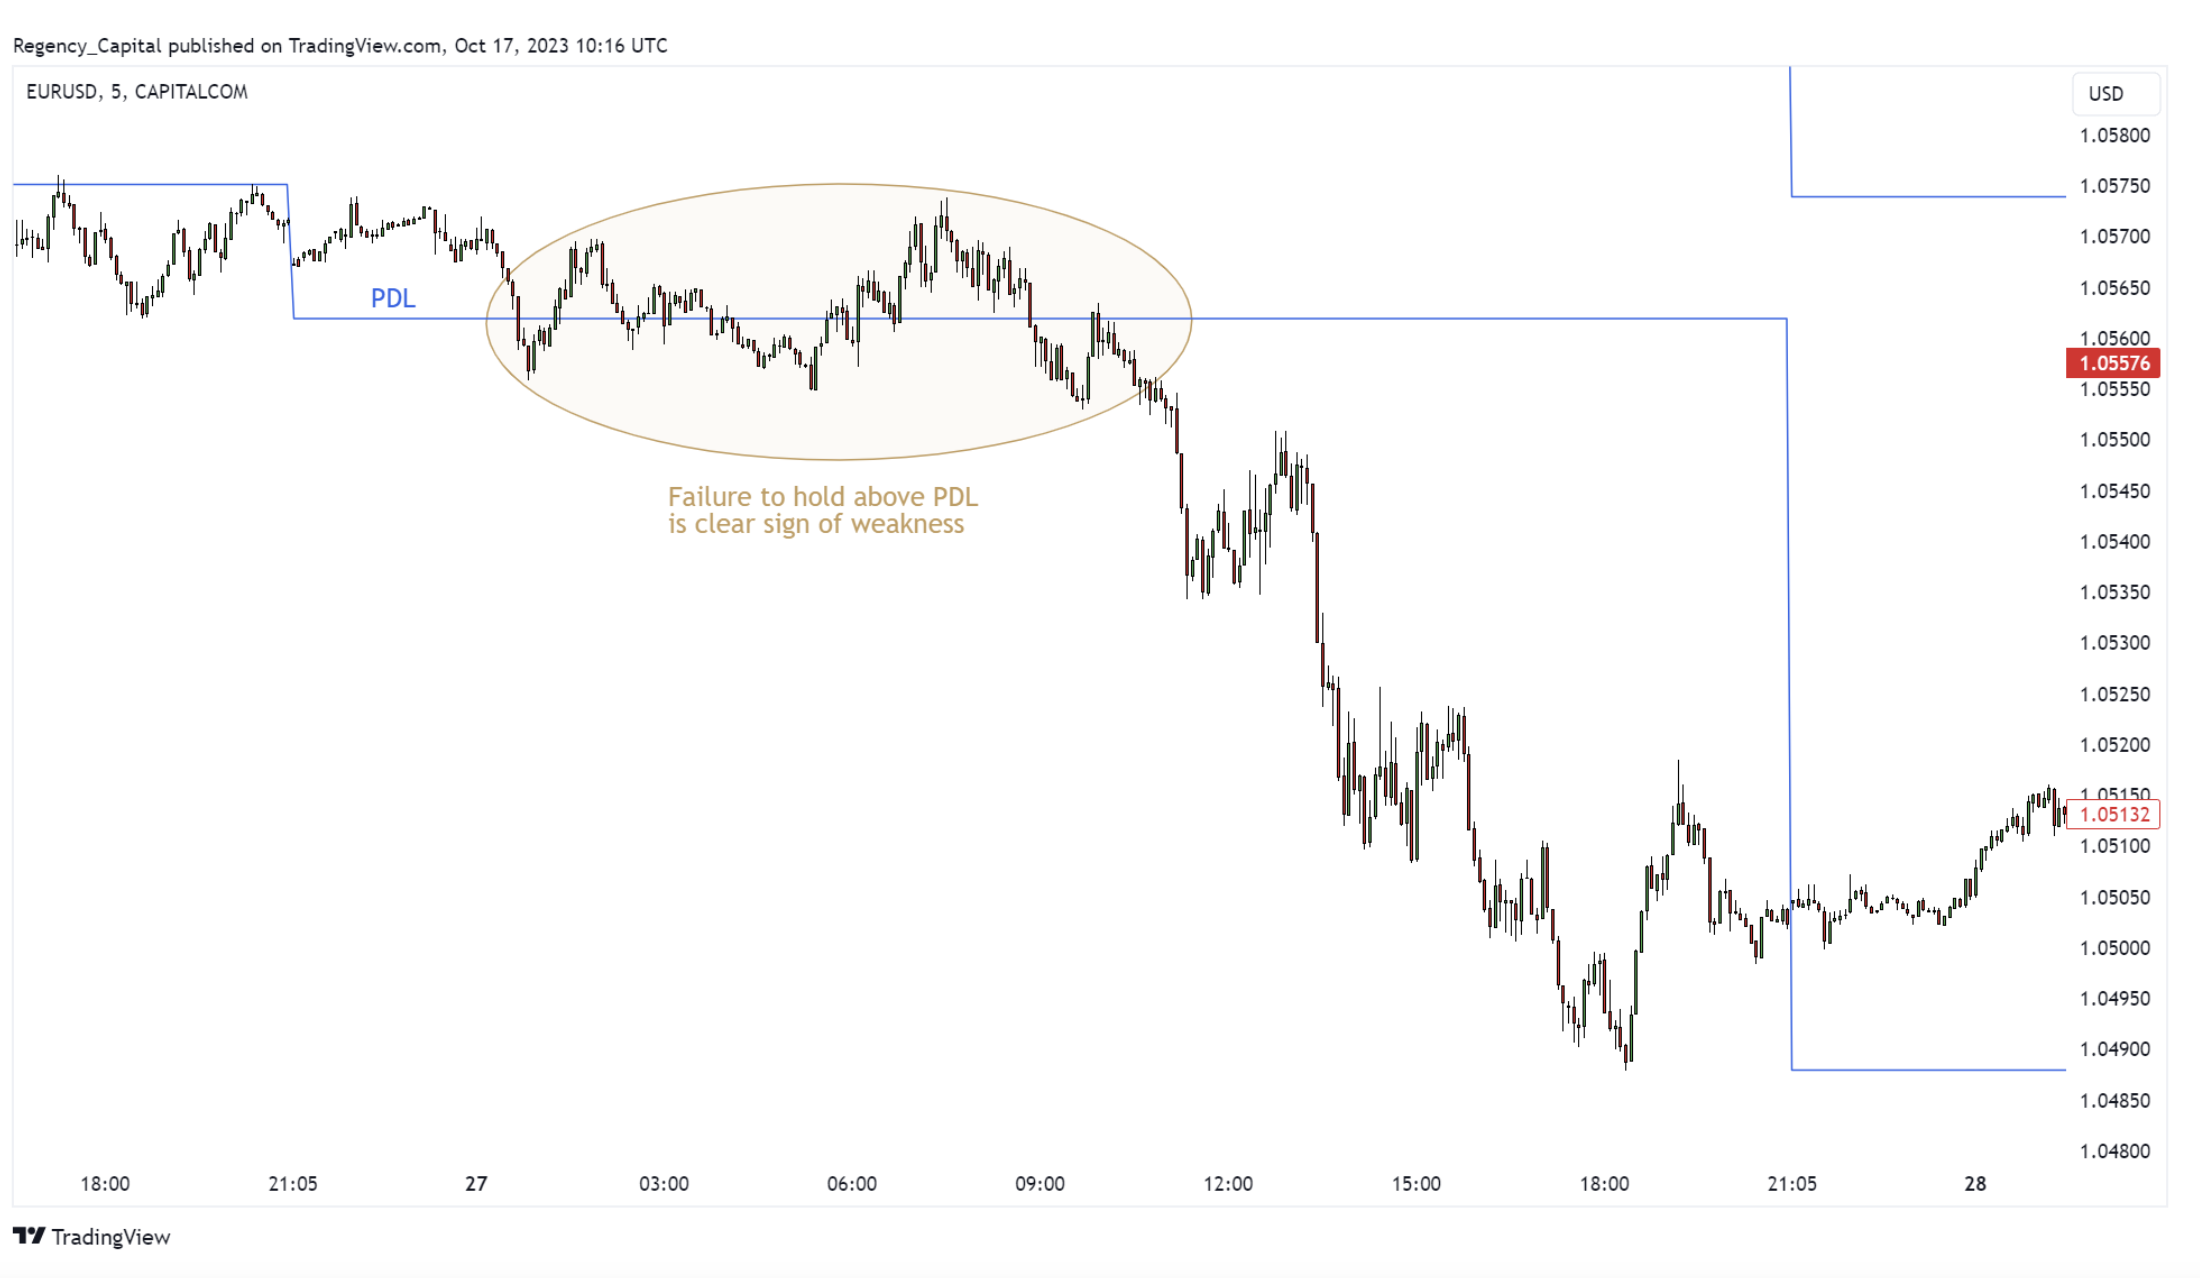
Past performance is not a reliable indicator of future results.
Price reactions and reversals
Traders often use PDH and PDL as reference levels for setting stop-loss or take-profit orders, or to assess risk-to-reward balance. Because these levels attract attention, they frequently act as temporary support or resistance.
- A reversal pattern forming near PDH or PDL tends to be more meaningful than one appearing within the prior day’s range.
- If price breaks and consolidates above PDH, the level may then act as support. Conversely, a sustained break below PDL can turn it into resistance.
For example:
PDH and PDL acting as support and resistance (EUR/USD 5-minute chart)
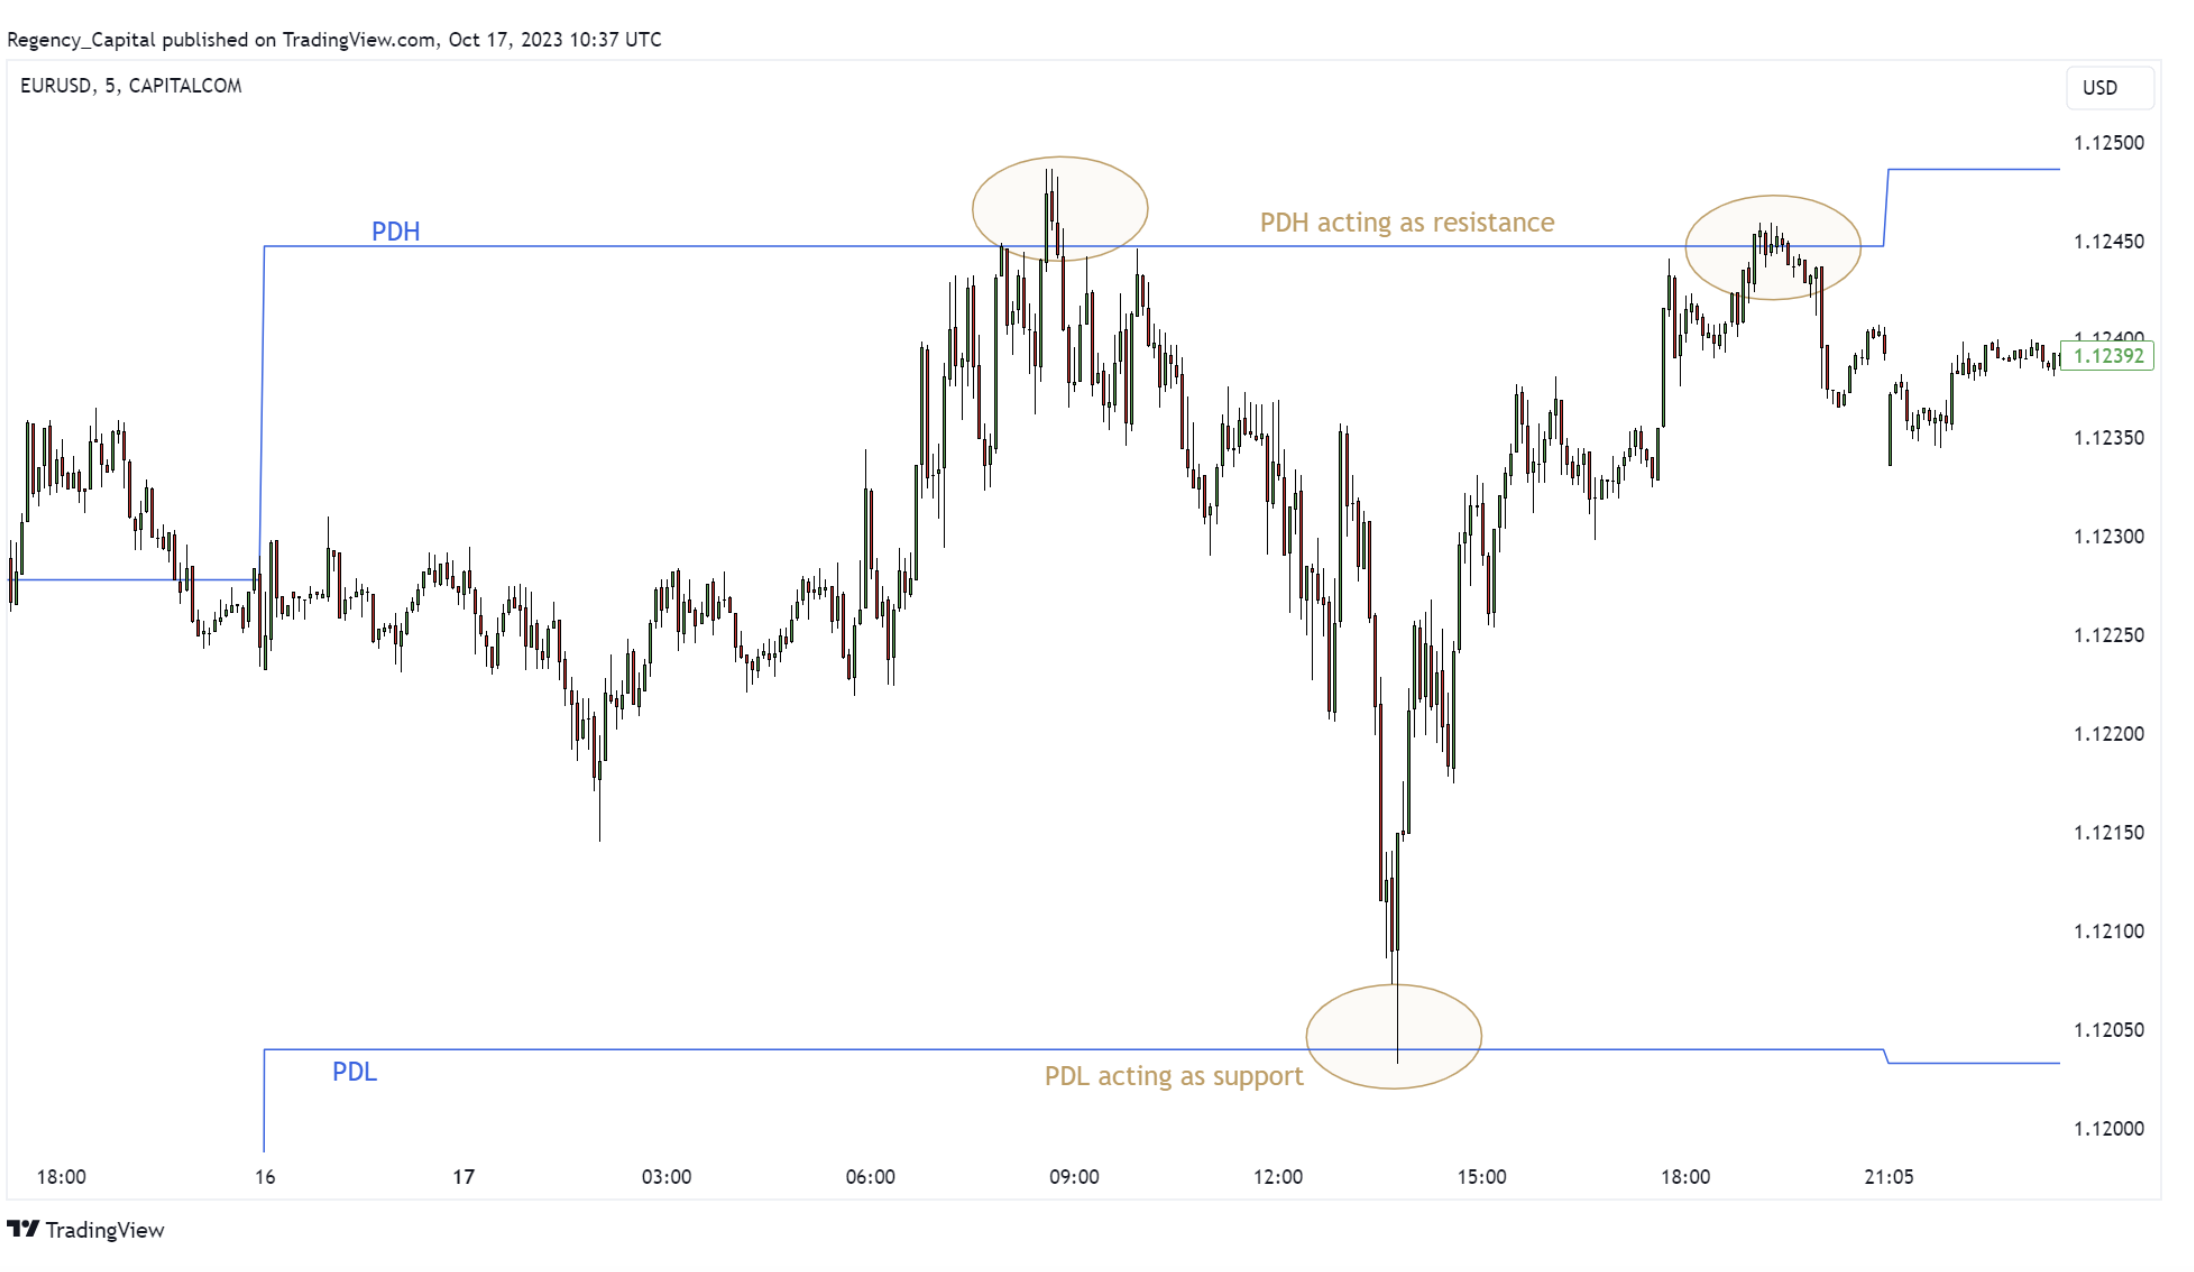
Past performance is not a reliable indicator of future results.
Broken PDH becoming support (EUR/USD 5-minute chart)
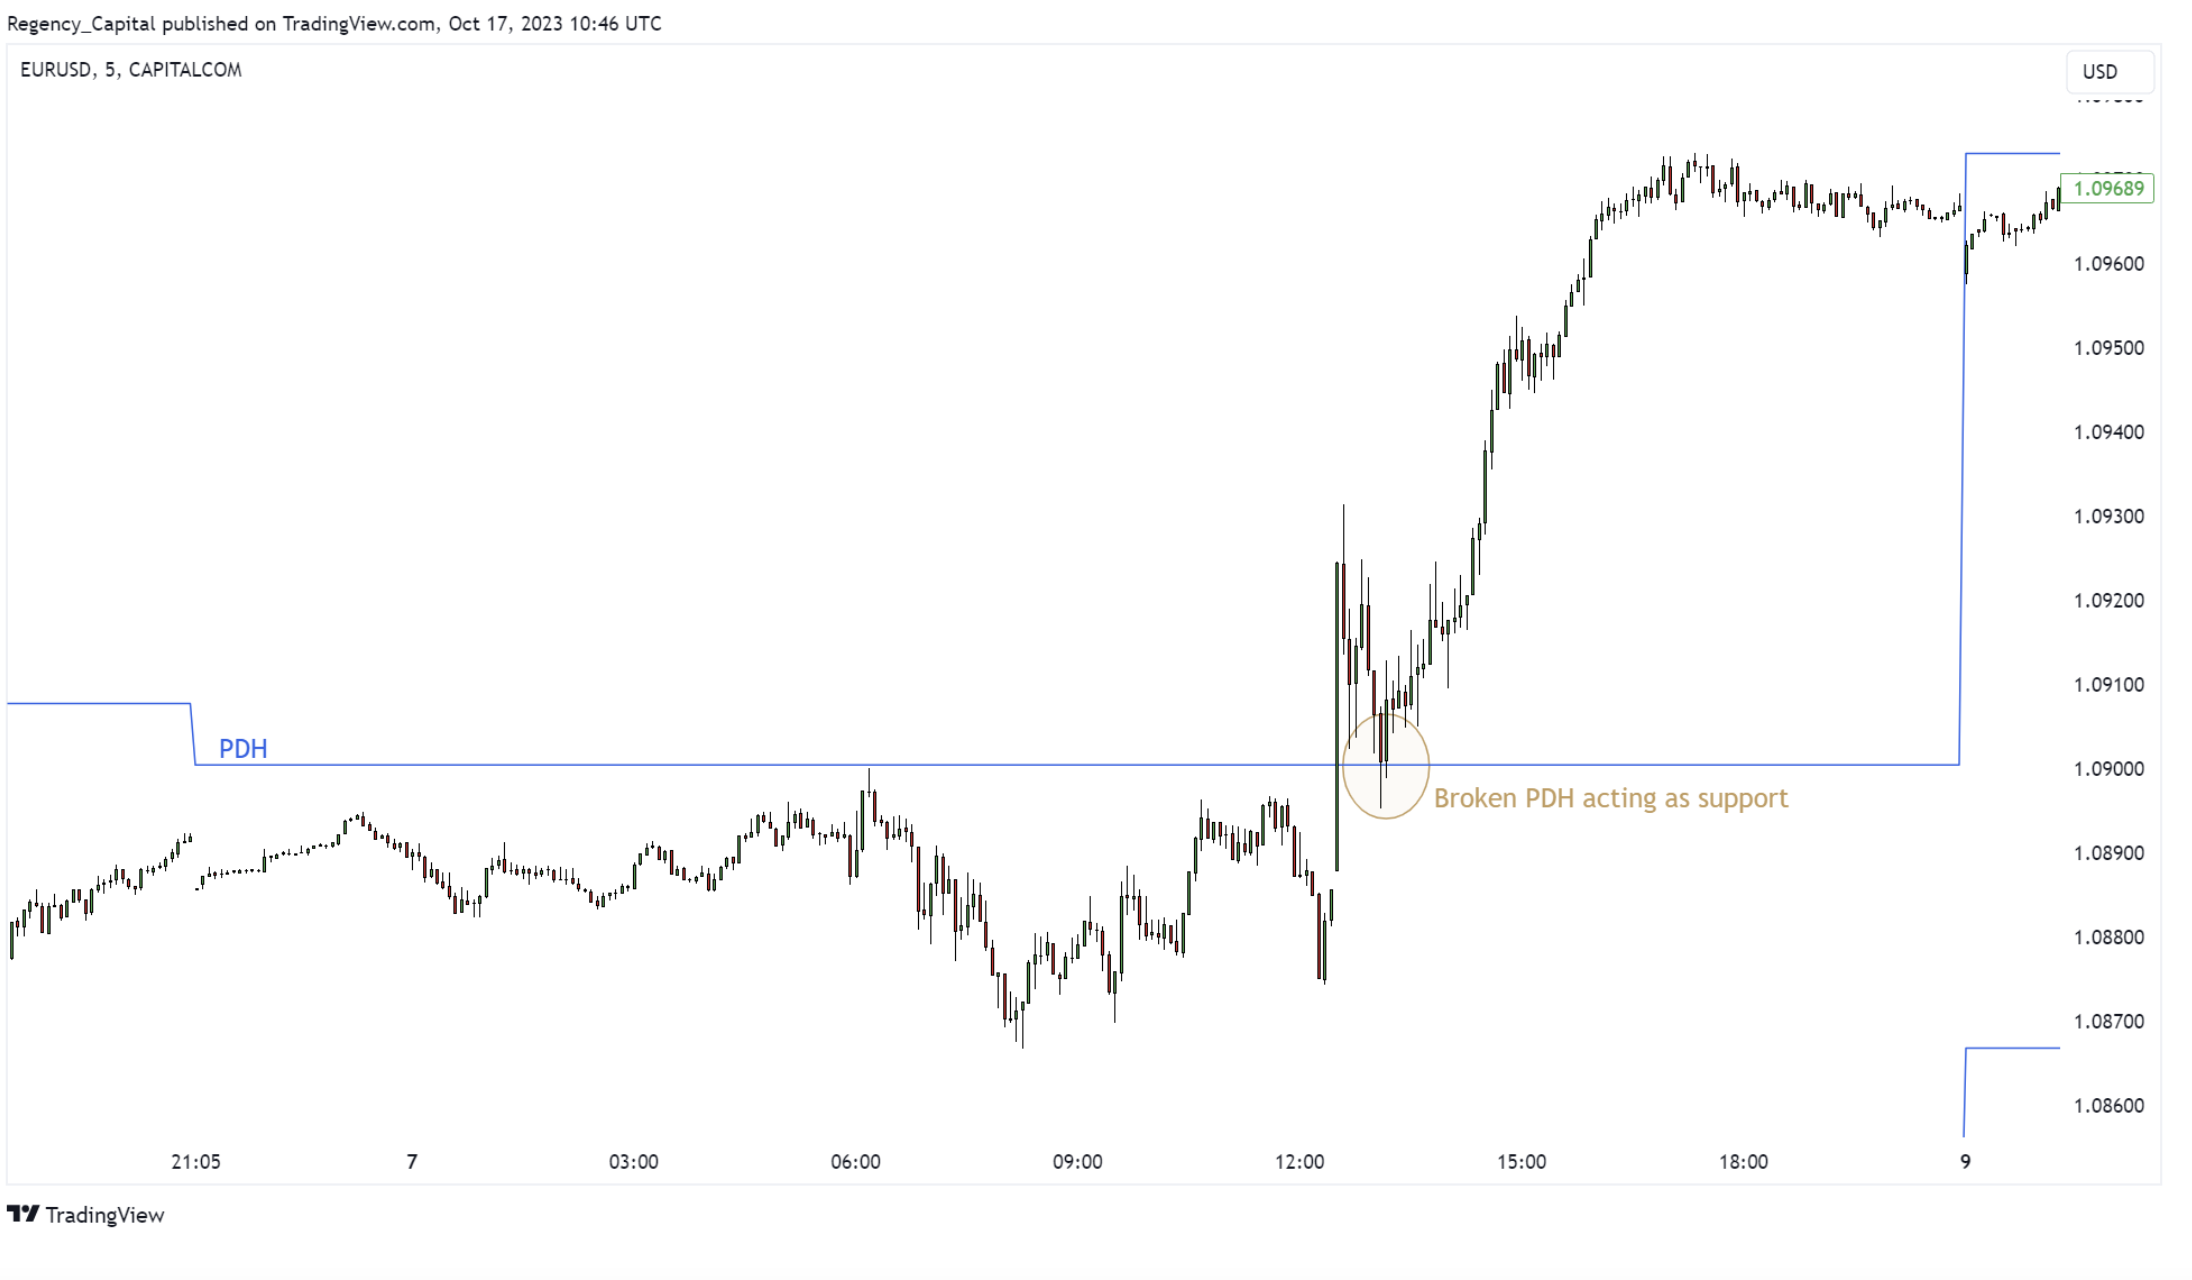
Past performance is not a reliable indicator of future results.
Broken PDL becoming resistance (EUR/USD 5-minute chart)
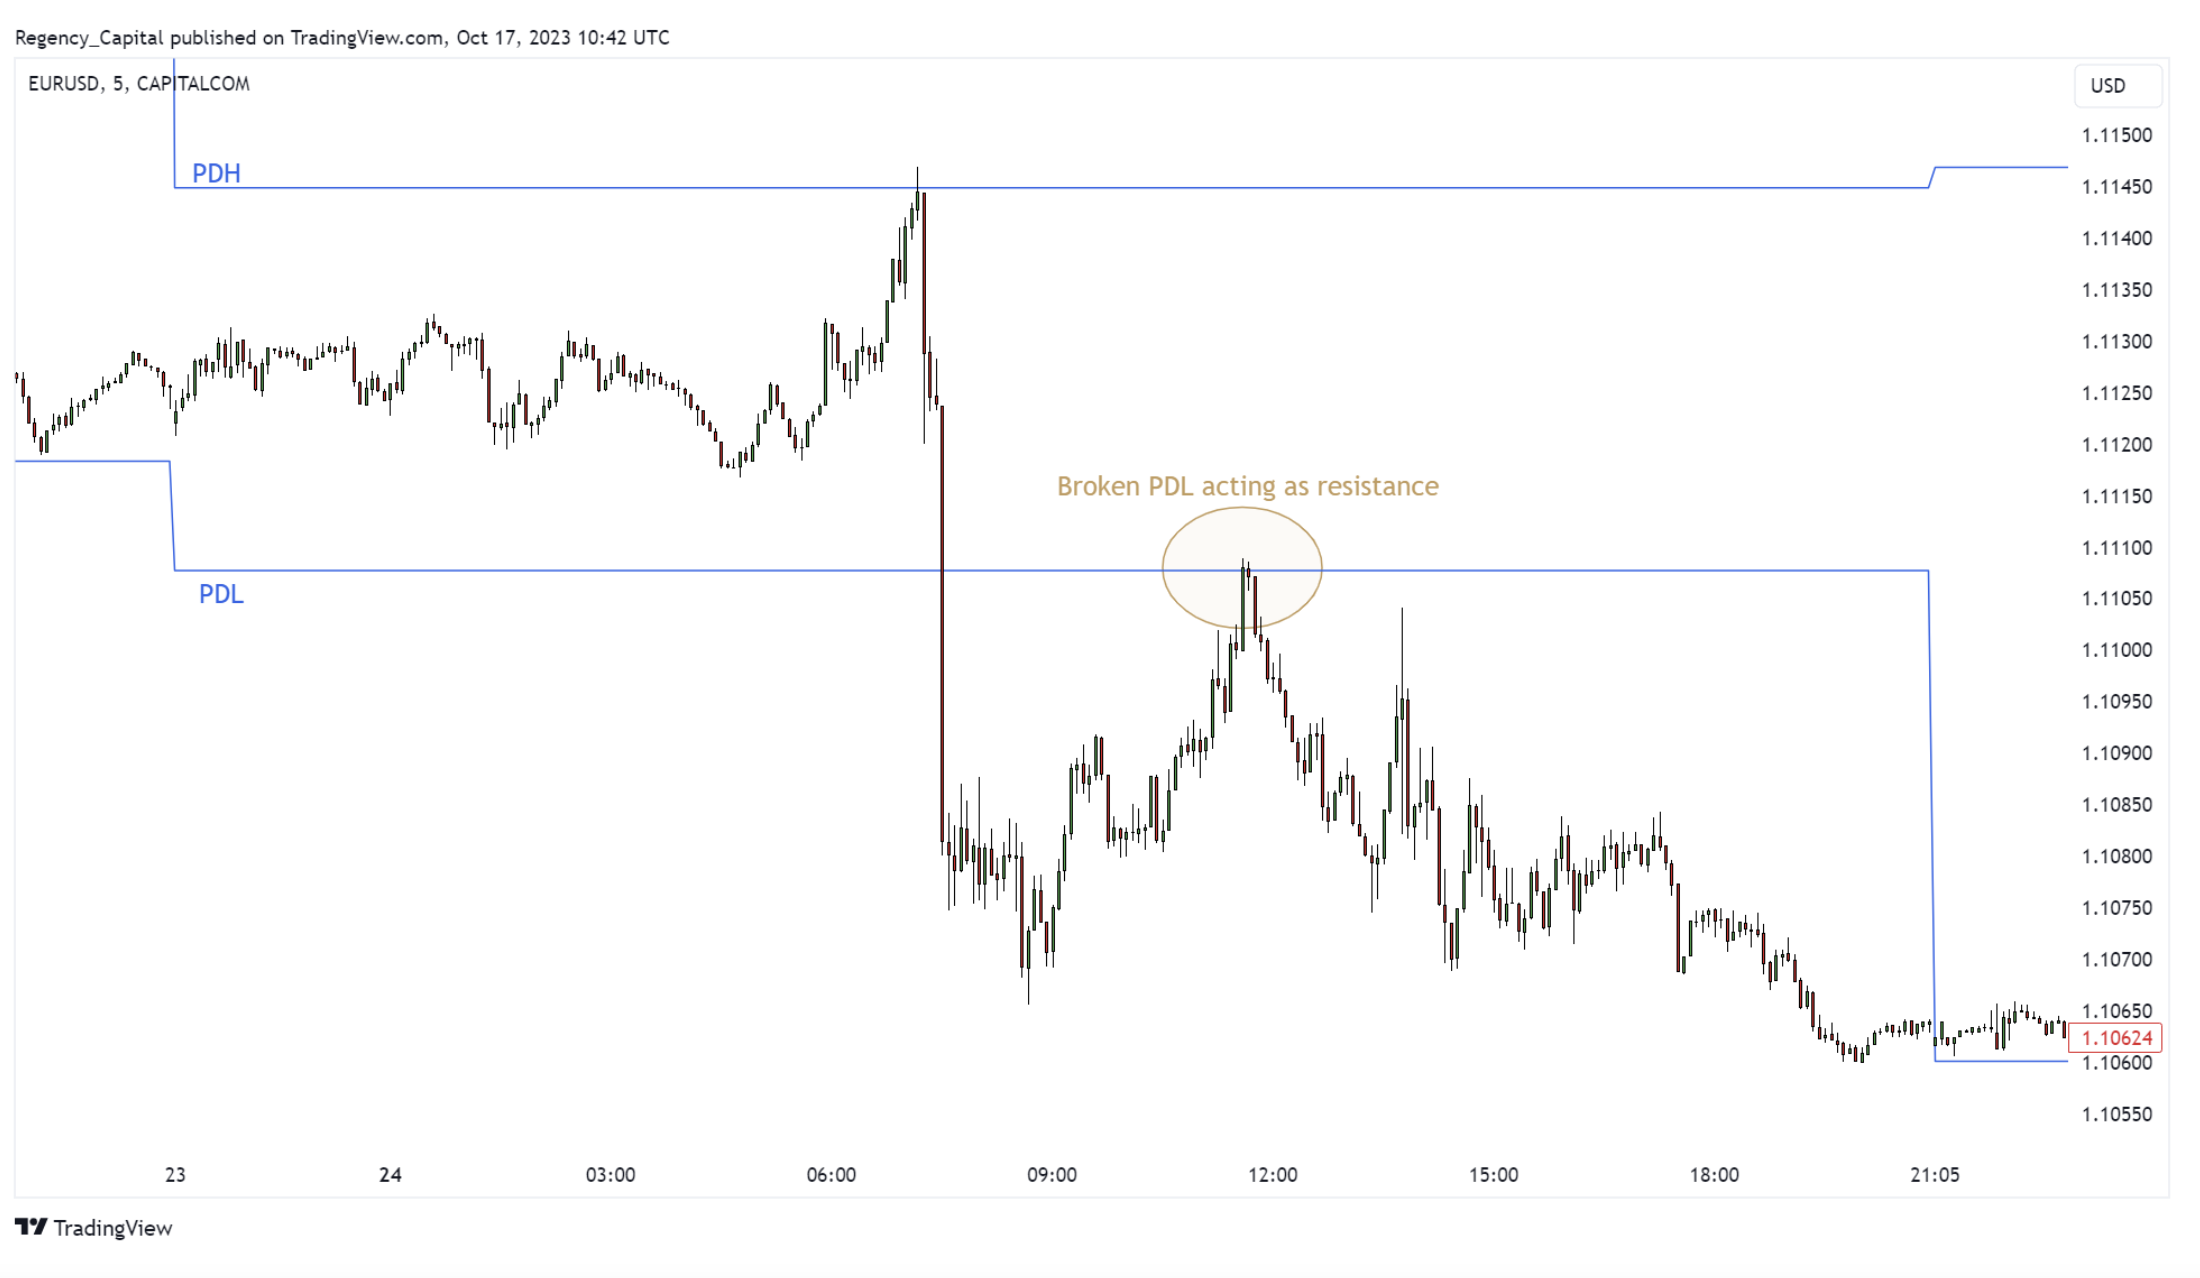
Past performance is not a reliable indicator of future results.
No additional indicators are needed — simply observing how price behaves around PDH and PDL can already provide valuable context.
To reinforce this concept, add PDH and PDL to your charts and review past sessions.
You’ll often find that price reacts in a consistent, technically relevant way at these levels.
How to use PDH and PDL
Here are some practical steps for applying PDH and PDL in your daily routine:
- Identify PDH and PDL: Before trading begins, mark the previous day’s high and low. On platforms such as TradingView, you can search for ‘Previous Day High and Low’ indicators that display these levels automatically.
- Observe price behaviour: Use the principles above to structure your session. For example, if price opens within the prior day’s range, traders might watch for potential reactions near PDH or PDL. If price trades firmly above PDH, some may look for pullbacks aligned with that direction.
- Combine with other tools: PDH and PDL can be complemented by indicators such as volume-weighted average price (VWAP), moving averages, or oscillators like RSI to confirm or filter trade ideas.
- Set stop-loss and take-profit orders: Use PDH and PDL as guide levels when assessing potential risk versus reward.*
- Stay informed: Monitor scheduled news releases or unexpected events that could cause volatility spikes. Such events can push prices rapidly through these levels, bypassing typical reactions.
- Practise and review: The best way to build confidence is through regular review. Use TradingView’s Replay mode to study how markets have behaved around PDH and PDL across multiple sessions.
*Standard stop-loss orders are not guaranteed. Guaranteed stop-loss orders incur a fee if activated.
Summary
The previous day’s high (PDH) and previous day’s low (PDL) are simple yet powerful tools that can bring structure to day trading. They can help traders understand market sentiment, identify potential turning points, and define risk parameters. By integrating these reference levels into your routine, you can approach the day’s price action with greater context and consistency.
Create an account Open a demo account
FAQ
What are the previous day’s high (PDH) and previous day’s low (PDL)?
The previous day’s high (PDH) and previous day’s low (PDL) mark the highest and lowest prices a market reached during the last trading session. These levels help traders understand where strong buying or selling activity occurred. Because they highlight recent extremes in market sentiment, PDH and PDL often act as reference points for intraday analysis, particularly among short-term traders.
Why are PDH and PDL important for day traders?
Day traders rely on PDH and PDL to interpret short-term momentum and potential turning points. When price stays above PDH, it may indicate continued buying interest, while trading below PDL can signal weakness. Many traders also use these levels to set stop-loss or take-profit orders, as PDH and PDL can serve as natural areas of support or resistance. Standard stop-loss orders are not guaranteed, while guaranteed stop-loss orders incur a fee if activated.
Can I trade CFDs using PDH and PDL on Capital.com?
Yes, you can trade CFDs on thousands of global markets through Capital.com’s award-winning platform, using PDH and PDL as part of your technical analysis. The platform offers customisable charts, indicators, and seamless integration with TradingView and MT4 to help you analyse key levels effectively. As always, remember that trading CFDs carries a high level of risk, as leverage can amplify both gains and losses. Ensure you fully understand the risks and use proper risk-management tools before trading.