
Bitcoin price prediction: $643.3m spot ETF outflows
Explore third-party Bitcoin forecasts, technical analysis, and market developments. Bitcoin fell 7.3% in October 2026, while US spot Bitcoin ETFs recorded $643.3m in net outflows on 30 October, their largest single-day outflow since June.
Past performance is not a reliable indicator of future results.
Bitcoin CFDs (BTC/USD) traded at $76,896 as of 12:03pm UTC on 3 November 2026, within an intraday range of $76,393.90–$78,546.55, based on Capital.com price data. Past performance is not a reliable indicator of future results.
BTC’s latest price moves follow the $6.3bn Binance security breach, which the FBI attributed to North Korea's TraderTraitor group, coincided with wider cryptocurrency market volatility. US spot Bitcoin exchange-traded funds (ETFs) recorded $643.3m in net outflows on 30 October, while Strategy and Strive reported further Bitcoin purchases ahead of the 3 November US midterm elections (FBI, 31 October 2026; CoinDesk, 2 November 2026; The Block, 2 November 2026).
Third-party Bitcoin outlook: spot ETF outflows, Binance breach
As of 2 November 2026, third-party BTC price predictions include algorithmic estimates, scenario ranges and conditional outlooks. These forecasts do not represent a broker consensus or investment recommendations.
Bitcoin price prediction 2026
- CoinLore projects a 2026 Bitcoin price range of $39,738–$110,541, reflecting bearish and bullish scenarios (CoinLore, 3 November 2026).
- CoinCodex forecasts Bitcoin at $80,041 over the next month, identifying resistance at $81,990–$83,673 and noting that a break above these levels could bring $88,596, $92,220 and $97,637 into view (CoinCodex, 29 October 2026).
- CryptoPredictions estimates Bitcoin at $74,903 by the end of 2026, within a range of $68,100–$82,400, based on historical price data and technical indicators (CryptoPredictions, 3 November 2026).
- Crypto News models a December 2026 base case of $55,000–$75,000, with bearish and bullish scenarios of $38,000–$52,000 and $80,000–$105,000 respectively (crypto.news, 3 November 2026).
- CoinDataFlow forecasts a 2026 Bitcoin trading range of $53,343.19–$83,724.33, using a model based on historical price cycles (CoinDataFlow, 3 November 2026).
Bitcoin price prediction 2027
- CoinLore projects a 2027 Bitcoin price range of $44,005–$145,765, with a base scenario of $125,618 (CoinLore, 3 November 2026).
- CryptoPredictions estimates Bitcoin at $78,156 by the end of 2027, within a range of $69,300–$87,200 (CryptoPredictions, 3 November 2026).
- Crypto News projects a 2027 base-case range of $65,000–$95,000, with bearish and bullish scenarios of $40,000–$62,000 and $110,000–$160,000 respectively (crypto.news, 3 November 2026).
- CoinDataFlow forecasts a 2027 Bitcoin trading range of $54,069.61–$152,189.90, with an average price of $103,129.76 (CoinDataFlow, 3 November 2026).
Bitcoin price prediction 2030
- CoinLore forecasts Bitcoin at $420,097 by 2030 under a bullish scenario, with a bearish scenario of $120,855 and a base scenario of $235,574 (CoinLore, 3 November 2026).
- CryptoPredictions estimates Bitcoin at $104,532 by 2030, within a range of $91,200–$118,400 (CryptoPredictions, 3 November 2026).
- Crypto News models a 2030 base-case range of $120,000–$180,000, with bearish and bullish scenarios of $45,000–$85,000 and $250,000–$400,000 respectively (crypto.news, 3 November 2026).
- CoinDataFlow forecasts a 2030 Bitcoin trading range of $111,672.03–$283,128.23, with an average price of $197,400.13 (CoinDataFlow, 3 November 2026).
Bitcoin technical analysis
BTC/USD CFDs on Capital.com last traded at $76,896 as of 12:03pm UTC on 3 November 2026 , below its 20- and 50-day simple moving averages (SMAs) near $80,277 and $80,038 respectively, but above its 100- and 200-day SMAs near $76,652 and $73,156.
The 14-day relative strength index (RSI) stood at 35.93, indicating subdued momentum without reaching the conventional oversold threshold of 30. The 14-day average directional index (ADX) read 23.00, suggesting limited trend strength. The fast stochastic RSI at 12.12 and Williams %R at −91.43 were near the lower ends of their ranges, indicating weak short-term momentum.
On the upside, the classic pivot at $80,261 provides a resistance reference. A move above this level could bring R1 at $84,371 into view, followed by R2 at $91,283.
On the downside, the 100-day SMA near $76,652 provides an initial support reference, followed by S1 at $73,350 and the 200-day SMA near $73,156. The nine-period Hull moving average stands near $76,586, close to the quoted price. A sustained move below these support levels could increase downside risk, although technical indicators cannot reliably predict future price movements (TradingView, 2 November 2026).
This is technical analysis for informational purposes only and does not constitute financial advice or a recommendation to buy or sell any instrument.
Bitcoin CFD price history (2024–2026)
BTC/USD’s CFD price has seen substantial movements over the past two years. The cryptocurrency started January 2025 near $94,410 and rose over the following months, reaching a peak around $126,080 in October 2025. The price then declined towards $86,322 by 1 December. Bitcoin opened 2026 near $88,758 and continued to fall, dropping towards $59,988 by early July before recovering into the $70,000–$80,000 range.
In September 2026, Bitcoin traded within a range of $74,933–$81,491. In October, the price rose from around $80,500 to $87,008 before falling towards $79,283. Bitcoin opened November near $76,705 and traded at $76,896 as of 12:03pm UTC on 3 November.
Over the period, Bitcoin recorded substantial gains and losses amid changing market sentiment, macroeconomic conditions and cryptocurrency-specific developments. Its price moved above $120,000 in October 2025 and briefly below $60,000 in July 2026, illustrating the extent of its historical volatility.

Past performance is not a reliable indicator of future results. Prices are indicative and may differ from live market prices.
Latest Bitcoin news and market developments
$6.3bn Binance breach
The $6.3bn Binance security breach, which the FBI attributed to North Korea's TraderTraitor group, added to uncertainty across cryptocurrency markets.
Binance resumed withdrawals in phases on 1 November. During the first nine and a half hours, the exchange processed $4.65bn in withdrawals and $1.01bn in deposits, leaving approximately $3.64bn in net outflows (The Block, 1 November 2026).
Spot Bitcoin ETF outflows
US spot Bitcoin ETFs recorded $643.3m in net outflows on 30 October, their largest single-day outflow since June. The withdrawals reduced year-to-date net inflows by 63.6% (CoinDesk, 2 November 2026).
Institutional BTC activity
Corporate purchases continued despite the volatility: Strategy added 811 BTC for $65.5m, lifting its holdings to 849,327 BTC, while Strive acquired 124 BTC, bringing its total to 43,124 BTC (The Block, 2 November 2026).
Capital.com analyst view – Bitcoin analysis
ETF flows and institutional demand could influence Bitcoin's price in either direction. Renewed inflows or corporate purchases may provide support, while sustained outflows and regulatory uncertainty could weigh on demand. The Binance security breach may also affect confidence in cryptocurrency markets, although Strategy and Strive continued to buy during the recent volatility.
US political developments and Federal Reserve interest-rate decisions could influence broader market sentiment. Their effect on Bitcoin will depend on market expectations and economic conditions, while past price movements cannot reliably indicate future direction.
Capital.com’s client sentiment for Bitcoin CFDs
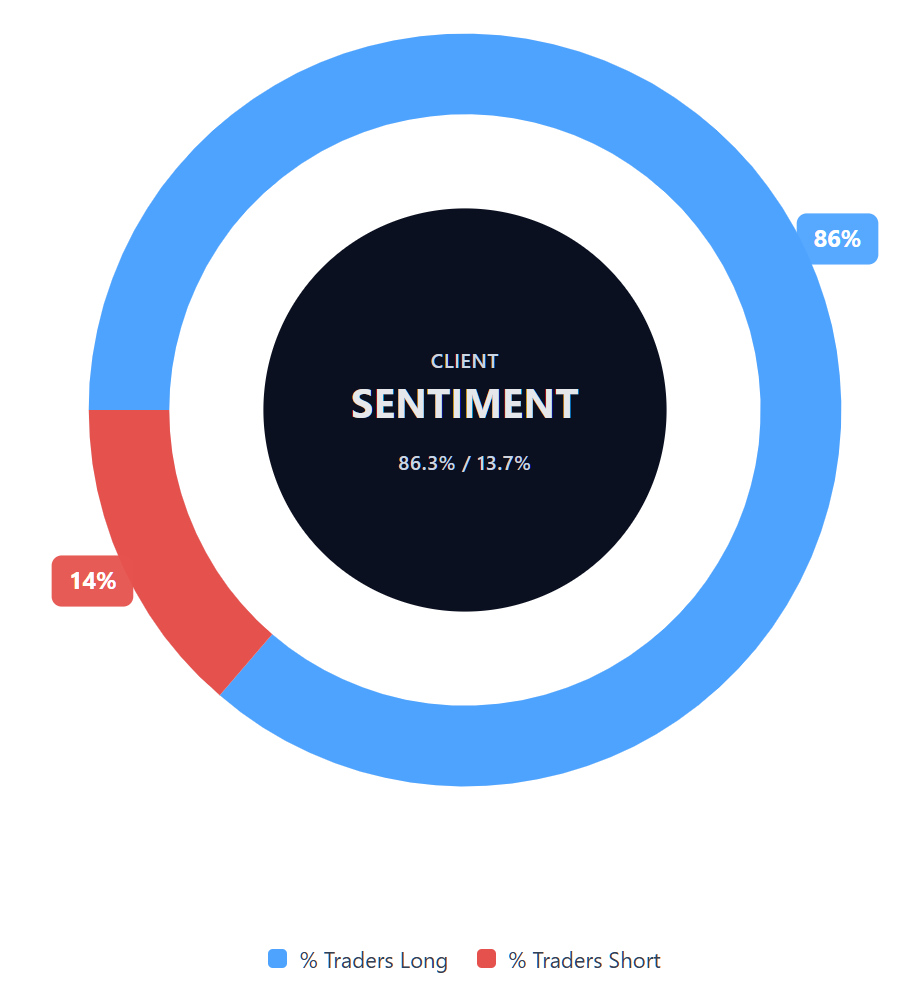
As of 2 November 2026, Capital.com client positioning in Bitcoin CFDs shows 86.3% buyers and 13.7% sellers, a difference of 72.6 percentage points. The figures reflect a snapshot of open positions on Capital.com and can change. They do not indicate future price direction.
Summary – Bitcoin (2026)
- Bitcoin traded at $76,896 as of 12:03pm UTC on 3 November 2026, within an intraday range of $76,393.90–$78,546.55.
- According to TradingView data, the 14-day RSI stood at 35.93, indicating subdued momentum without reaching oversold territory, while the ADX of 23.00 suggested limited trend strength.
- Potential price influences include ETF flows, corporate Bitcoin purchases, regulatory developments, the Binance security breach and broader macroeconomic conditions.
- Recent news includes $643.3m in US spot Bitcoin ETF outflows on 30 October, alongside further purchases by Strategy and Strive.
Past performance is not a reliable indicator of future results.