Trade Australia 200 - AU200
The Australia 200 is a tradeable index market with Capital.com. It enables you to take a position on the top 200 companies – by market capitalisation – listed on the Australian Securities Exchange, using CFDs.
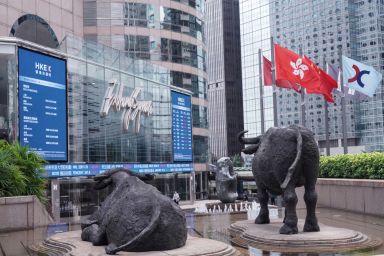
The Australia 200, also known as the AU200, is a stock market index that measures the performance of the 200 largest stocks listed on the Australian Securities Exchange (ASX), providing a comprehensive overview of Australia's corporate sector and overall economic health. Introduced in April 2000, it serves as a benchmark for the Australian equity market.
The Australia 200 is calculated based on market capitalisation, and companies included must meet specific liquidity and size criteria. Top companies in the Australia 200 encompass a range of industries, including banking giants like Commonwealth Bank of Australia, natural resource firms such as BHP, and healthcare leaders including CSL Limited.
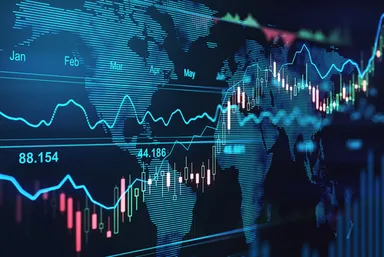
For traders and investors, the Australia 200 index offers insights into the Australian market's trends. Its diverse composition makes it a useful tool for assessing the economic climate across different sectors. Traders can track the index's movements through various means, including Australia 200 charts and futures, offering valuable data for trading strategies.
Open a risk-free demo account to practise trading on the Australia 200 and other markets, without any risk to your capital.
Trade Australia 200 (AU200) CFDs
Australia 200 (ticker: AU200) is an index that reflects the performance of a selected group of shares, usually tied to a specific market, region or sector. On Capital.com, it’s available to trade as a contract for difference (CFD), allowing you to speculate on price movements without owning any of the underlying shares. This means you can trade in either direction – rising or falling – depending on your view.*
*CFDs are traded on margin, leverage amplifies both profits and losses.
Australia 200 price today
The index is quoted in A$ and is currently trading around 9002.
Live price overview
Here’s an overview of the current Australia 200 price and its recent trading ranges.
- Daily range: 8947.6 – 9023.6
- Daily movement: +7.5 (+0.0835)
- Weekly range: 8735.6 – 9086.6
- Monthly range: 8629.3 – 9086.6
- Yearly range: 8252 – 9225
Why trade index CFDs on the price of Australia 200 with Capital.com?
Capital.com provides a technology-driven trading experience that supports informed decision-making.
Advanced charting and analysis
Use interactive tools to study the Australia 200 price chart in detail.
- Access 100 technical indicators
- Choose from 12 chart types
- Analyse fast, intuitive charts powered by industry-leading tools
Wide market offering
Join over 870,000 global traders and explore more than:
- 4,500 stock CFDs
- 65 commodity CFDs
- 35 index CFDs
- 120 forex pairs
- 450 crypto CFDs
User-rated platforms
- TradingView rating: 4.6
- App Store rating: 4.7
- Google Play rating: 4.6
- Trustpilot score: 4.6
What influences the price of Australia 200?
The Australia 200 (AU200) price may be influenced by various market factors, including:
- Performance of the companies within the index
- Macroeconomic indicators such as GDP, inflation, and employment data
- Central bank policy decisions
- Broader market sentiment and risk appetite
- Geopolitical events or global news
Australia 200 forecasts
Australia 200 forecasts commonly focus on news, sector updates, and broader market conditions rather than fixed price targets. Traders can combine technical analysis with fundamental insights to form expectations about future price movement.
Instead of relying on a single prediction, many traders monitor ongoing analysis and real-time data to adapt to changing market conditions.*
*Analyst forecasts are often inaccurate and past performance isn’t a reliable indicator of future results.
How to trade Australia 200 index CFDs
Trading index CFDs allows you to speculate on price direction without owning the underlying shares:
- Go long (buy) if you think the index may rise
- Go short (sell) if you think it may fall
As CFDs use leverage, both gains and losses are magnified.
Risks of trading index CFDs
CFD trading carries a high level of risk. Key risks include:
- Market volatility
- Leverage amplifying losses as well as profits
- Potential funding costs for overnight positions
- No ownership of any underlying assets
Latest indices articles