Alphabet stock forecast: Third-party projections
Alphabet (GOOG) traded at $265.37 at 12:34 pm UTC on 27 October 2025, near the top of its intraday range between $255.00 and $265.76.
As of 27 October 2025, Alphabet’s share price movements reflected broad market gains amid expectations of a potential Federal Reserve rate cut (Reuters, 21 October 2025) and easing U.S.–China trade tensions (Reuters, 27 October 2025). Alphabet remains in focus ahead of its Q3 2025 results, due later this week, as investors monitor updates on its AI and cloud businesses following recent news of an expanded cloud infrastructure partnership with Anthropic (Reuters, 23 October 2025).
Daniela Hathorn – Capital.com analyst view
Capital.com analyst Daniela Hathorn says Alphabet’s Q3 2025 results, due on 29 October, are expected to centre on three key themes: advertising, cloud, and capital expenditure (Capex).
For Google Cloud, margins and backlog remain the key story. Q2 showed an operating margin of roughly 21% and a larger large-deal pipeline, so investors will look for that profitability trend to continue and for demand signals to stay strong.
On Capex and AI, annual guidance remains elevated at around $75bn for data centres, servers and networks, alongside new infrastructure announcements in the US and India. Markets will gauge how that spending translates into revenue and when free cash flow begins to recover.
If Ads hold, Cloud margins expand and Capex looks productive, sentiment could stay firm; however, a slowdown in Cloud growth or any signs AI features affect search monetisation may limit the market reaction.'
Alphabet stock forecast: Analyst price target view
MarketBeat (aggregated analyst data)
According to MarketBeat, 48 analysts set an average 12-month price target of $264.34, within a range of $190.00 to $315.00. Firms noted upward revisions after Alphabet’s July earnings, reflecting continued focus on AI monetisation and advertising resilience (MarketBeat, 27 October 2025).
Morgan Stanley (equity research update)
Morgan Stanley reaffirmed an overweight rating with a $270.00 price target, citing stronger-than-expected cloud revenue and relative valuation support versus peers as AI workloads expand (MarketBeat, 27 October 2025).
JPMorgan Chase & Co. (investment note)
JPMorgan raised its price objective from $260.00 to $300.00 on Alphabet’s Class C shares. Analysts pointed to accelerating AI-related revenue and an improving operating-margin outlook following the summer earnings results (Investing.com, 27 October 2025).
Scotiabank (broker commentary)
Scotiabank reiterated an outperform rating with a $310.00 target, highlighting Alphabet’s leadership in proprietary AI chips and search-monetisation efficiency as key value drivers amid higher capital spending (Yahoo Finance, 21 October 2025).
Forecasts and analyst projections are inherently uncertain and may not reflect future performance. Past results are not reliable indicators of future outcomes.
GOOG stock price: Technical overview
Alphabet (GOOG) last traded at $265.37 at 12:34 pm UTC on 27 October 2025, holding above its 20-, 50-, 100- and 200-day moving averages (DMAs) at ~249 / 237 / 211 / 192. The 20-over-50 alignment remains intact, supporting a short-term bullish structure as the price trades near the upper end of its intraday range. The 10-day exponential moving average (EMA) is around 253, close to the short-term moving average cluster, with no clear divergence from the simple moving averages (SMAs).
Momentum is neutral, with the 14-day relative strength index (RSI) at 67.23, indicating upper-neutral conditions following recent gains. Trend strength, measured by the Average Directional Index (ADX, 14), is moderate at 20.71, suggesting no strong directional bias.
Resistance is seen at Classic R1 at 264.51, with a daily close above this level potentially opening the way to R2 at 285.48. Support is identified at the Classic Pivot at 235.74, followed by the 100-DMA near 211; a sustained move below this level could expose S1 at 214.77 (TradingView, 27 October 2025).
This analysis is provided for informational purposes only and does not constitute financial advice or a recommendation to buy or sell any instrument.
Alphabet share price history
Alphabet’s share price more than doubled in the past two years, rising from about $125 in October 2023 to $265.31 by 27 October 2025 – a gain of roughly 112%. The advance accelerated through 2025, as large-cap technology stocks benefited from momentum in artificial intelligence, digital advertising recovery and cloud-infrastructure growth.
As of 27 October 2025, the stock was up about 39% from its January open near $190. A period of consolidation around $200 in late summer preceded a rally through August and September, lifting Alphabet to multi-month highs above $260 by late October.
Past performance is not a reliable indicator of future results. Share prices are indicative and may differ from live market prices.
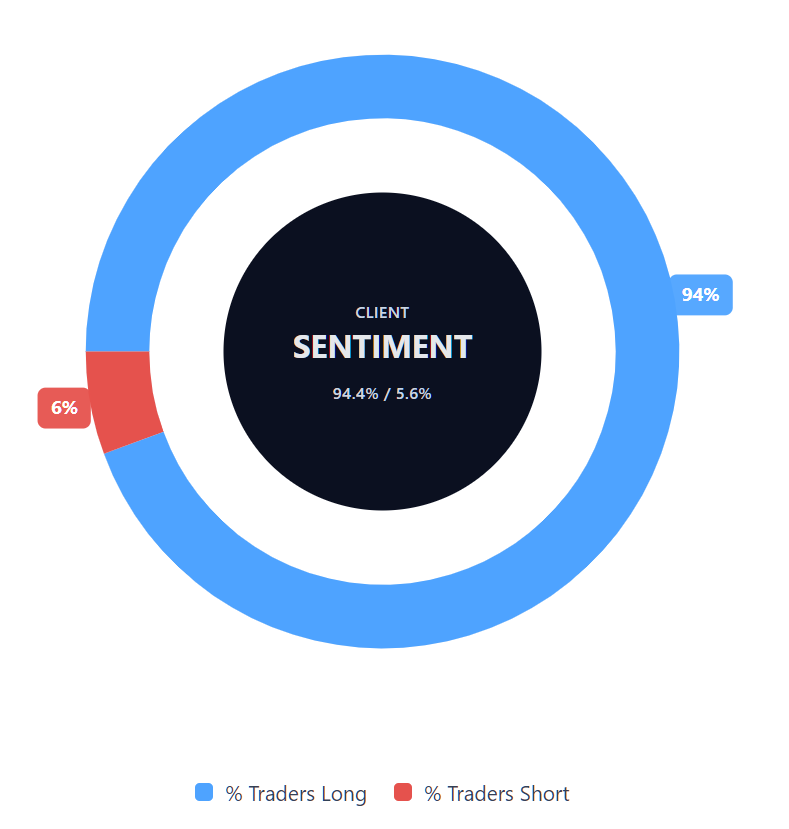
Capital.com’s client sentiment for Alphabet CFDs
As of 27 October 2025, client positioning in Alphabet CFDs on Capital.com is heavily weighted towards buyers, with about 94.4% of open positions long and 5.6% short. This indicates a net long bias of 88.8 percentage points. The data represents a snapshot of current open positions on the platform and is subject to change.
FAQ
Is Alphabet a good stock to buy?
Alphabet is one of the world’s largest technology companies, with key revenue streams in digital advertising, cloud computing and artificial intelligence. Analysts generally regard it as a major player in long-term technology trends. However, its share price is affected by market conditions, competition and regulation, and performance can vary. This information is not financial advice.
Could Alphabet stock go up or down?
Alphabet’s share price can move in either direction, influenced by market sentiment, earnings results and wider economic factors such as interest rate expectations and changes in technology spending. Like any listed stock, prices are volatile and can fluctuate over time. Past performance is not a reliable indicator of future results.
Should I invest in Alphabet stock?
Whether to invest in Alphabet depends on your financial objectives, risk tolerance and market outlook. It’s important to carry out independent research, review available information and seek guidance from a licensed financial adviser before making any investment decision. Past performance is not a reliable indicator of future results.
How can I trade Alphabet stock CFDs with Capital.com?
You can trade Alphabet (GOOG) as a contract for difference (CFD) on Capital.com’s platform, allowing you to speculate on price movements without owning the underlying asset. CFD trading enables long or short positions, but they are traded on margin – leverage amplifies both profits and losses.