US Non-Farm Payrolls Preview: Forecasters tip softer labour market conditions
US labour market conditions are expected to have softened in June. The latest Non-Farm Payrolls data will be released on Friday, July 5th, 2024.
US labour market conditions are expected to have softened in June. The latest Non-Farm Payrolls data will be released on Friday, July 5th, 2024.
Economists predict slower jobs growth, steady jobless rate
Economists’ consensus forecasts suggest US employment growth slowed in May, projecting an increase of 190,000 in Non-Farm payrolls. However, the unemployment rate is expected to remain steady at 4.0%, partially due to a forecast drop in the participation rate last month. Given the markets’ focus on inflationary pressures, the critical detail in the labour market report is the average hourly earnings figure. It’s tipped to return to 3.9% after a surprise jump last month to 4.1%.
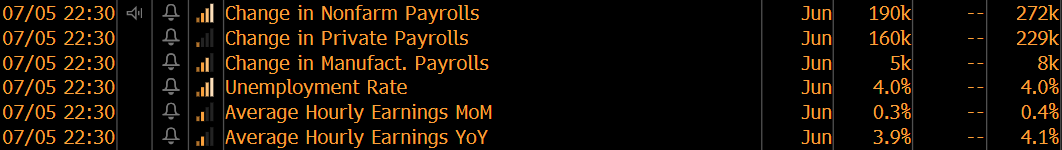
(Source: Bloomberg)
Looser labour market conditions signal easing inflation pressures
Employment trends point to gradual loosening in the US labour market. Although the month’s JOLTS Job Openings number for May surprised to the upside, the April figure was revised lower, with the directional trend in hiring clearly lower. The dynamic points to slack building in the jobs market and weaker demand in the broader economy, which, in principle, should support the US economy’s disinflationary trend in the economy. Coincidentally, last week’s Core PCE Index data for May showed inflation rose by the lowest rate since March 2021.
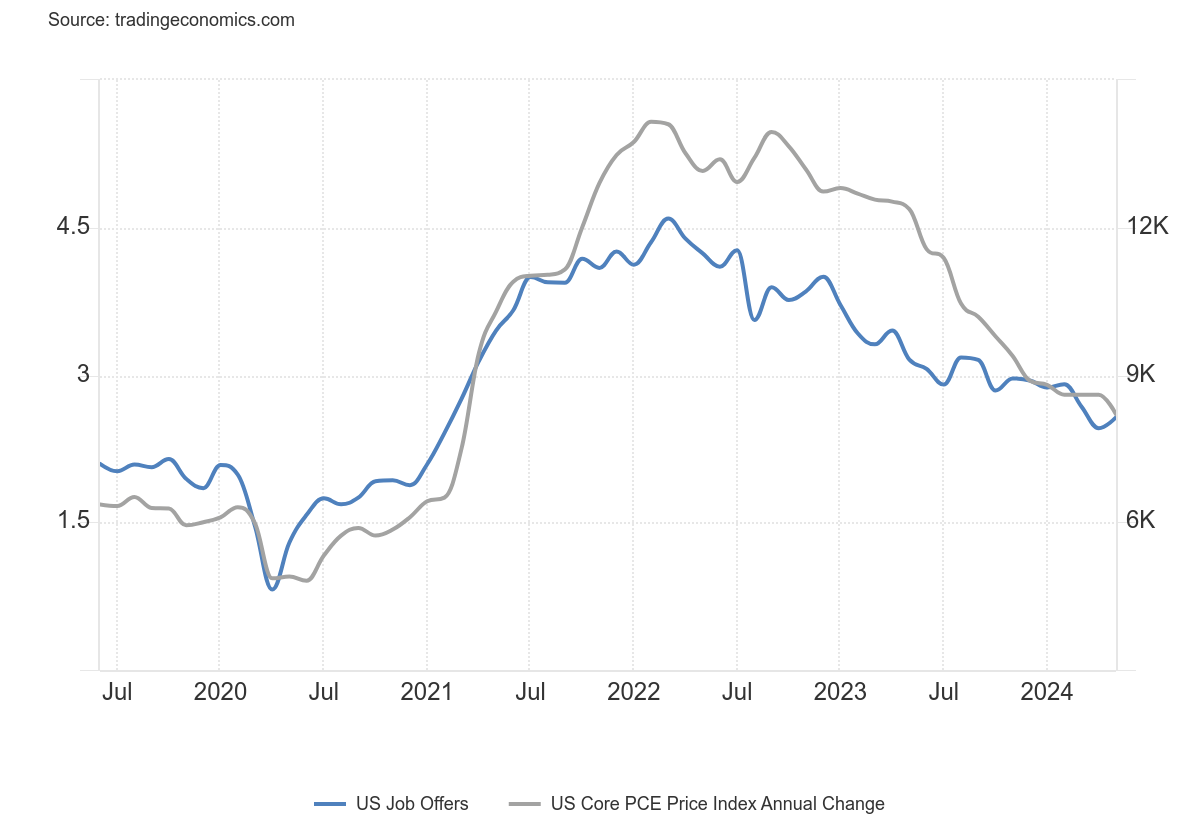
(Source: Trading Economics)
Markets remain focussed on the timing and number of Fed cuts in 2024
The market's primary consideration is the timing and number of rate cuts in 2024. One cut is fully baked into futures markets, with that cut completely priced-in for the November meeting. However, recent data and Fed commentary have raised the odds of a September cut, with the markets implying a 70% chance leading into the NFP release of that occurring. The markets are also edging toward a second cut in December, which is considered an approximately 80% probability.
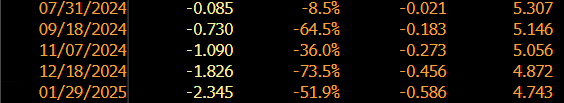
(Source: Bloomberg, 03/07/2024)
Market analysis: AUDUSD and NASDAQ
If the Non-Farm Payrolls data prints at expectations, it could provide risk-assets room to continue to trend higher. The most bullish scenario could be a bigger-than-expected drop in wage growth and an unemployment rate that modestly edges higher; such an outcome would likely see rates markets increase the odds of a September cut and two cuts by the end of 2024. Conversely, some combination of a lower unemployment rate, greater-than-expected employment increase, and unchanged annual wage growth could chill bullish sentiment and, subsequently, push back the expected timing of the first Fed cut and lower the probabilities of two cuts this year.
Currency markets could be noisy in the days before and after the NFP release, owing to other data releases and elections in the UK and France. The AUD/USD’s technicals point to consolidation and the potential for a break-out should the data reflect the bullish scenario. The pair has struggled to push through 0.6700; roughly 0.6580 is a possible level of technical support.
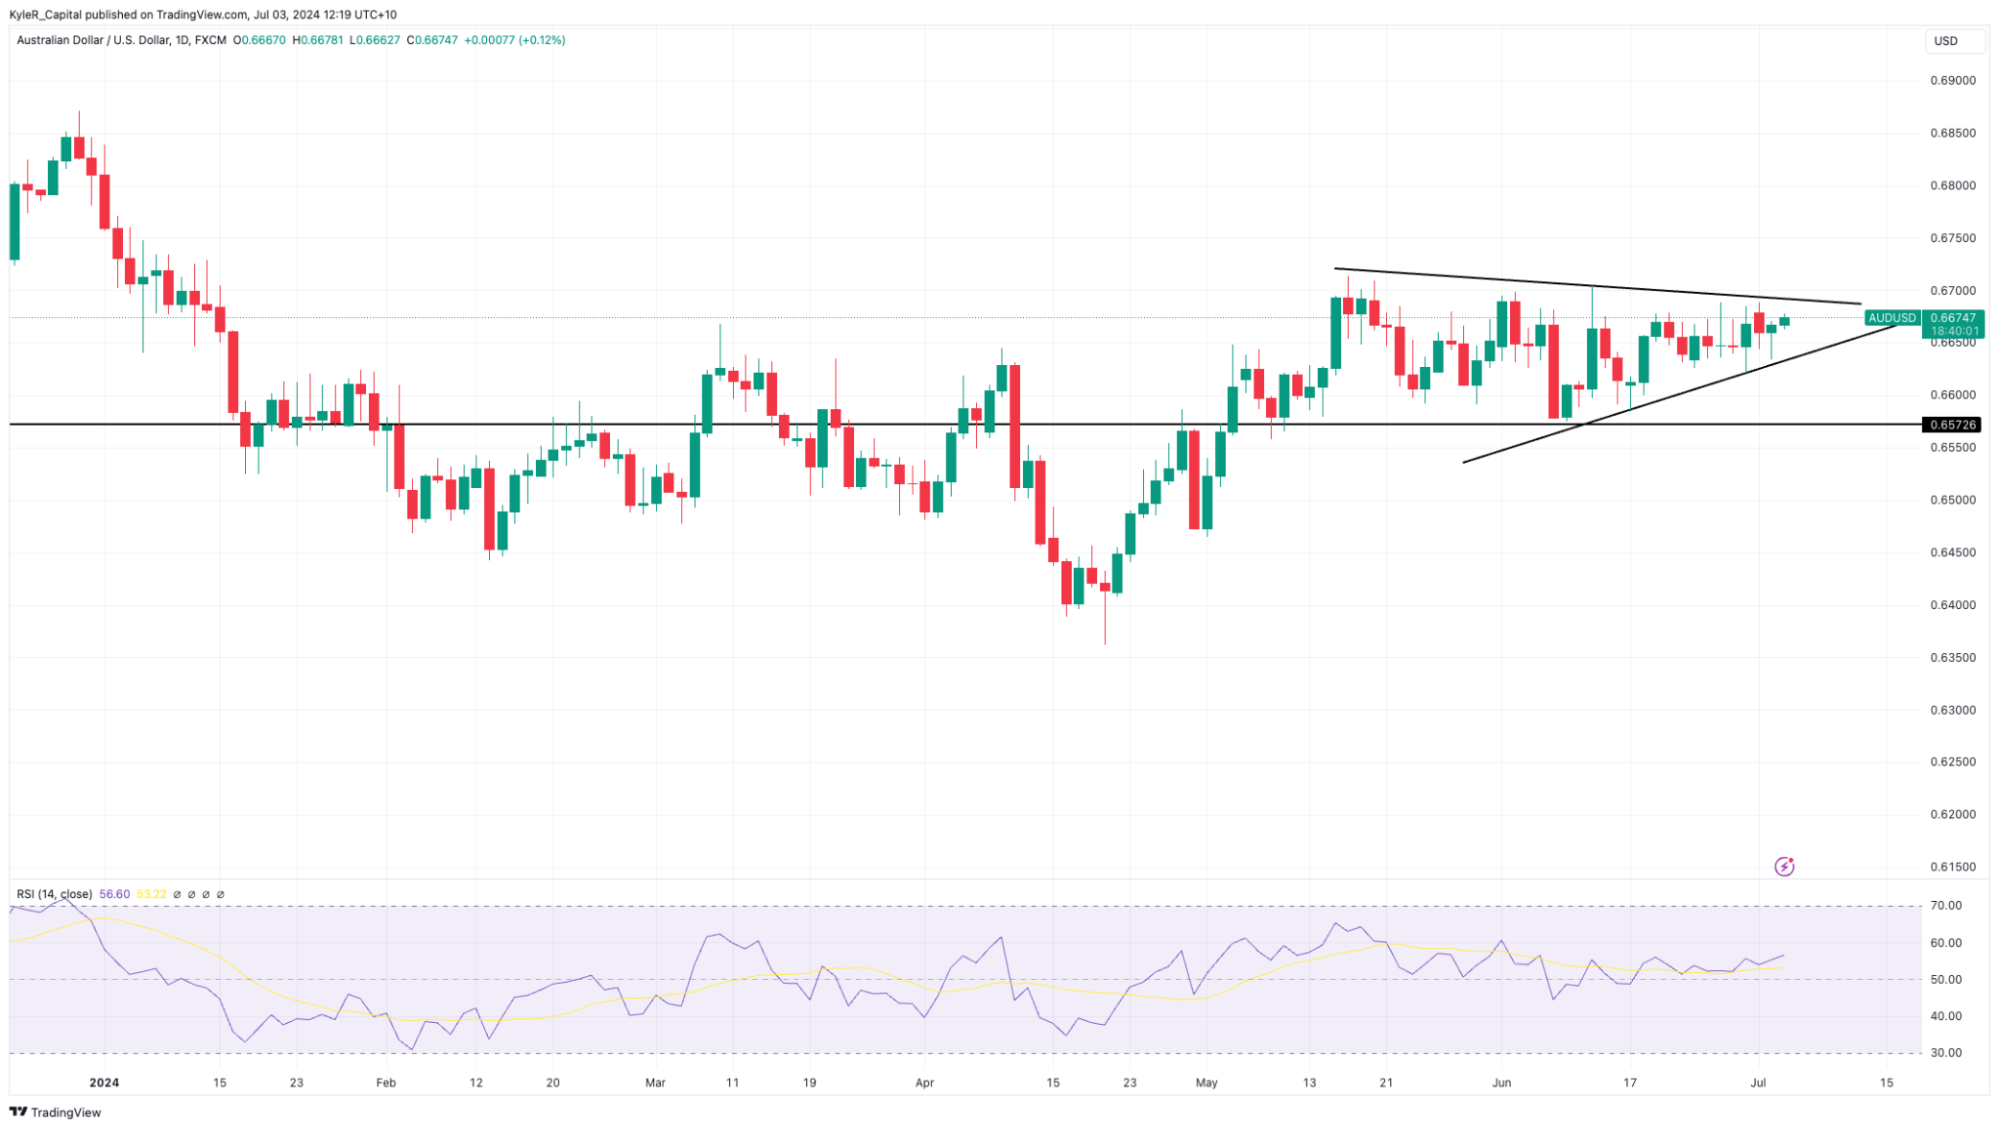
(Source: Trading View)
(Past performance is not a reliable indicator of future results)
US equities remain in a clear uptrend, especially tech stocks, which are outperforming amidst residual hype about artificial intelligence and the impacts on multiples from moderating interest rate expectations. The NASDAQ is testing resistance at a significant psychological level of 20,000. Trendline resistance appears around 20,800. Tentative upward-sloping trendline support is around 19,200.
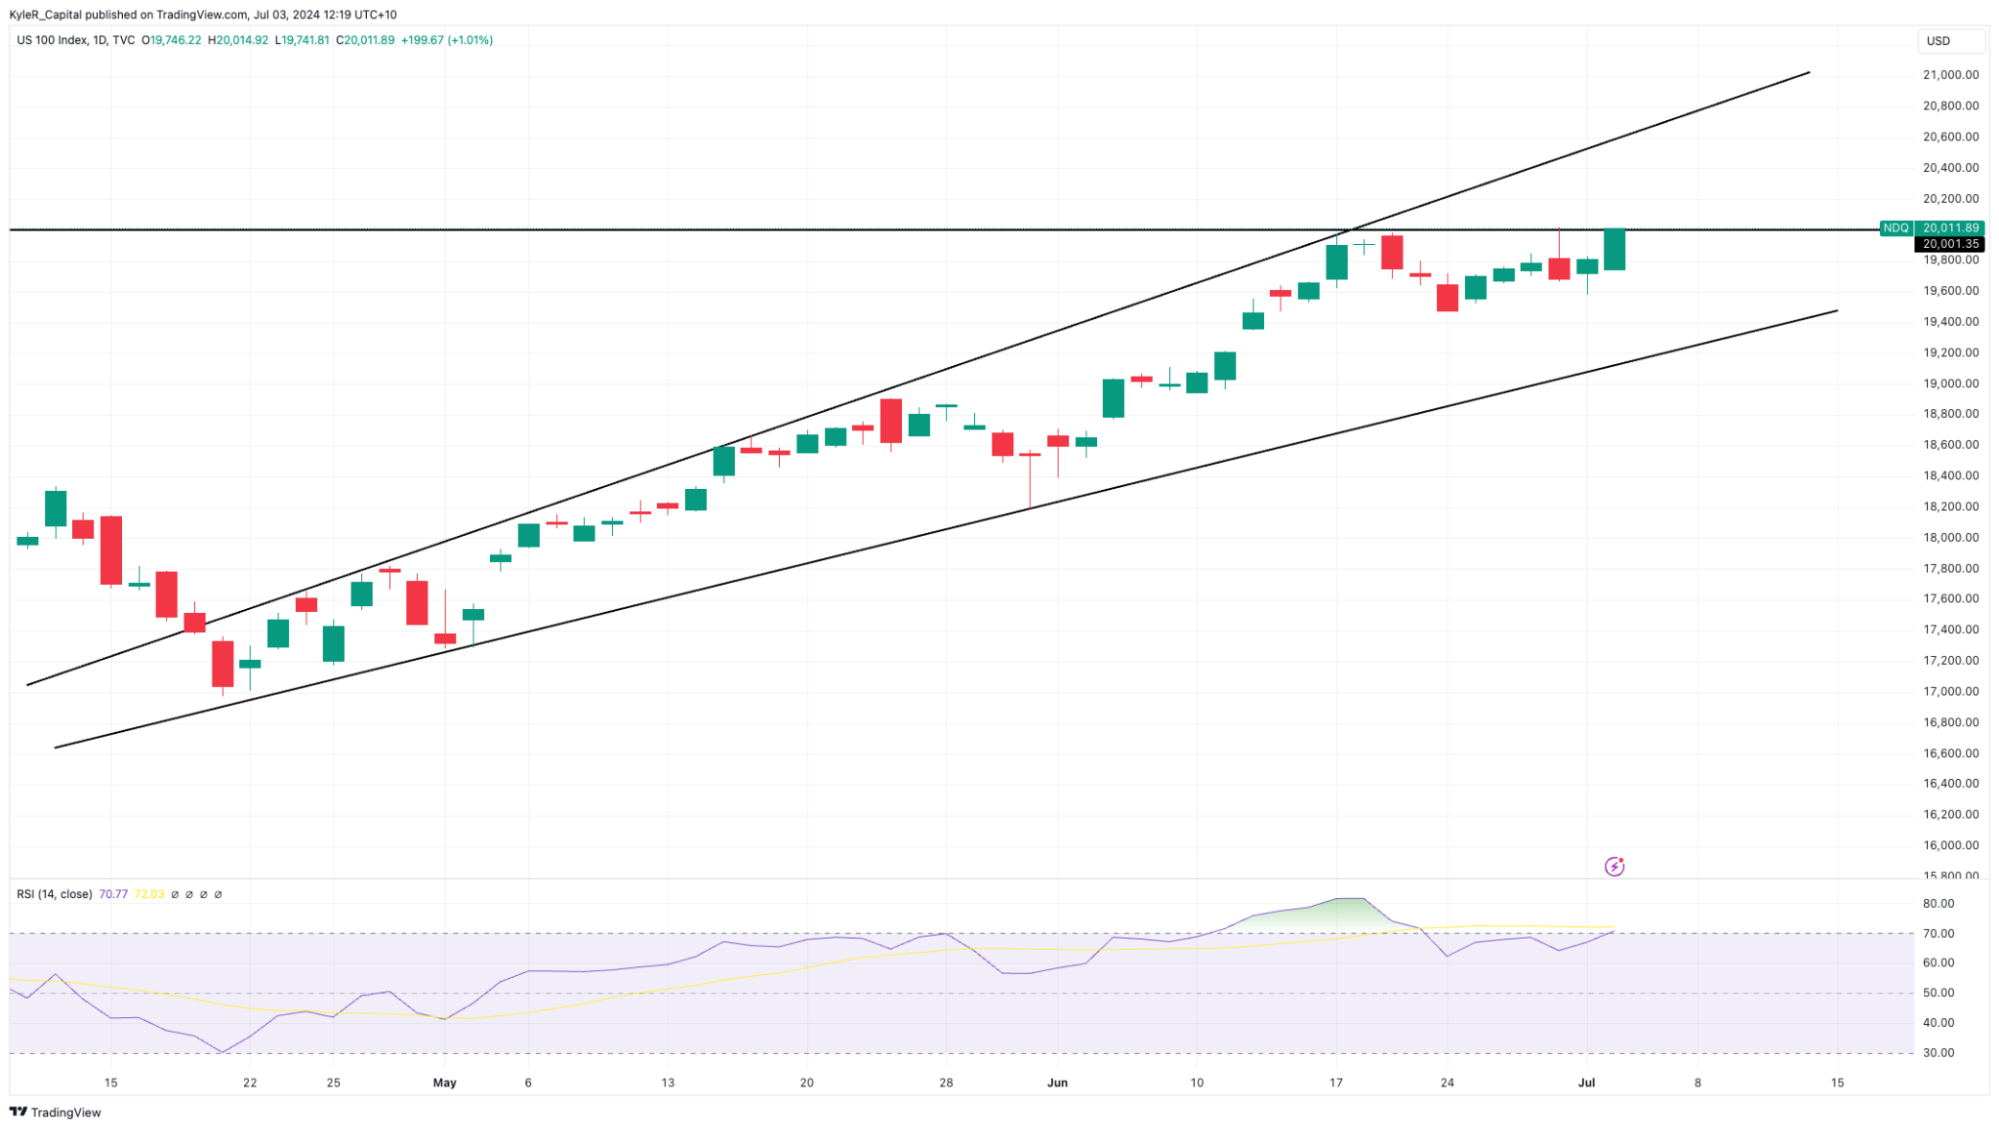
(Source: Trading View)
(Past performance is not a reliable indicator of future results)