What is a mountain chart?

Key takeaways
-
Mountain charts are line graphs with colored fill below the line, also called area charts, used to display investment growth and price behavior over time.
-
These charts appear frequently in fund reports and financial newspapers, transforming complex financial data into easily understood visual narratives with appealing bold colors.
-
Mountain charts can create optical illusions of exaggerated growth when y-axes don't start at zero or use logarithmic scales that minimize bear market appearances.
-
Stacked mountain charts layer multiple colored attributes to reveal both aggregate values and internal component dynamics like regional sales contributions within overall company performance.
-
Many traders find mountain charts less useful for active trading as they omit critical daily data like price ranges, gaps, and spikes needed for detailed analysis.
Searching for a mountain chart definition? A mountain chart is a financial chart or graph with peaks and dips, which makes it look like the side of a mountain.
Mountain charts are essentially the same as line charts, but with the space below the line filled in with colour. People also often refer to them as area charts.
Where have you heard about mountain charts?
You may have seen a mountain chart if you've read a fund prospectus or report. Like other types of charts, mountain charts are there to help you digest a wealth of financial or market information in a quick and appealing way. Corporate reports often feature them because their bold bright colours stand out and can tell an upbeat story.
Financial newspapers such as the Financial Times also often use mountain charts to accompany their analysis pieces. Again, the idea is to distil turgid figures and turn them into an easily understood narrative.

What you need to know about mountain charts…
Charts have been around for several hundred years. The Scottish engineer and political economist William Playfair (1759–1823) is generally viewed as the founder of graphical methods of statistics. He invented several types of diagrams: in 1786 the line, area and bar charts of economic data; and in 1801 the pie chart and circle graph.
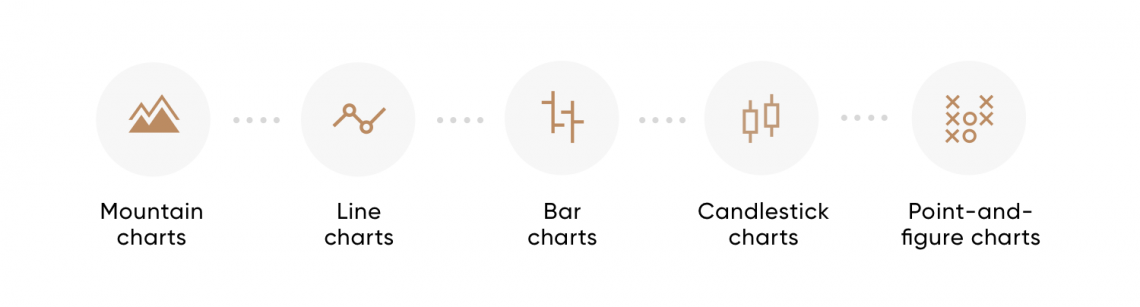
Investors and traders nowadays use five main types of charts in their technical analysis, depending on what kind of information they’re examining. Mountain charts, line charts, bar charts, candlestick charts and so-called point-and-figure charts are all part of the armoury they can deploy to analyse trading data.
Uses and types of mountain charts
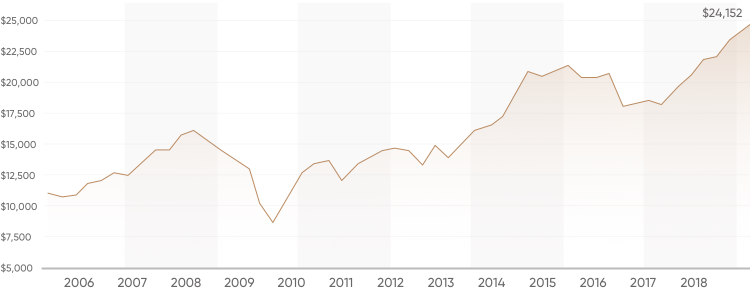
Mountain charts have several key uses. Firstly, they can depict the growth of an investment over time - they are a common way to showcase a fund's past performance. Here’s an example that shows both the overall trend and the depth of periodic dips very clearly:
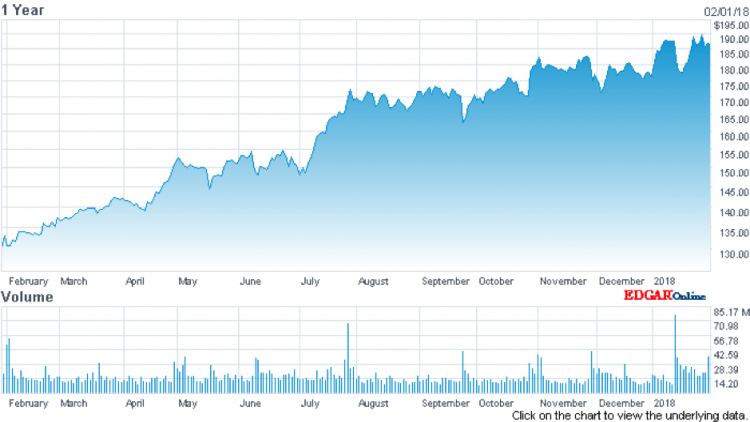
Secondly, mountain charts can be used as a trading instrument chart for price behaviour analysis. Here’s an example showing the fluctuations in Facebook’s share price over the course of a year. It’s interesting how different the visual representation is from the bar chart of volumes underneath.
 So mountain charts can be a useful way to grasp a lot of information over a long period quickly. But they should be viewed carefully as they can give an optical illusion of greater growth than the reality.
Here’s an example of a basic mountain chart:
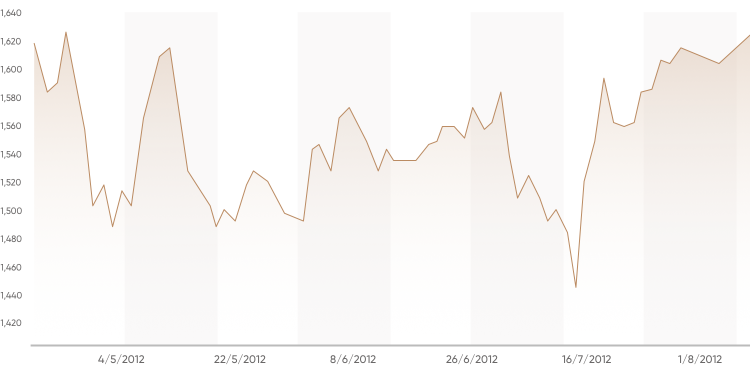
Mountain charts display graphically quantitative data. But, as you can see in the example above, if the y-axis (the vertical one) doesn’t start at zero, the chart runs the risk of over-dramatizing peaks and troughs. This is particularly the case if you chose a narrow timeframe to view the chart. A long-term investor might therefore do better to change the parameters to a yearly or even 5-yearly view to gain a better insight into the relevance of day-to-day share price fluctuations.
When multiple attributes are included in a mountain chart, the first attribute is plotted by a line with colour fill, followed by the second underneath with a different colour, and then the third and so on. This is known as a stacked mountain chart – or stacked area chart.
Here’s an example:
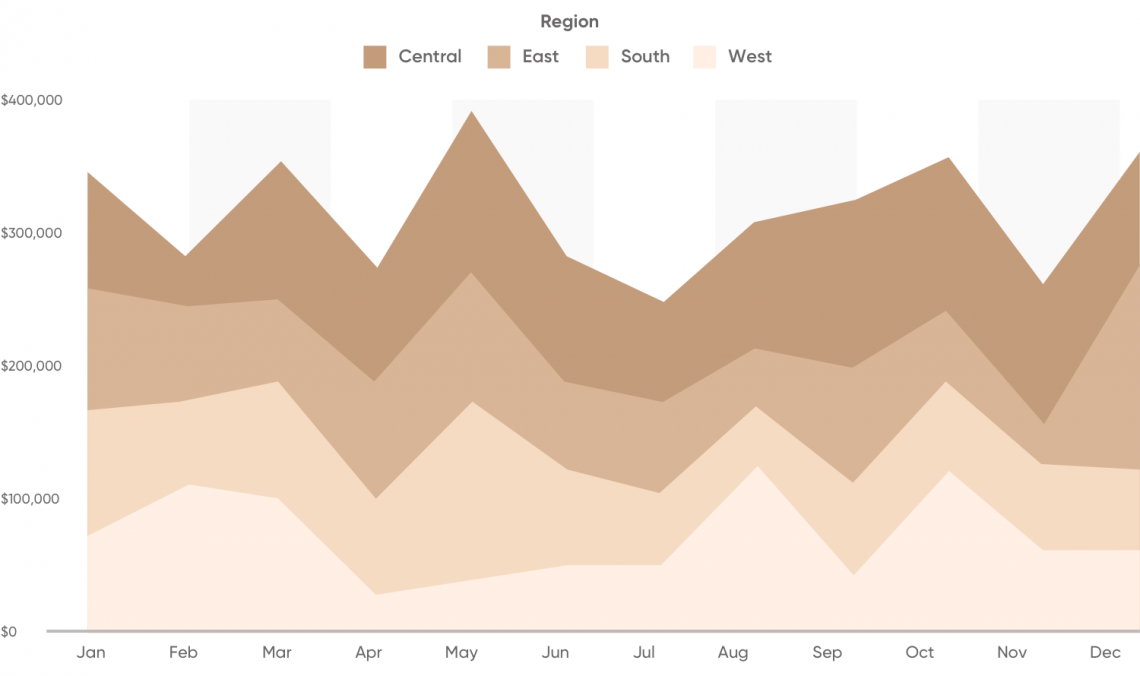
This type of stacked mountain chart can be useful for understanding both fluctuations in aggregate values (a company’s total sales over a given period, for example) and the dynamics within an organisation (sales recorded in a company’s various regions or divisions). In the above example, the company’s overall sales end the year very slightly above their January level, but Central’s contribution to the total halved between September and December. This might not have been immediately apparent by simply looking at a table of figures.
Chart patterns
Knowing how to interpret a chart pattern can be very useful when conducting technical analysis of stocks. Here are some of the chart patterns you’ll most often encounter in mountain charts:
- The Double Top Reversal. This is a bearish reversal pattern made up of two consecutive peaks that are approximately equal, with a moderate trough between them. A classic Double Top Reversal marks an intermediate change in trend from bullish to bearish.
- The Double Bottom Reversal. This is a bullish reversal pattern made up of two consecutive troughs that are roughly equal, with a moderate peak in between. A classic Double Bottom Reversal usually marks an intermediate or long-term change in trend.
- The Rounding Bottom. This is a long-term reversal pattern, also also referred to as a saucer bottom. It represents a long consolidation period that turns from a bearish bias to a bullish bias.
- The ascending triangle. This is a bullish formation that usually forms during an uptrend as a continuation pattern. Two or more equal highs form a horizontal line at the top, and two or more rising troughs form an ascending trend line that converges on the horizontal line as it rises.
- The Bearish Measured Move. This pattern consists of a reversal decline, consolidation/retracement and continuation decline. Because a Bearish Measured Move can’t be confirmed until after the consolidation/retracement period, it’s categorised as a continuation pattern. The pattern usually forms over several months.
Disadvantages of mountain charts
Mountain charts sometimes use a logarithmic scale, meaning that the y-axis (the vertical one) shows exponential growth rather than arithmetic growth. So, for example, the tick marks along the y-axis might be set at £10, £100, £1,000, and £10,000 rather than at £1,000, £2,000, £3,000, and £4,000. One result of using this kind of scale is that it makes bear markets look less daunting than they really are.
Another issue is that if the graph is plotted with currency, such as the pound, rather than a percentage, it will look like it has a steeper angle of growth than it really does. This is because of compound interest, which is a strong benefit to any long-term investor. Compound interest is essentially interest on top of interest, which, although it looks impressive, isn't an indicator of performance.
Like all historical data for any fund, mountain charts will only give you information on past performance, which is no indicator of future success. Moreover, mountain charts omit significant data of importance because you can’t view the range of prices each day, and you can’t identify gaps or spikes. Because of this, many traders don’t find mountain charts useful for trading, but they are certainly considered helpful for general price representations in reports.
Find out more about mountain charts…
Our comprehensive online glossary has lots more definitions of related terms such as chart, bar chart, candle chart and trend. Take a look at some of them to deepen your understanding of chart patterns and market data.
If you’re using Excel to create charts using your own data, this guide at Excel-easy.com will show you how to make mountain charts – referred to here as area charts – and ‘stacked’ mountain charts.
Nasdaq.com has a range of interactive stock charts, which – it says – offer a dynamic alternative to basic stock charts. Features include click and drag interaction, event indicators, and right-click interactivity. Nasdaq’s default chart is the 1 year Mountain chart for an individual stock. The intervals (aside from the Intraday) are for 1 day, 5 days, 1 month, 3 months, 6 months, 2 years and 5 years. Follow this link to their website for further details.