Indian rupee forecast: INR freefall and RBI intervention
What lies ahead for India’s official currency in 2023 and beyond?
The Indian rupee (INR) price pulled back from its highest point in 2022 as the focus shifted to the potential Fed pivot this year. It dropped as the US dollar index continued plunging to the lowest level in months. The US dollar (USD) to INR exchange rate plunged to a low of 80.85 on 20th January, the lowest level since November 14.
Indian Rupee started 2023 strong, in terms of the dollar as the DXY Index fell to a 6-month low of 100.8. However, once the January CPI data was released, the dollar strength index rebounded strongly from these lows. This weakened the global currencies in terms of their dollar value. USD/INR was also got affected and started to surge once again.
In February, the Reserve Bank of India (RBI) hiked its key repo rate by a quarter percentage point, this was expected but still surprised markets by leaving the door open to more tightening, saying core inflation remained high.
The central bank said that its policy stance remains focused on the withdrawal of accommodation, with four out of six members voting in favour of that position.
Some analysts expect the hike to be the final increase in the RBI's current tightening cycle, which has seen it raise rates by 250 bps since May 2022 – as major central banks across the world continue to battle high inflation. Since May, the RBI’s rate-setting panel has raised the country’s repo rate by 1.9% to 6.50%.
RBI Governor Shaktikanta Das said:
Here we look in more detail at what has been driving the rupee price and where it may go next.
How did the Indian rupee performed in 2022?
The rupee declined over 11% in 2022, as it struggled against global developments.
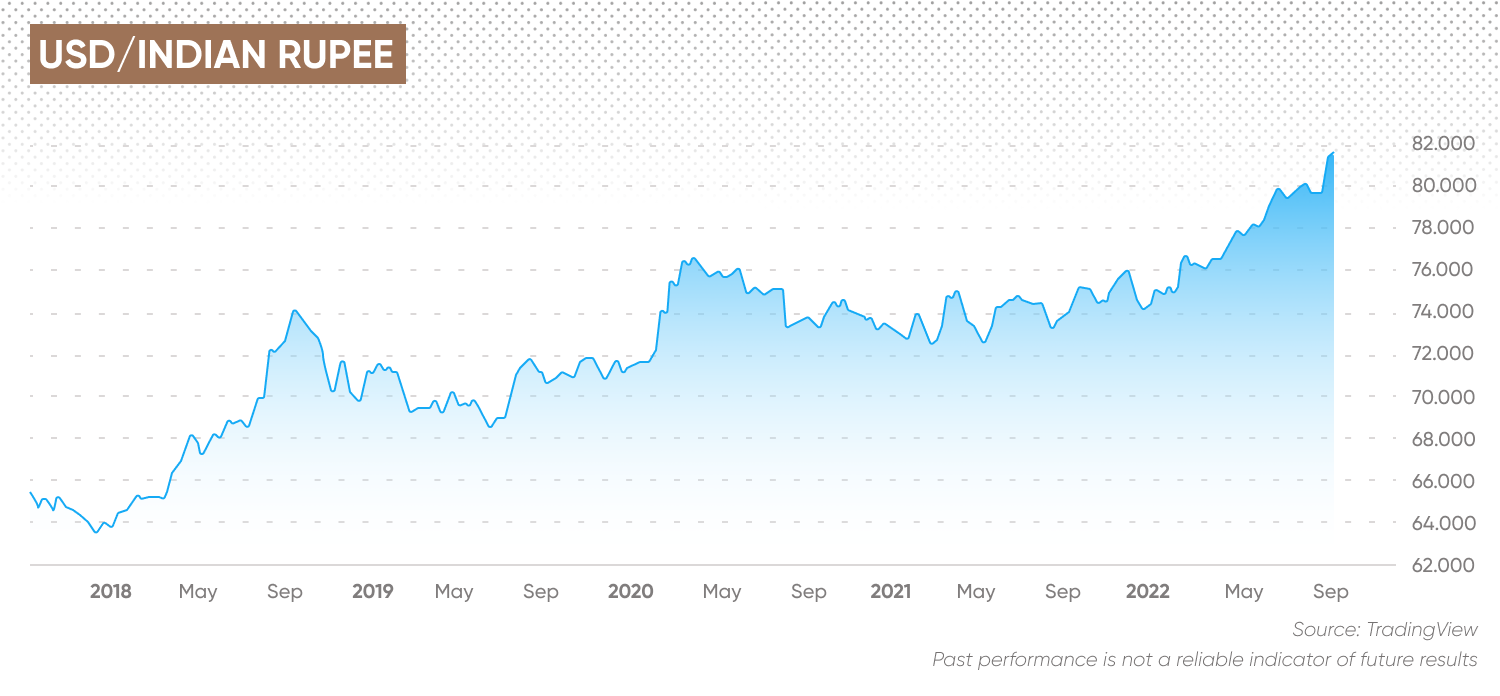
The rupee started the year at 74.40 against the dollar and steadily weakened. The USD/INR pair climbed higher across the year, with the rupee reaching its first all-time low of 80.20 on 14 July. The USD/INR price then eased lower to 78.13 before another ascent to retest the all-time low once more in August.
The rupee continued to slide in the face of tightening monetary policy in the US, coming in at a dramatic all-time low (82.77) against the dollar on 20 October. That said, the rupee’s 8.5% decline against the greenback since January matched up with the weakness experienced by most dollar-paired currencies.
Krishnamurthy Subramanian, former chief economic advisor (CEA) to the Indian government, tweeted in late September:
Learn more about biases in trading with our trading psychology pages.
“While the rupee has depreciated 8% year-to-date, the dollar index has appreciated 18.8% over the same period,” the former CEA added.
Anuj Choudhary, a research analyst at BNP Paribas, told the Times of India: “We expect rupee to trade on a negative note as deteriorating global risk sentiments may put downside pressure on rupee. Weak global markets may lead safe haven flows towards US dollar. However, sharp fall in crude oil prices may prevent sharp downside in rupee.”
What is the Indian rupee?
The Indian rupee is the official currency of India and is issued by the Reserve Bank of India (RBI). In 1947 it replaced the currencies of the previously autonomous states, becoming the national currency.
The rupee was pegged to the pound due to its historic links to Britain. Due to the decline in the share of trade with Britain and the increased diversification of India’s international transactions, the rupee was delinked from the pound in September 1975. The currency is now a free-floated exchange rate influenced by supply and demand.
The RBI’s exchange rate policy ensures orderly conditions in the foreign exchange market. Therefore, it monitors movements in the currency and financial markets closely. When necessary, it intervenes in buying or selling foreign currency to support the rupee’s price stability.
What moves the rupee?
There is no single factor that drives the value of the Indian rupee, but several factors combine to influence its movement. But the USD, current deficit in India, forex reserves and domestic macro-economic developments will determine how the rupee perfroms in 2023.
Radhika Rao, Executive Director & Senior Economist at DBS Bank:
Interest rates in India
Interest rates influence a currency’s value. When interest rates are hiked, demand to invest in the country increases, which lifts demand for the currency. Higher interest rates are often synonymous with a strong rupee.
Similarly, when interest rates are cut, investors often look to withdraw from investments in that country and search for higher interest rates elsewhere. A lower interest rate is often synonymous with a weaker rupee.
Indian economic data, including PMIs, inflation and GDP
The RBI will look at macroeconomic data points to decide the appropriate monetary policy action. High inflation, strong growth and/or an improving labour market encourage the RBI to hike interest rates.
Meanwhile, a contracting economy, low or falling inflation and/or a deteriorating jobs market could prompt the RBI to cut interest rates.
Foreign exchange reserves
Substantial foreign exchange reserves act as a buffer against factors that could negatively impact the country’s economy. Reserves help maintain a steady exchange rate through buying and selling, depending on whether the central bank is looking to raise or lower the exchange rate.
The RBI intervenes in the market to steady the USD/INR exchange rate.
Oil prices
India imports around 80% of its oil requirements, which means the economy is particularly vulnerable to fluctuations in oil prices. Rising oil prices are bad news for the net importer of oil, widening the trade deficit and weighing on the value of the rupee. Meanwhile, falling oil prices are considered beneficial for India’s economy.
FII flows into equities
In recent years, foreign institutional investor (FII) and foreign direct investment (FDI) flows have become increasingly important in determining the value of the Indian rupee.
Strong FII and FDI flow into India often strengthen the INR. This is because the flows into Indian equity and debt require foreign exchange inflows into India. Meanwhile, FII and FDI outflows can weaken the rupee.
US dollar value
The value of the Indian rupee is expressed in relation to another currency. For example, USD/INR is the value of the rupee against the US dollar. Therefore, the value of the other currency, the USD, is also important.
When the US dollar index (DXY), which measures the USD against a basket of major peers, rises, the INR will often fall in value. The chart below highlights this relationship.

Historical moves in the Indian rupee
The Indian rupee was trading at 43.35 at the start of the year 2000. It has lost around 84% of its value against the dollar in the past 22 years. That said, the notable devaluation of the rupee actually started in 2011.
In September 2011, the USD/INR pair traded at 45.70. Over the next decade, the price of the dollar rose, resulting in the rupee hitting 73.00 against the dollar by September 2021. As of 2 December 2022, one USD was changing hands at 81.410 INR.
Recent Indian rupee action
On 5 April, the INR rose aganist the USD, amid weakness in the American currency. The rupee was at 82.045 to the dollar and reached an intraday high of 82.253.
Inflation picked up speed in January as the Personal Consumption Expenditures price index rose 5.4% from a year earlier, according to the Commerce Department's Bureau of Economic Analysis reported. The Fed's preferred inflation gauge showed an uptick in inflation, despite expectations that it would decrease and come in at 4.9%.
The core PCE inflation also came out higher than expected and remained at 4.7% in January 2023. The same figure stood at 4.6% in December.
However, after an increase in inflation in the first month of the year, the February CPI data showed decreasing inflation. The February CPI report, which was released on 14th March, met expectations as the Year-on-Year (YoY) inflation came in at 6%. The core CPI inflation also came in line with the expectations of 5.5% on a YoY basis.
For 2023, the US Dollar to Indian Rupee exchange rate often shows a very strong correlation to the DXY index chart. There has been a strong rebound in the dollar strength index since the start of this year. This has caused a surge in USD/INR as the investors hold the greenback over other foreign currency.
In 2022, the INR has consistently hit record lows against the dollar. The currency battled against the USD’s strength as the value of the world’s reserve currency rose to a 20-year high of 112 earlier this year, but has since subsided. The DXY, which measures the value of the USD against a basket of major peers, has rapidly risen as the market priced in a more hawkish US Federal Reserve (Fed).
The Fed’s inflation gauge, the core personal consumption expenditures price index, slowed for the fourth month in a row to 7.7% in October 2022 – the lowest since January – and below market forecasts of 8%. The latest reading compares with 8.2% in September.
India’s retail inflation, which is measured by the Consumer Price Index (CPI), eased to a three-month low of 6.77% in October 2022, according to data released by the Ministry of Statistics & Programme Implementation (MoSPI). Retail inflation for September came in at 7.41%.
The RBI has intervened on several occasions, selling the rupee to defend the psychological level of 80.00 against the USD, and raising the RBI’s bank rate by 50 basis points in its most recent decision.
While foreign investor outflows have dominated across the year, the beginning of Q3 2022 showed more promise. Despite volatility in the INR, August marked the first month when foreign investors were net buyers of government debt.
Furthermore, Indian domestic equities have seen a return of foreign investors as inflows reached $6bn in August, a new 18-month high.
The Indian economy remains strong, expanding by 6.3% in the third quarter, slightly higher than market expectations of 6.2%, and extending the country’s growth momentum to eight straight quarters.
Broadly speaking, growth in Europe has been stifled by Russia’s invasion of Ukraine and rising energy prices, while lockdowns in China have seriously limited the nation’s manufacturing capabilities.
The Indian central bank raised interest rates in May for the first time in two years, hiking the rate by 40 basis points to 4.4%. Since then, the RBI has raised rates by a further 100 basis points, and again on 30 September by 50 basis points. The current bank rate is 5.9%.
According to a statement made by Governor Shaktikanta Das: “Monetary policy had moved from neutral to accommodative stance in June 2019. At that time, the repo rate was 5.75%; headline CPI inflation was hovering around 3%.”
“Today, inflation is hovering around 7% and we expect it to remain elevated at around 6% in the second half of 2022 and 2023.”
“The average CPI in India for FY24 is expected in the band of 5.00-5.25 percent. We expect 35 basis points hike in the December policy, along with change in monetary policy stance from ‘withdrawal of accommodation’ to ‘neutral’ indicating further action to be data dependent. Post this hike, the overnight rates in India would have increased by approx. 300 basis points during CY22,” Deepak Agarwal, a fund manager at Kotak Mahindra Asset Management Co, told Forbes India.
Should the RBI look to ease its pace of tightening rates while the Fed remains aggressive, the USD/INR could rise further on central bank divergence.
Separately, foreign exchange reserves have been declining slowly since September 2021. However, India’s import coverage of eight months is well ahead of the three-year import coverage benchmark.

The latest USD/INR forecast for 2023 and beyond
Analysts at Dutch lender ING Group, in their USD/INR forecast for 2023, expected the USD/INR currency pair to rise to an average of 84 by Q1 2023, and then gradually fall to trade at 82.00 by Q3 2023. Looking ahead, they expected the rupee to continue trading in the 80-82 INR range against the USD to 79.50 for the duration of 2024.
According to analysts at TradingEconomics as of 2 December 2022, the Indian rupee was expected to continue weakening. Its USD/INR forecast predicted that the pair could be at 82.40 by the end of the current quarter and continue weakening to 84.57 in a year’s time – by December 2023.
Algorithm-based forecaster Wallet Investor predicted that the rupee could weaken from its current level over the course of the following year. The site’s USD/INR forecast predicted that the pair would end 2023 at 83.680.
Over the longer term, Wallet Investor’s USD/INR forecast for 2025 saw the rupee further weakening against the dollar, rising to 88.276 by the end of the year.
Analysts at Investing Cube said:
Meanwhile, algorithmic forecaster AI Pickup’s USD/INR prediction for 2027 saw the rupee strengthen to 74.97. Interestingly, the website said that after hitting a record low of 84.35 in 2024, the rupee could stage a recovery. The service’s USD/INR forecast for 2030 was 72.6.
Investing Cube said a reasonable prediction for USD to INR forecast for 2030 will be for the pair to remain within a range for several years.
It is important to remember that analysts’ and algorithm-based Indian rupee forecasts can be wrong. Always conduct your own due diligence before trading, looking at the latest news, technical and fundamental analysis, and analyst commentary.
Bear in mind that past performance does not guarantee future returns, and never trade any money that you cannot afford to lose.
Stay up to date with the major forex pairs using our currency strength meter.
FAQs
Why has the Indian rupee been dropping?
The rise in the USD/INR rate over the course of 2022 has been due to a combination of factors, including the stronger USD, increasing inflation, and higher interest rates, in addition to the exodus of overseas investors from Indian markets. High oil prices have also played a part in the decline of the rupee.
Will INR go up or down?
According to the algorithm-based site Wallet Investor, the Indian rupee is expected to weaken versus the USD. The USD/INR will likely rise over the near term and the longer term.
However, algorithm-based forecast platforms and analysts can get their predictions wrong. Always do your research to reach your conclusions as to how you think a currency pair or other financial instruments could move. Forecasts do not take into account future market conditions.
When is the best time to trade INR?
The best time to trade the USD/INR pair is Monday to Friday, from 9am to 5pm IST (UTC+5).
Is INR a buy, sell or hold?
In order to decide whether INR is a buy, hold, or sell, you should conduct your own research considering India’s economic outlook, central bank action, and how the USD is moving.
Always conduct your own due diligence before trading, looking at the latest news, technical and fundamental analysis, and analyst commentary. Bear in mind that past performance does not guarantee future returns, and never trade money that you cannot afford to lose.