Gold forecast: Third-party price targets
Gold (XAU/USD) is currently trading at $3,982.94 (as of 6:12pm UTC, 7 October 2025), after briefly crossing $4,000 per ounce for the first time during the session.
Spot prices touched an intraday high of $3,986.52 and remained above the day’s low of $3,888.20.
The record-setting movement reflects several overlapping drivers. The US government shutdown entered its seventh day with no resolution reported (Reuters, 7 October 2025), while safe-haven demand strengthened amid a 10% year-to-date decline in the US Dollar Index to around 98.4 (Trading Economics, 7 October 2025).
Gold price forecast: Analyst price target view
Goldman Sachs (house view)
Goldman Sachs has raised its December 2026 gold price forecast to $4,900 per ounce, up from $4,300, as of 6 October 2025. The bank attributes the revision to continued Western exchange-traded fund inflows and expected central bank purchases. It notes that risks to this projection remain skewed to the upside, given ongoing private sector diversification into the relatively limited gold market, with central banks anticipated to buy around 80 tonnes in 2025 and 70 tonnes in 2026 (Reuters, 7 October 2025).
JPMorgan Chase (global commodities strategy)
JPMorgan forecasts gold to average $3,675 per ounce in the final quarter of 2025, increasing to around $4,000 by the second quarter of 2026. Its outlook highlights gold’s function as a potential hedge against stagflation, recession, currency debasement and US policy uncertainty, supported by steady investor and central bank demand projected to average about 710 tonnes per quarter (J.P. Morgan, 10 June 2025).
UBS (wealth management outlook)
UBS expects gold to reach $4,200 per ounce by mid-2026, revised from previous estimates of $3,800 by end-2025 and $3,900 by mid-2026. The Swiss bank cites anticipated Federal Reserve easing, a weaker US dollar linked to rate cuts, and continued geopolitical risks sustaining safe-haven interest (Discovery Alert, 30 September 2025).
LBMA (annual precious metals survey)
The London Bullion Market Association’s mid-year review of 13 analysts raised 2025 forecasts to an average of $3,159 per ounce, up from $2,735 in January 2025. The average end-year forecast now stands at $3,324 per ounce, with the highest at $4,000, as analysts point to US monetary policy, fiscal deficit concerns and dollar weakness as the main drivers (LBMA, 14 July 2025).
Forecasts and market projections are inherently uncertain and subject to change. They do not account for unexpected economic or geopolitical developments. Past performance is not a reliable indicator of future outcomes.
Gold price: Technical overview
On the daily chart, gold (XAU/USD) is trading at $3,982.94 as of 6:12 pm UTC on 7 October 2025, and continues to hold above a key cluster of moving averages – the 20-, 50-, 100- and 200-day averages at approximately $3,764, $3,551, $3,447 and $3,219 respectively. The 20-over-50 configuration remains in place, indicating an established upward trend.
Momentum appears extended, with the 14-day Relative Strength Index (RSI) at 85, while the Average Directional Index (ADX) at 53 suggests a strong trend.
The first resistance area lies near the $4,008 pivot, and a daily close above this level may bring the $4,158 zone into focus. On retracements, initial support is observed around $3,722, followed by the $3,447 moving average shelf; a sustained move below this could open the way towards $3,219 (TradingView, 7 October 2025).
This analysis is provided for informational purposes only and does not constitute financial advice or a recommendation to buy or sell any instrument.
Gold price history
Gold’s spot price closed at about $3,981 on 7 October 2025, near an all-time high for the period. The metal hit a two-year low of around $1,847 in October 2023 before rising steadily through 2024, ending the year above $2,600.
In early 2025, momentum strengthened further, with prices moving past $3,000 in April and exceeding $3,900 by October.
Past performance is not a reliable indicator of future results. Share prices are indicative and may differ from live market prices.
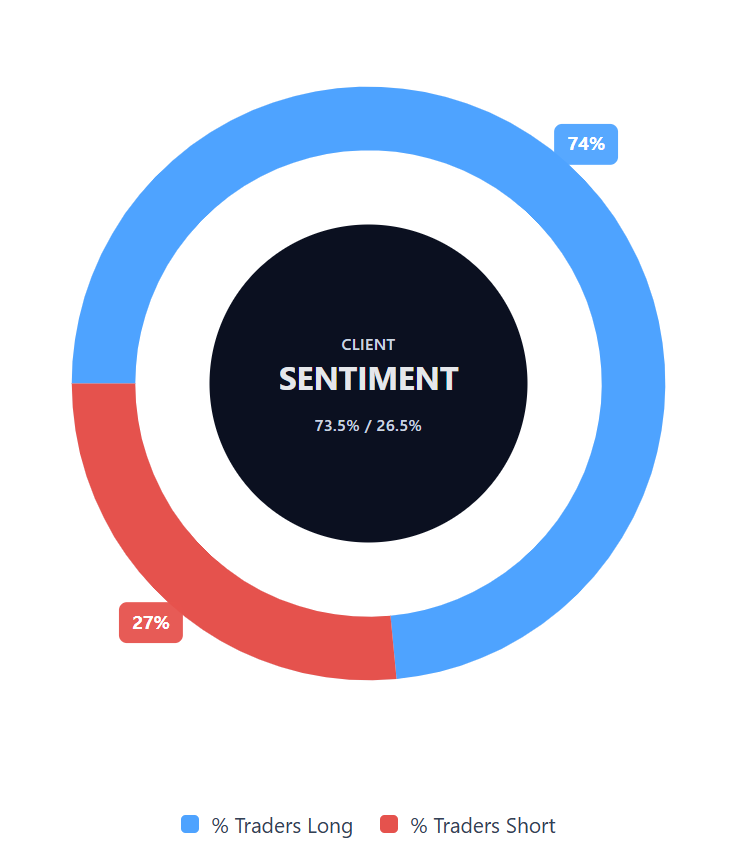
Capital.com’s client sentiment for gold CFDs
Buyers represent 73.5% of open gold CFD positions, compared with sellers at 26.5%, indicating a notable buy-side bias of 47.0 percentage points (7 October 2025). This snapshot reflects current open positions on Capital.com and is subject to change over time.
FAQ
Is gold a good CFD to buy?
Trading gold CFDs offers exposure to price movements without ownership of the physical metal. Contracts for difference (CFDs) allow traders to speculate on both rising and falling prices, using leverage to control larger positions with smaller deposits. However, CFDs are traded on margin, and leverage can amplify both profits and losses. It’s important to understand how CFDs work and apply appropriate risk management before trading.
Could gold go up or down?
Gold prices can fluctuate in either direction due to a range of factors, including monetary policy, interest rates, inflation trends, and geopolitical developments. A weaker US dollar or heightened safe-haven demand may support prices, while tighter monetary policy or reduced market uncertainty could weigh on them. As with all markets, gold remains subject to volatility and change.
Should I invest in gold?
Whether to trade or invest in gold depends on your financial objectives, experience and risk tolerance. Gold is sometimes regarded as a diversification tool that can help balance a broader portfolio. However, prices can move sharply, and past performance should not be considered a reliable guide to future results. Always assess your personal circumstances before trading or investing.
How does trading gold CFDs work?
When trading gold CFDs, you enter a contract based on the difference between the opening and closing price of a position. This allows traders to speculate on gold’s price direction – going long if expecting a rise, or short if expecting a fall. CFD trading does not involve ownership of the underlying asset, and leverage can amplify both potential profits and losses.
What are the risks of trading gold CFDs?
CFD trading carries high risk due to market volatility and margin. While leverage can increase potential gains, it can also magnify losses. Market movements can be unpredictable, and prices may shift rapidly against open positions. It’s essential to use built-in risk management tools such as stop-loss orders, and to ensure you understand the associated risks before trading. Stop-loss orders are not guaranteed. Guaranteed stop-loss orders incur a fee if activated.