What is fundamental analysis?

Fundamental analysis is a thorough process of assessing the intrinsic value of a security such as a stock or currency, with the aim of discovering whether that security is undervalued or overvalued from an investor’s point of view. Any factor that can impact on a security’s value is scrutinised and evaluated by fundamental analysts. These can be macroeconomic factors such as the state of the economy and industry in general, or microeconomic factors such as corporate governance and financial conditions.
Key takeaways
-
Fundamental analysis assesses a security's intrinsic value by examining macroeconomic and microeconomic factors to identify whether investments like stocks or currencies are undervalued or overvalued.
-
Investors use top-down approaches starting with economic trends or bottom-up approaches beginning with company details, combining quantitative metrics and qualitative factors like management quality and competitive advantages.
-
Key quantitative tools include earnings per share, price-to-earnings ratio, dividend yield, return on equity, and book value derived from analyzing financial statements showing cash flows, assets, and liabilities.
-
Unlike technical analysis which uses price charts and market momentum, fundamental analysis focuses on long-term value and underlying business health, famously employed by billionaire investor Warren Buffett.
-
While fundamental analysis reveals true asset value and competitive positioning, it is time-consuming, sector-specific, vulnerable to human optimism, and risks analyzing information already priced into markets.
Where have you heard about fundamental analysis?
Traders use the term when they analyse a company's financial results, management performance and other economic data to see if there’s an investment opportunity.
What you need to know about fundamental analysis
Ultimately, a fundamental analysis definition simply put is that it is a way to try to predict a company's future share price. The method looks beyond a company's share price to measure its true financial health. Revenues, earnings and profit growth are some of the key numbers investors may scrutinise. Outside economic information about the company's industry or country might be looked at too. This analysis strategy is championed by respected investor and businessman Warren Buffett.
The basics of fundamental analysis
As its name suggests, fundamental analysis looks at the underlying factors that influence the price of an instrument. It is often used to assess the share price of a company, but can be used to gauge the price of everything from bonds to currencies.
The aim is to determine the intrinsic value of, say, a stock to find out if the market is currently underpricing or overpricing it. The aim is to buy at a discount before the market catches up. Investors take various approaches to this process, including top-down and bottom-up analysis and consider both quantitative and qualitative factors.
A top-down approach looks first at broader factors such as macroeconomic trends and industry news before drilling down to company specifics. How does the wider economy, including GDP growth, trading conditions, exchange rates, demand, inflation, interest rates and unemployment, affect the business and its competitors?
A bottom-up analysis looks first at the company in detail to build a picture, including its accounts and management performance. How strong are the cash flow, revenues and profits? Does the board have a strong team with a good track record? Are there onerous pension liabilities?
In both cases the aim is to determine if the price is a fair reflection of the financial value of the company. The "Oracle of Omaha" Warren Buffett is famous for having successfully employed fundamental analysis to choose stocks, making him a billionaire.
The strength or weakness of the fundamentals enables investors to assess not only the price but also the level of risk associated with the security. How well will this company weather a downturn? Are debt levels manageable?
Quantitative and qualitative analysis can be applied in both the top-down and bottom-up approaches although bottom-up analysis tends to be more numbers based.
Quantitative analysis – it’s a numbers games
Bottom-up analysis typically starts by looking at the company’s financial statements to understand its cash flows, income, assets and liabilities.
The cash flow statement records how much money is coming into and leaving the company each quarter.
The income statement goes into more detail, showing the company’s revenue, its costs and the resulting profit (or not). There are key indicators here that tie into the price of the stock, such as earnings per share.
The balance sheet provides a broader indication of the state of the company’s finances, detailing its assets and liabilities. Deduct what the company owes (liabilities) from what it owns (assets), and you get shareholder equity.
Some investors will employ discounted cash flow (DCF) to determine the present value of future cash flows to which shareholders are entitled.
We will look at some of these numbers in more detail later under ‘Main tools of fundamental analysis’ but, to reiterate, investors aim to value the company. They will sometimes express the results as ratios where a value above ‘1’ indicates the company is over-valued. Such ratios can usefully be compared historically and against peers in the sector.
Qualitative analysis – competitive edge, reputation and other fuzzy factors
Numbers provide only part of the story and often reflect what has happened rather than informing what will drive future performance. For this, investors can draw on qualitative analysis. They might adopt a top-down approach by assessing the industry, regulation and customers or a bottom-up focus on less tangible factors that are nevertheless crucial to a company’s success.
What gives a company a competitive edge? This could include patents, the brand name or the reputation of senior management.
Some investors hold great store by the quality of a company’s board, its experience and ability to innovate and adapt in times of adversity:
- They will pore over management messages at the start of the annual report. Is it lazy marketing text or does it provide a vision for the future direction of the company? How has the message changed from previous reports? Have the goals outlined five years ago come to fruition?
- Are there any interesting nuggets from that quarterly conference call? Investors will focus on the Q&A at the end to gauge how open and honest management is in responding to analysts’ questions.
- How did the CEO get on in a previous role? The internet usually makes it easy to check out the track record of key personnel.
- How invested is management in the company? If the CEO is also a shareholder, that should provide extra motivation for them to look after the business.
Other qualitative factors investors consider include the company’s corporate governance rules and its level of financial transparency.
Fundamental and technical analysis - pros and cons
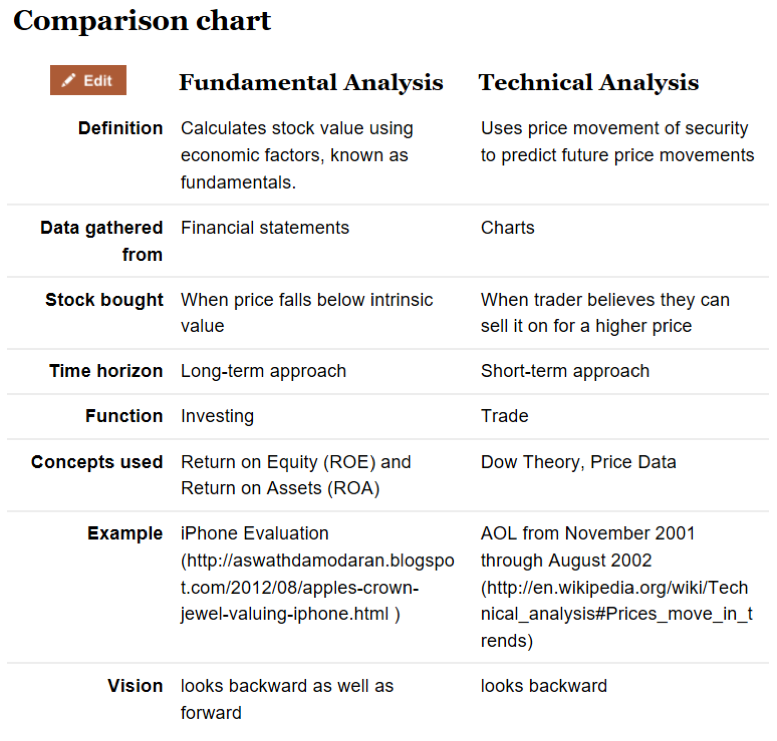
It’s important for investors to understand the different approaches of fundamental and technical analysis. Firstly, let’s explain what technical analysis is. Traders analyse charts to spot changes in volume and price, typically of stocks. They buy or sell based on market momentum and ignore the fundamentals because they believe the market discounts all shares. This approach assumes the market has already priced in all available information and that changing prices is a function of supply and demand rather than underlying business performance.
The table below compares fundamental and technical analysis.

Source: https://www.diffen.com/difference/Fundamental_Analysis_vs_Technical_Analysis
Strengths of fundamental analysis
Fundamental analysis focuses on the long term. Investors who identify industry trends and the companies best positioned to benefit from them can literally reap the dividends.
Investors can differentiate opportunities while share sectors often move in a group. For example, oil company share prices will go up or down depending on the supply and price of Brent crude, which can mask the differences between competitors and the edge they might have.
Expected earnings often drive share prices. Fundamental investors are likely to have done the research on the business and sector that gives them this information.
You aren’t going to spot a bargain unless you know intrinsic value. Technical analysis cannot reveal a company’s competitiveness or the value of its assets.
Weaknesses of fundamental analysis
Fundamental analysis is very time consuming. There is a risk that the market has already priced in the investor’s research but the investor believes otherwise and ends up trailing the intrinsic value of the stock being analysed.
Humans tend to be optimistic rather than objective. Fundamental investors counter this by running base-case valuations and outlier valuations, but a wealth of information makes it easy for investors to remain irrationally bullish.
There is no one size fits all. Different sectors cannot be valued in the same way and this places pressure on resources and time and costs more. Considering the number of subscribers to a pay TV company is not a model that can be applied to a copper miner.
There are analysts and there are analysts. Company accounts are audited, but can qualitative information be as objective? There are rules to avoid conflicts of interest, but sell-side analysts are often also the brokers after other business from the same companies. Buy-side analysts will typically be more objective from an investment perspective, but if they already hold much of a given stock will they want to talk its price down?
Historical financial trends influence how companies are valued. If the City typically values a stock at 25 time earnings and an analyst arrives at a valuation of 50 times, there is extra pressure to justify the uplift. Multiplier and growth assumptions fluctuate over time.
Main tools of fundamental analysis
The main tools of fundamental analysis are numbers driven. The Balance provides a good detailed guide to these metrics, which indicate a company’s value, and includes:
- Earnings per share: net earnings/outstanding shares
- Price to earnings ratio: share price/earnings per share
- Projected earnings growth: price to earnings ratio/projected growth in earnings
- Price to sales: market capitalisation of shares/total revenues
- Price to book: price per share/book value per share
- Dividend payout ratio: annual dividends per share/earnings per share
- Dividend yield: value of dividends paid in a given year per share of stock held/the value of one share of stock
- Book value: assets minus liabilities
- Return on equity: net income/book value
Read more from The Balance on what fundamental analysis is here.
Stockpup provides interactive charting showing some of the main tools outlined above for the S&P 100 companies at www.stockpup.com/companies/JNJ .
It employs key fundamental analysis tools such as earnings per share, dividend payout ratio and price to earnings ratio.
Forex fundamental analysis
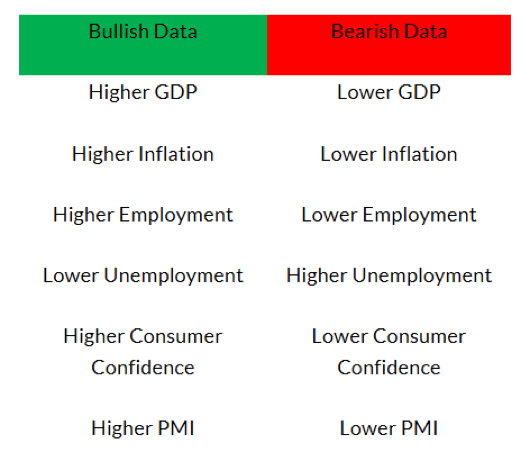
Forex fundamental analysis focuses on factors influencing the overall economy such as GDP, employment, monetary policy and political trends and how they are likely to affect demand for the country’s currency. The basic premise is that if the economic forecast is good the currency should strengthen as foreign investors will need to buy the currency to purchase assets in that country.
The DailyFX provides an interesting piece on how fundamentals move prices in the FX market and includes the below table on data considered in forex fundamental analysis. Note that PMI stands for Purchasing Managers’ Index and is a barometer of business confidence.

Find out more about fundamental analysis
There’s a wealth of related information elsewhere in our Glossary that will provide context and extra depth on what fundamental analysis isand how it fits into investment decision-making. In particular you might like to see our Investor definition, which considers different investment strategies. There’s also a more detailed explanation of Technical Analysis if you want to contrast the techniques in more detail.