Trading the Nasdaq 100 as WTI Flirts with $100 Again
Technicals turn negative in the shorter-term time frames, while in sentiment there’s a shift back to net long for CoT speculators.
U.S. equity index futures are up slightly after three weeks of consecutive losses as surging oil prices tied to the conflict in the Middle East weighed on sentiment. The S&P 500 (-1% w/w to 6,632), Nasdaq 100 (-0.2% w/w to 24,380), Dow 30 (-1% w/w to 46,558), and Russell 2000 (-0.9% w/w to 2,480) all suffered weekly losses.
Shares of Nvidia (-1.6%) fell back in what was a mixed session for semiconductors with losses for both AMD (-2.2%) and Broadcom (-4.1%) while Micron (+5.1%) impressed. Tesla shares (-1%) were in retreat but losses were larger for most other automakers, and for legacy software it was Adobe (-7.6%) tumbling even after beating on earnings and revenue as its CEO announced he would step down once a successor is named.
Equity index investors and traders have no choice but to monitor oil prices in the current phase, with WTI gapping higher and briefly touching $100 before the weekend gap got filled. Treasury yields fall back in the futures market after another week of notable gains as bond traders try to price in stickier inflation but also weaker growth (see the data below), and market pricing (CME’s FedWatch) expects a hold out of the Federal Reserve (Fed) not just this week but potentially until December with probabilities about a coin toss on a 25bp (basis point) rate reduction in October.
In terms of economic data there was plenty of it on offer last Friday, PCE (Personal Consumption Expenditures) price index for January rising 0.3% m/m (month-on-month) as expected and so too core m/m at 0.4% and core y/y (year-on-year) at 3.1%, but y/y headline fell to 2.8% a notch below forecast. Keep in mind the conflict started about a couple weeks ago and in turn pricing data from previous months won’t reflect the latest inputs. Personal income and spending for the same month was up 0.4% m/m, job openings (JOLTS) improved to 6.95m, while durables was flat but excluding transportation up 0.4% a notch below expectations. For growth in the fourth quarter, it was a clear miss with preliminary GDP (Gross Domestic Product) slowing to 0.7% well below the 1.4% estimate (which in turn was far below the roughly 3% forecast for the advance figure when it released back in February). UoM’s (University of Michigan) preliminary consumer sentiment for March dropped to 55.5 even if above forecast with inflation expectations unchanged for the one-year (at 3.4%) while a notch lower for the five-year print (3.2%).
Week ahead
As for the week ahead, we’ve got a few items today with Empire’s manufacturing index, industrial production and NAHB’s housing market index, though usually low-impacting items with the attention for those interested in tech on Nvidia’s GTC conference where CEO Huang is expected to speak.
We’ll get PPI (Producer Price Index) on Wednesday where it’ll be about the Fed later that day announcing its monetary policy and seen holding on rates, and all eyes on their ‘dot plot’ and forecasts. In earnings, there’s Micron the same day and FedEx on Thursday, the latter’s guidance noted within the context of rising transportation costs due to the conflict.
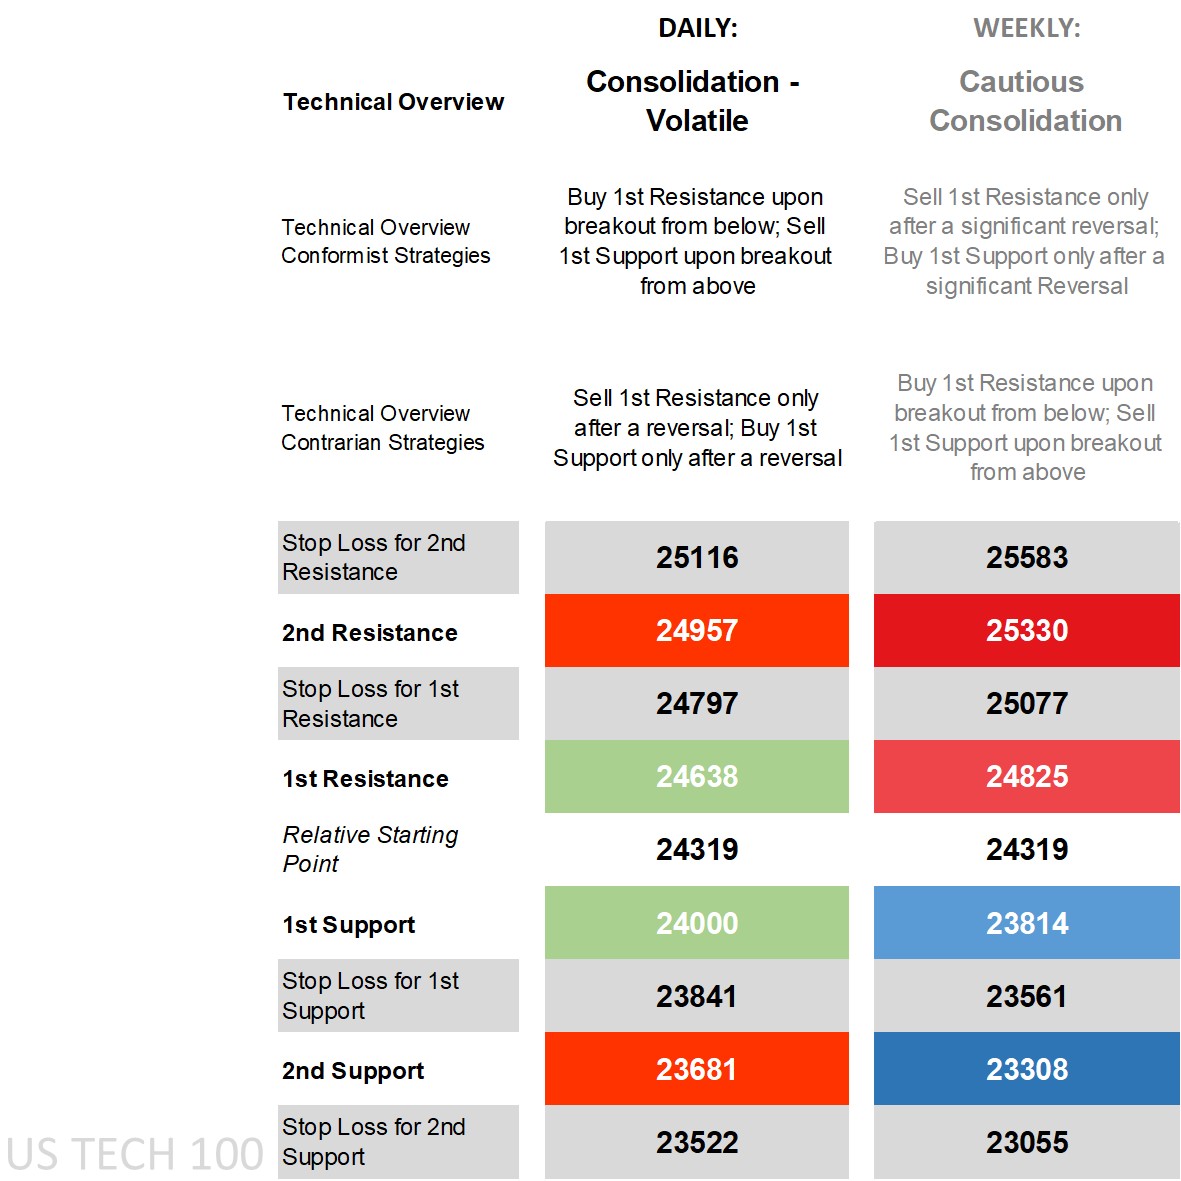
Nasdaq 100’s technical overview, strategies and levels
Looking at the daily time frame and price is below all its main moving averages (MA), not too far off the lower end of what are still narrow Bollinger Bands, on the DMI (Directional Movement Index) front the -DI over the +DI but not by a large margin, an RSI (Relative Strength Index) below the middle though well above oversold levels, and an ADX (Average Directional Movement Index) by one calculation in trending territory (but not by another reducing its significance). It’s easy to classify the overview on the daily time frame as something bearish given a few red technical indicators, but the problem is that they’ve been huddled close to each other and price due to weeks of relatively rangebound movement and in turn are less reliable. Furthermore, much of the movement has had to do with oil prices climbing, meaning any reversal even if partial would help lift price and shake off shorter-term bearish technicals.
That has meant a more ‘consolidation – volatile’ overview for the daily with a move beyond 1st levels favoring conformist strategies when there’s a significant fundamental update that causes a sizable move in energy prices, otherwise if holding giving contrarian sell-after-reversal strategies the edge for those that see prices stabilizing somewhat. The weekly technical overview is ‘cautious consolidation’ given weekly 1st levels can contain and handle most shorter-term volatile moves with ease as they are larger, but that doesn’t mean conformists ought to fade the move, instead only going opposite after a significant reversal for a move back to the Relative Starting Point.
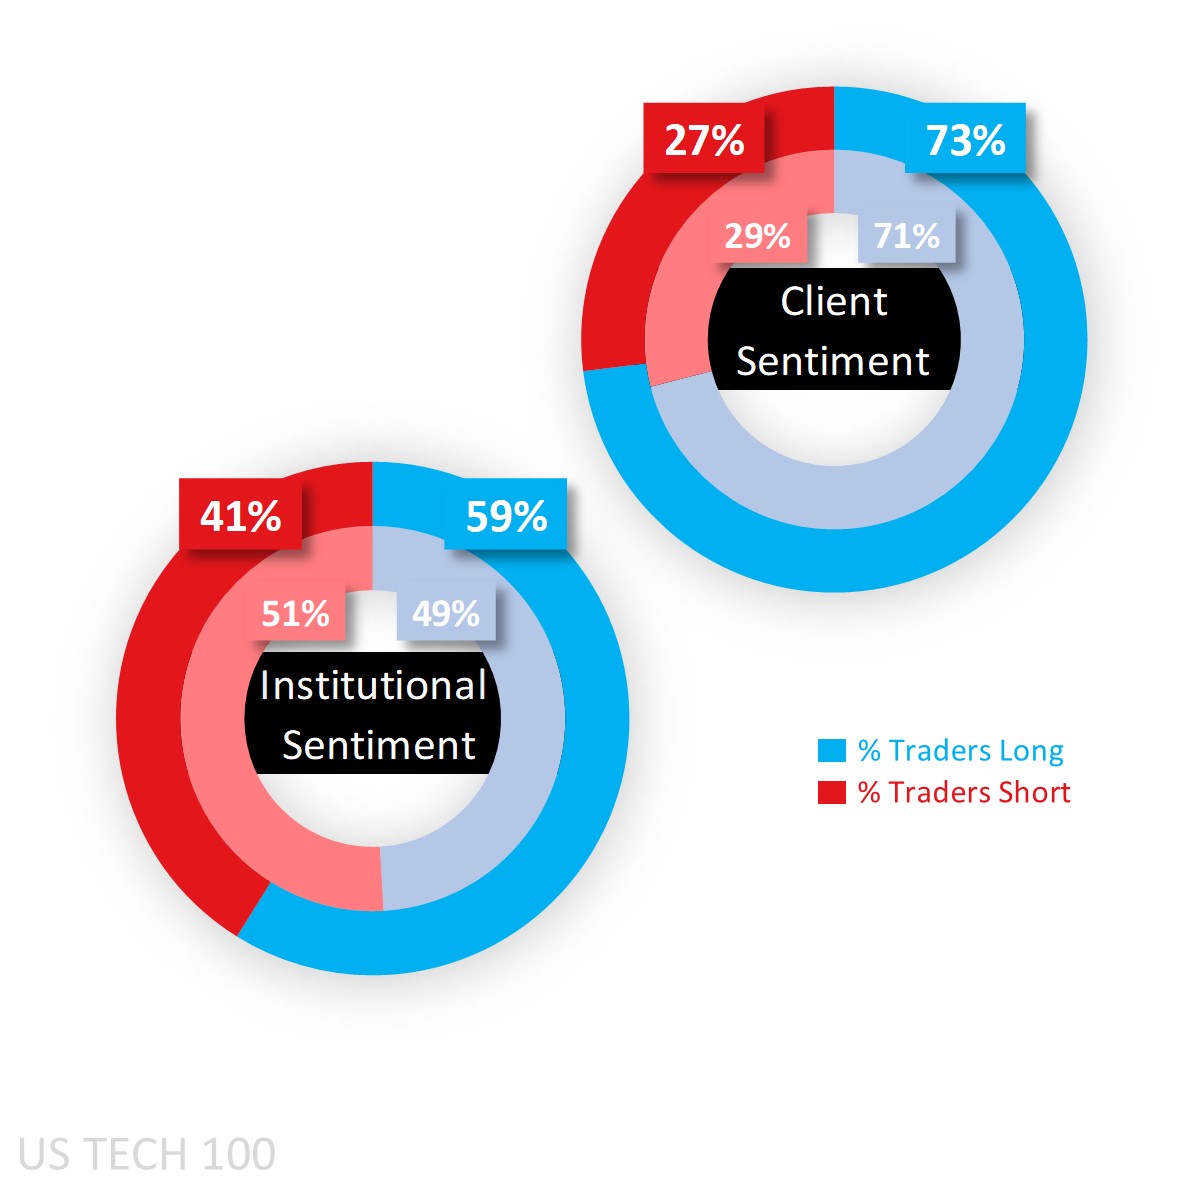
Capital.com’s client sentiment for Nasdaq 100
Capital.com’s clients remain heavy buy, but earlier last week they fell to more moderate long sentiment levels when prices initially recovered, meaning a decent chunk of those buy positions are fresh and looking to unwind on a relatively small intraday lift off the intraweek lows.
Larger speculators according to the latest CoT (Commitment of Traders) report shifted back to net long after briefly flirting with net short sentiment, and due to a significant reduction in short positions (by 24,127 lots). They remain net short in the other key U.S. equity indices however, little changed in the S&P 500 (net short 63% from 64%) and Dow 30 (net short 55% from 54%) while moving notably away from the middle in the Russell 2000 (net short 58% from 52%).
Client sentiment mapped on the daily chart
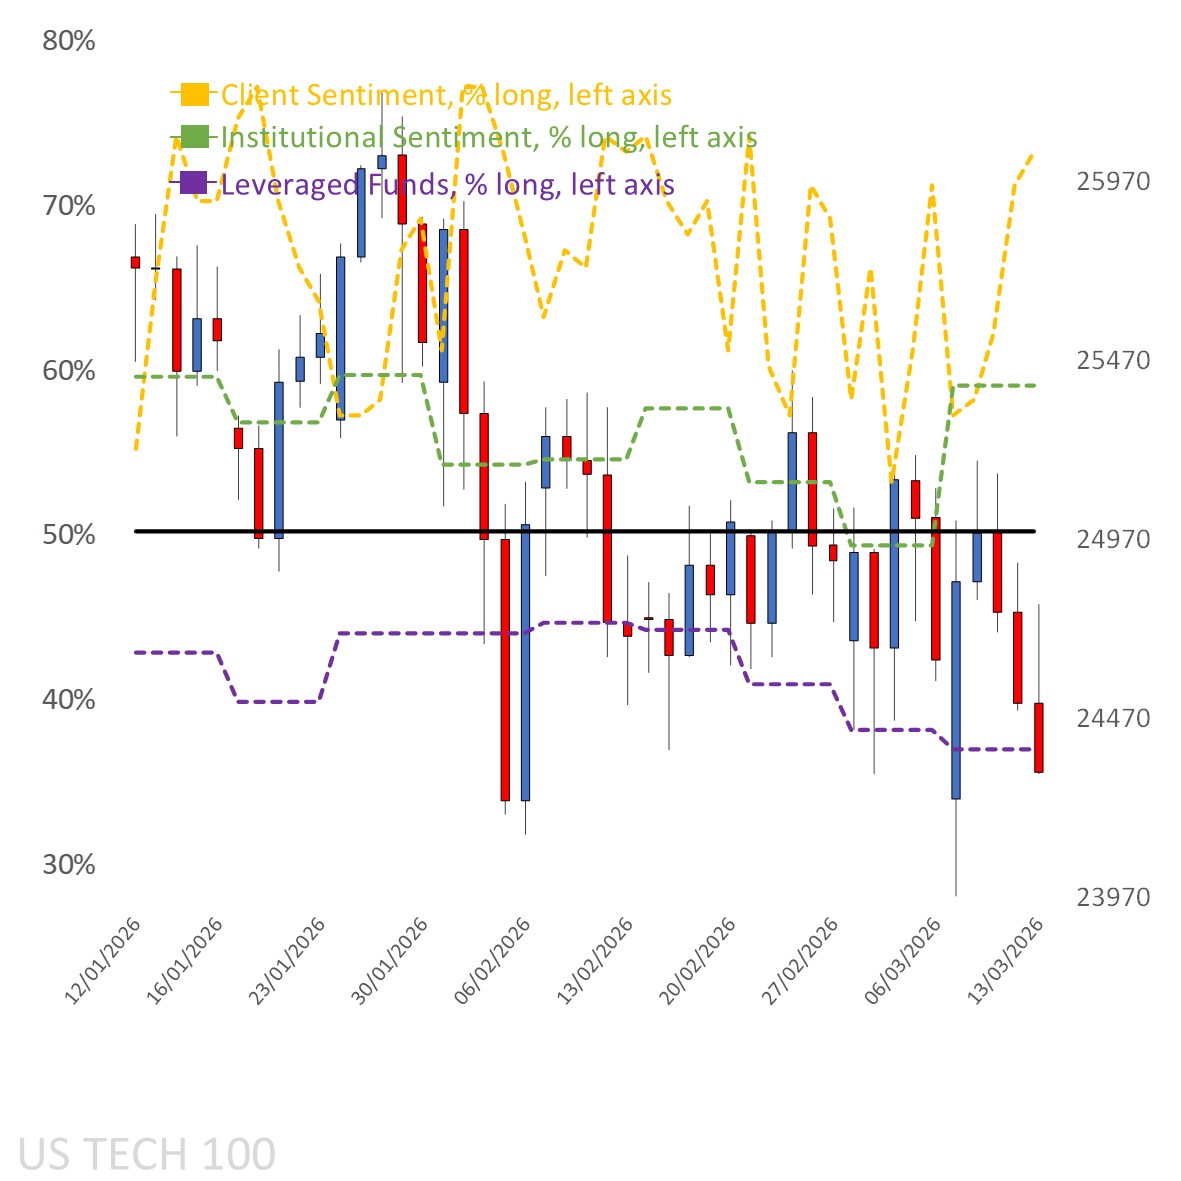
Source: Capital.com
Period: January 2026 – March 2026
Past performance is not an indicator of future results.
Nasdaq 100’s chart on Capital.com’s platform with key technical indicators
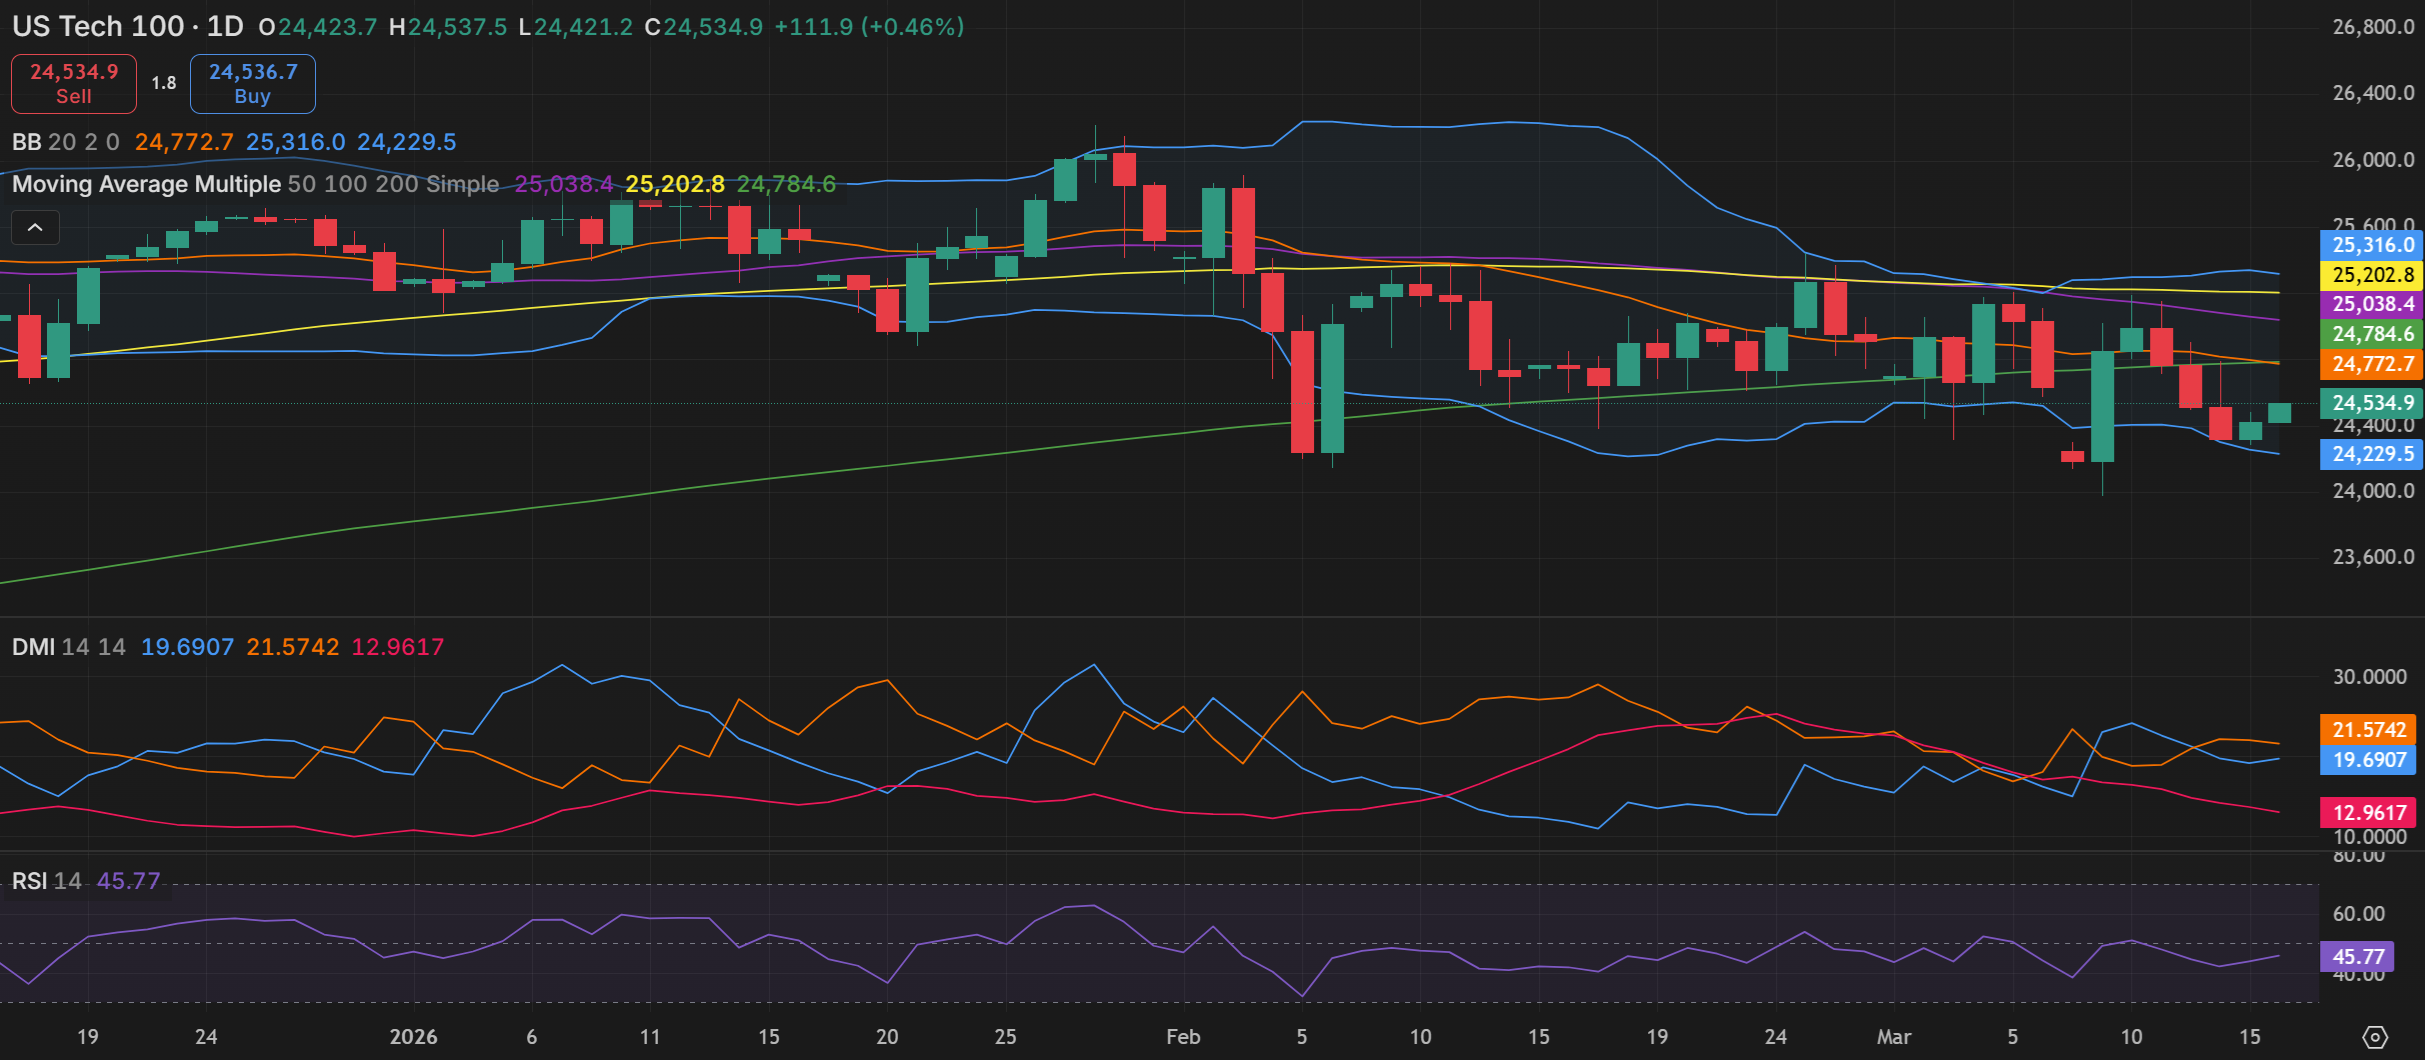
Source: Capital.com
Period: December 2025 – March 2026
Past performance is not an indicator of future results