TUI stock forecast: Iran ceasefire, Q2 loss, guidance
TUI is a German travel group whose Q2 FY2026 results reflected Iran-related disruption, narrower losses and revised full-year EBIT guidance. Explore third-party TUI1 price targets and technical analysis. Past performance is not a reliable indicator of future results.
TUI AG (TUI1) was trading at €7.38 as of 4:29pm UTC on 15 June 2026, within an intraday range of €6.87–€7.64 on Capital.com’s feed. Past performance is not a reliable indicator of future results.
Sentiment improved alongside a broader European equity rally, with Reuters reporting that the STOXX 600 reached an all-time high on 15 June 2026 after the United States and Iran reached a preliminary agreement to end their conflict and reopen the Strait of Hormuz (Reuters, 15 June 2026). The development has direct relevance for TUI, as the Iran war had previously cost the group roughly €40m–€45m in one-off impacts during Q2 FY2026, including flight cancellations and ship re-routing (AltexSoft, 23 April 2026). TUI's Q2 FY2026 results, published in May 2026, showed its underlying operating loss narrowing to €188.30m – an €18.50m improvement year on year – with Hotels and Resorts revenue up 4.8% to €451.10m (EQS News, 13 May 2026). However, the group suspended its revenue guidance and revised its full-year underlying EBIT outlook to €1.10bn–€1.40bn (Investing.com, 13 May 2026).
Third-party TUI outlook: ceasefire relief and revised guidance
As of 15 June 2026, third-party TUI stock predictions reflect a range of views shaped by the group's revised FY2026 earnings guidance, Middle East disruption and signs of booking recovery in June 2026.
Saxo Bank (FactSet consensus)
Saxo Bank's FactSet-sourced analyst consensus assigns TUI a Buy rating with an average 12-month price target of €10.36, implying a return of approximately 46% from the price at the time of capture. The data draws on covering analysts tracked via FactSet Research Systems and reflects the post-guidance-revision consensus, with the Overweight skew maintained despite the Iran-conflict headwinds flagged in Q2 FY2026 results (Saxo Bank, 5 June 2026).
Simply Wall St (consensus reset)
Simply Wall St notes that covering analysts reduced their average 12-month price target for TUI by €0.95 to €10.44, reflecting modestly lower revenue growth assumptions, a slightly softer profit margin outlook and a higher future price-to-earnings multiple applied to the stock. The report, which captures broker model updates through late May, describes recent research as centred on 'resetting expectations rather than calling for a sharp change in direction' amid the group's suspended revenue guidance (Simply Wall St, 24 May 2026).
Investing.com (consensus aggregation)
Investing.com's consensus page for TUI1, drawing on 13 contributing analysts, shows an average 12-month price target of €10.35, within a range of €7.30–€16. The stock carries an overall Buy consensus rating across the analyst panel, with the mean target sitting above the current trading level after a broader European travel-sector re-rating following the preliminary US–Iran ceasefire agreement (Investing.com, 14 June 2026).
MarketScreener (broker consensus)
MarketScreener reports an average 12-month consensus price target of €10.45 for TUI AG across 13 analysts, with an Outperform consensus rating. The figure represents a step-down from the €11.36–€11.43 range logged earlier in the year, reflecting the post-April guidance-cut round of broker revisions, while the constructive overall stance has been retained (MarketScreener, 15 June 2026).
Yahoo Finance (analyst summary)
Yahoo Finance's analyst data for TUI1 aggregates 12-month revenue estimates from covering brokers, with the current-year FY2026 consensus revenue estimate at €5.97bn, within a range of €5.82bn–€6.10bn. The next scheduled earnings date is 12 August 2026, which analysts may treat as a key near-term catalyst for model updates, particularly given the FY2026 underlying EBIT guidance range of €1.10bn–€1.40bn that remains in place following the May revision (Yahoo Finance, 15 June 2026).
Predictions and third-party forecasts are inherently uncertain, as they cannot fully account for unexpected market developments. Past performance is not a reliable indicator of future results.
TUI latest and upcoming earnings
TUI AG published its Q2 FY2026 results in May 2026, reporting an underlying operating loss of €188.30m, an €18.50m improvement year on year at constant currency. This came despite a €40m headwind from the Iran conflict, which disrupted flight routing and affected bookings in the region (Global Banking and Finance, 12 May 2026). Hotels and Resorts revenue rose 4.8% to €451.10m, and the group described H1 FY2026 as its strongest first half on record, with underlying EBIT growing for the 14th consecutive quarter (EQS News, 12 May 2026).
Alongside the Q2 release, TUI suspended its full-year revenue growth guidance, having previously targeted 2–4% growth on FY2025 revenue of €24.18bn. It also revised its FY2026 underlying EBIT guidance to €1.10bn–€1.40bn at constant currency, citing uncertainty over the pace of booking normalisation in the Middle East and European source markets (Investing.com, 12 May 2026). The group noted that summer 2026 bookings remained broadly in line with the prior year, excluding the affected corridor, and said it would update the market further once trading clarity improved (BBC, 13 May 2026).
The next scheduled earnings event is the Q3 / nine-month FY2026 results release, confirmed by TUI Group's official financial calendar for 12 August 2026, accompanied by an analyst and investor conference on the same date. A Q4 sales and revenue release is scheduled for 22 September 2026 (TUI Group, 15 June 2026).
TUI1 stock price: technical overview
The TUI1 stock price was trading at €7.38 as of 4:29pm UTC on 15 June 2026, above its short-term moving average cluster. The 20-day and 50-day simple moving averages (SMAs) stood at roughly €6.77 and €6.76 respectively, with the 20-over-50 alignment still intact. This kept the near-term structure constructive, although the price also traded below the 100-day and 200-day SMAs at €7.31 and €7.71, which may act as overhead reference levels on the daily chart. The Hull moving average (9) at €6.92 sat beneath the current price, consistent with the short-term bid tone, according to TradingView data.
The 14-day relative strength index (RSI) stood at 65.1 – firm, though not yet stretched – while the average directional index (ADX) (14) read 13.5, indicating a weak trend signal. TradingView’s data suggests momentum is positive, but not yet backed by a strong directional impulse.
On the topside, the classic R1 pivot at €7.47 is the nearest reference. A daily close above that level could bring the R2 zone near €7.86 into view. The 100-day SMA at €7.31 sits just below the current price and could move between resistance and support, depending on how the session closes.
On the downside, the classic pivot (P) at €6.82 offers initial support, with the 50-day SMA shelf near €6.76 the next meaningful level below. A move below that cluster could bring the S1 pivot at €6.43 into focus (TradingView, 15 June 2026).
This is technical analysis for informational purposes only and does not constitute financial advice or a recommendation to buy or sell any instrument.
TUI share price history (2024–2026)
TUI1’s stock price opened June 2024 trading around €6.68, then moved broadly within a range of roughly €5.09–€7.29 through the summer, weighed down by a soft European consumer backdrop and lingering post-pandemic cost pressures. The stock found its footing through autumn 2024, climbing from lows near €5.79 in early September to close the year at approximately €8.38 on 30 December 2024 – a recovery that coincided with improving forward booking data and broader European equity strength.
2025 began firmly, with TUI touching a session high of €9.59 on 9 February 2025 after reporting its strongest Q1 underlying EBIT on record, up €26m year on year. The stock then pulled back through spring and into summer, dropping towards €5.37 in early August 2025 amid global equity volatility, before recovering steadily to close 2025 at €8.99 on 30 December.
The stock entered 2026 near €9.05, reaching a two-year high of €9.59 in early February before TUI revised its FY2026 guidance lower in April, citing the Iran conflict’s impact on bookings and flight routing. That triggered a sharp slide to a two-year low of €6.11 on 30 April 2026. A recovery has since taken hold, supported by the US–Iran preliminary ceasefire agreement, with TUI1 trading at €7.40 on 15 June 2026.
Past performance is not a reliable indicator of future results. Share prices are indicative and may differ from live market prices.
TUI (TUI1): Capital.com analyst view
TUI AG (TUI1) has navigated a volatile stretch in 2026, with the stock recovering from a two-year low of €6.08 set on 30 April to trade at €7.38 as of 15 June 2026. The group’s Q2 FY2026 results showed resilience in Hotels and Resorts and a 14th consecutive quarter of underlying EBIT growth, while the preliminary US–Iran ceasefire agreement reached in June broadly supported sentiment across European travel equities. If the peace process holds and booking visibility improves into the summer, TUI may be able to revisit its suspended revenue guidance, while analyst targets – currently clustering near €10.35–€10.45 on consensus – could remain an important market reference point. However, geopolitical risk cuts both ways: a breakdown in talks could renew booking hesitation, extend late-booking patterns and weigh on the stock’s ability to close the gap with those targets.
Structurally, TUI’s integrated model – combining its own airline, hotels, cruises and distribution – provides both diversification and operational leverage, which supporters cite as a buffer in uneven demand environments. On the other hand, that same integration creates fixed-cost exposure when capacity utilisation falls, as the Iran-related €40m–€61m hit in H1 FY2026 illustrated. Currency headwinds at constant-currency reporting and Jamaica hurricane-related losses add further complexity to the FY2026 earnings picture.
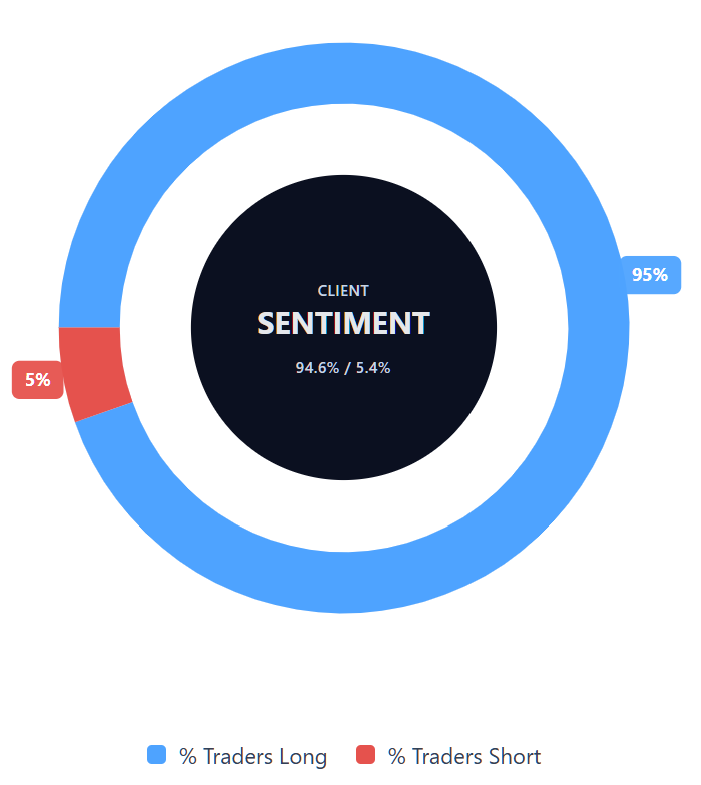
Capital.com’s client sentiment for TUI CFDs
As of 15 June 2026, Capital.com client positioning in TUI CFDs stands at 94.6% buyers versus 5.4% sellers, putting buyers ahead by 89.2 percentage points and showing a one-sided skew towards long positions. This snapshot reflects open positions on Capital.com and can change.
Summary – TUI 2026
- TUI AG (TUI1) was trading at €7.38 as of 4:29pm UTC on 15 June 2026, recovering from a two-year low of €6.08 set on 30 April 2026.
- Key price drivers include the preliminary US–Iran ceasefire agreement, TUI’s revised FY2026 underlying EBIT guidance of €1.10bn–€1.40bn, and a €40m–€61m Iran-related earnings hit in H1 FY2026.
- Q2 FY2026 results published in May 2026 showed operating losses narrowing by €18.50m year on year. Revenue guidance remains suspended pending greater booking clarity.
- Reuters reported that the STOXX 600 hit an all-time high on 15 June 2026 following the US–Iran preliminary agreement, providing a supportive broader backdrop for travel stocks including TUI.
Past performance is not a reliable indicator of future results.
FAQ
Who owns the most TUI stock?
The article focuses on TUI’s share price performance, analyst forecasts, earnings and technical indicators, rather than shareholder ownership. TUI’s largest shareholders may change over time as institutional investors adjust their positions, so traders should check the company’s latest annual report, regulatory filings or investor relations materials for the most current ownership data. Ownership structure can provide context, but it should not be used on its own to assess TUI’s future share price direction.
What is the five-year TUI share price forecast?
The article covers third-party 12-month analyst price targets rather than five-year TUI1 stock forecasts. Across sources captured between 31 May and 15 June 2026, consensus targets clustered around €10.35–€10.45, with individual estimates ranging from €7.30–€16. Longer-term forecasts are harder to assess, as TUI’s outlook may depend on travel demand, booking trends, costs, currency movements and geopolitical risks. Forecasts can be wrong and shouldn’t be treated as guarantees.
Is TUI a good stock to buy?
Whether TUI is a good stock to buy depends on your own research, risk tolerance, time horizon and view of the company’s outlook. The article notes that analyst consensus remained broadly constructive, while TUI’s revised FY2026 guidance, suspended revenue outlook and geopolitical exposure added uncertainty. Its integrated model may support diversification, but it also creates fixed-cost exposure when demand weakens. This content is informational only and doesn’t constitute investment advice.
Could TUI stock go up or down?
TUI stock could move in either direction. The article notes that the share price had recovered from its April 2026 low, supported by improved sentiment after the preliminary US–Iran ceasefire agreement and analyst targets above the market price. However, risks remain, including renewed geopolitical disruption, weaker booking trends, cost pressures and uncertainty around guidance. Technical indicators also suggested positive momentum, but without a strong trend signal. Past performance isn’t a reliable indicator of future results.
Should I invest in TUI stock?
The decision to invest in TUI stock should be based on your own financial circumstances, objectives and independent research. The article highlights both supportive factors, such as improved Hotels and Resorts revenue and analyst consensus targets, and risks, including suspended revenue guidance, geopolitical disruption and fixed-cost exposure. You may also want to consider how TUI fits within a diversified portfolio. Nothing in this article should be taken as a recommendation to buy, sell or hold the stock.
Can I trade TUI CFDs on Capital.com?
Yes, you can trade TUI CFDs on Capital.com. Trading share CFDs lets you speculate on price movements without owning the underlying asset and to take long or short positions. However, contracts for difference (CFDs) are traded on margin, and leverage amplifies both profits and losses. You should ensure you understand how CFD trading works, assess your risk tolerance, and recognise that losses can occur quickly.