Stellantis stock forecast: Wayve-Uber robotaxi deal
Stellantis is a Milan-listed automaker, with recent developments including a non-binding robotaxi agreement with Wayve and Uber. Explore third-party STLAM price targets and technical analysis. Past performance is not a reliable indicator of future results.
Stellantis N.V. (STLAM) ) traded at €5.26 in early European trading at 11:48am UTC on 25 June 2026, matching its session high after recovering from an intraday low of €5.13. Past performance is not a reliable indicator of future results.
Sentiment around Stellantis has been shaped by several concurrent factors:President Trump's announced increase in US tariffs on European auto imports from 15% to 25%, which weighed on European autos in early May (Reuters, 2 May 2026); a €400 million investment in the Mulhouse plant alongside €500 million in R&D directed at the new STLA One electrified vehicle platform, announced on 2 June 2026 (Reuters, 2 June 2026); and a non-binding memorandum of understanding signed on 16 June 2026 with Wayve and Uber to jointly develop and deploy Level 4 driverless robotaxi services across Europe, North America, and other global markets (Stellantis, 17 June 2026).
Third-party Stellantis outlook: robotaxi deal and tariffs in focus
As of 25 June 2026, third-party Stellantis stock predictions show a wide spread of views. Forecasts reflect the group's turnaround execution, US tariff headwinds, European EV competition and the strategic disclosures made at the FaSTLAne 2030 Investor Day on 21 May 2026.
Bank of America (Underperform downgrade)
Bank of America assigns Stellantis an Underperform rating, with a 12-month price target of €5.50, the lowest among tracked brokers in the current window. The bank cites an unproven recovery trajectory and intensifying competition from Chinese EV manufacturers as the main drivers of its cautious stance (Yahoo Finance, 11 May 2026).
Citi (Neutral, target trim)
Citi analyst Harald Hendrikse maintains a Neutral rating on Stellantis and trims the 12-month price target to €7.20 from €7.50, following the FaSTLAne capital markets day. The analyst notes slower-than-expected progress in US sales and market share recovery, and describes the risk/reward profile as even at current levels (The Globe and Mail, 10 June 2026).
Morgan Stanley (Equal Weight, target lift)
Morgan Stanley raises its 12-month price target on Stellantis to €7.10 from €6.50, while retaining an Equal Weight rating. The revision follows the group's Investor Day presentation and reflects a modest improvement in the bank's near-term outlook; however, the Equal Weight stance suggests limited directional conviction at the current price (MarketWatch, 4 June 2026).
Jefferies (Buy, maintained)
Jefferies analyst Philippe Houchois maintains a Buy rating on Stellantis, with a 12-month price target of €9.50, reiterated after the FaSTLAne 2030 Investor Day. Jefferies remains among the more constructive voices on the stock, citing volume recovery momentum and the group's longer-term strategic repositioning as supporting factors (The Globe and Mail, 27 May 2026).
Investing.com (consensus overview)
Investing.com aggregates projections from 25 analysts covering Milan-listed STLAM and records a Neutral mean consensus as of 23 June 2026. The average 12-month price target stands at €7.87, with a high estimate of €12.50 and a low of €4. Of the 25 analysts surveyed, nine recommend buying the stock, 15 recommend holding and three advise selling (Investing.com, 23 June 2026).
Predictions and third-party forecasts are inherently uncertain, as they cannot fully account for unexpected market developments. Past performance is not a reliable indicator of future results.
Stellantis (STLAM) earnings: Q1 2026 results and next reporting date
Stellantis reported Q1 2026 financial results on 30 April 2026, marking a return to profitability after a loss in the prior year period. Net revenues rose 6% year on year to €38.1 billion, with North America the main regional contributor, while net profit reached €377 million against a net loss of €387 million in Q1 2025 (Stellantis, 30 April 2026). Adjusted operating income rose 194% to €960 million, producing an AOI margin of 2.5%, and consolidated shipments totalled 1.4 million units, up 12% year on year (Investing.com, 30 April 2026).
Industrial free cash flows remained negative at €1.9 billion, though 37% better than Q1 2025, with industrial available liquidity at €44.1 billion, within the company's 25–30% target range. Stellantis revised its estimated net tariff impact for 2026 to €1.3 billion from €1.6 billion and reaffirmed full-year guidance for mid-single-digit net revenue growth and a low-single-digit AOI margin (Financial Times, 30 April 2026). Q2 2026 results are scheduled for 30 July 2026, before the European markets open (Stellantis, 13 January 2026).
STLAM stock price: technical overview
The STLAM stock price traded at €5.26 as of 11:48am UTC on 25 June 2026, at the top of its intraday range of €5.13–€5.26. The price sits below the key moving-average cluster: the 20-, 50-, 100- and 200-day simple moving averages (SMAs) stand at approximately €5.96, €6.39, €6.40 and €7.66, respectively. This places the stock below all four major averages and in a bearish moving-average alignment. The Hull moving average (9) at €5.15 tracks most closely to the current price, in line with the recent downside move.
Momentum signals point to oversold conditions. The 14-day relative strength index reads 30.5, close to the conventional oversold threshold of 30. The average directional index (14) at 24.7 suggests a moderate, but not yet strong, directional trend, while the stochastic %K (14, 3, 3) at 4.4 also supports the stretched-low reading.
The classic pivot point (P) at €6.66 is the first overhead reference of note. A sustained daily close above that level would bring classic R1 at €7.37 into view. On the downside, classic S1 at €6.16 sits above the current price, meaning the price has already broken below both S1 and S2 at €5.46. S3 at €4.26 is the next classic reference lower, should the session low of €5.13 give way (TradingView, 25 June 2026).
This technical analysis is for informational purposes only and does not constitute financial advice or a recommendation to buy or sell any instrument.
Stellantis share price history (2024–2026)
STLAM’s stock price closed at €19.43 on 26 June 2024, near the upper end of what proved to be the stock’s last sustained period above €18. From there, a prolonged decline developed through the second half of 2024, with the share price ending the year at €12.60. That marked a fall of around 35% from the June peak, coinciding with a series of profit warnings, the departure of then-CEO Carlos Tavares in December 2024 and deepening concerns over North American inventory and pricing.
Selling continued into 2025. STLAM opened the year at around €12.64 and, after holding broadly in the €12–€13 range through February, began drifting lower as US tariff concerns and weak European auto demand weighed on the sector. By the end of 2025, the stock had closed at €9.49.
The pace of decline accelerated in early 2026. STLAM fell around 24% in a single session on 6 February 2026, dropping from €8.21 to €6.23, after management acknowledged that EV adoption targets had been significantly overestimated. A partial recovery carried the shares back towards €7.46 by mid-April, supported by a return to profitability in Q1 2026 results, before renewed pressure resumed through June.
STLAM closed at €5.27 on 25 June 2026, approximately 45.7% lower year to date and 38.1% lower year on year.
Past performance is not a reliable indicator of future results. Share prices are indicative and may differ from live market prices.
Stellantis (STLAM): Capital.com analyst view
Stellantis has undergone a significant reset over the past 18 months, culminating in the €60bn FaSTLAne 2030 strategic plan presented at its May 2026 Investor Day. The plan targets revenue of €154bn–€190bn and an adjusted operating income margin of 7% by 2030.
The Q1 2026 return to profitability, with net revenues rising 6% year on year to €38.1bn and adjusted operating income reaching €960m, offers an early indication that the turnaround may be gaining traction. The June 2026 robotaxi partnership with Wayve and Uber adds a longer-dated autonomous mobility element to the investment case, although the agreement remains non-binding.
Material risks remain substantial. An estimated €1.3bn in US tariff costs for 2026, intense competition from Chinese EV manufacturers and industrial free cash flows that are still projected to remain negative through 2026 all represent meaningful headwinds. The breadth of the FaSTLAne 2030 targets may support medium-term sentiment if execution is consistent. However, the wide gap between the current share price and the analyst consensus target of €7.87 also reflects ongoing uncertainty around the pace and durability of the recovery.
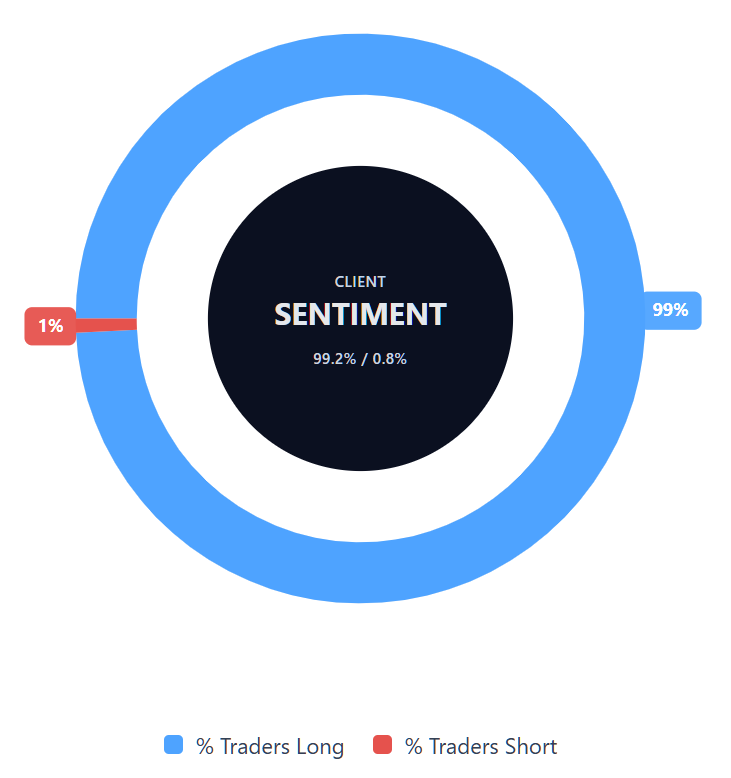
Capital.com’s client sentiment for Stellantis CFDs
As of 25 June 2026, Capital.com client positioning in Stellantis CFDs shows buyers at 99.2% versus sellers at 0.8%, putting buyers ahead by 98.4 percentage points. This places sentiment in heavily long-positioned territory. This snapshot reflects open positions on Capital.com and can change.
Summary – Stellantis 2026
- STLAM traded at €5.26 as of 11:48am UTC on 25 June 2026, down approximately 45.7% year to date and 72.9% below June 2024 levels.
- Key price drivers include an estimated €1.3bn in US tariff exposure for 2026, ongoing competition from Chinese EV manufacturers and execution risk around the FaSTLAne 2030 turnaround plan.
- Q1 2026 results showed a return to profitability, with net revenues up 6% year on year to €38.1bn and adjusted operating income of €960m.
- A non-binding robotaxi partnership with Wayve and Uber, announced on 16 June 2026, and new Peugeot EV production at Mulhouse represent notable recent strategic developments.
Past performance is not a reliable indicator of future results.
FAQ
Who owns the most Stellantis stock?
Stellantis has a broad shareholder base, with major holdings typically associated with long-term institutional and strategic investors rather than a single controlling public shareholder. Ownership levels can change over time as investors adjust their positions, so traders should check the latest regulatory filings and company disclosures for the most current view. Shareholder structure may provide useful context, but it shouldn’t be used alone to assess the outlook for Stellantis stock.
What is the five-year Stellantis share price forecast?
Five-year STLAM stock forecasts are inherently uncertain, as they depend on factors including tariff exposure, EV competition, execution of the FaSTLAne 2030 plan, cash flow recovery and wider auto-sector conditions. Analyst targets cited in the article focus mainly on the next 12 months, with estimates varying widely. Longer-term projections should therefore be treated as scenario-based rather than reliable predictions, and past performance isn’t a reliable indicator of future results.
Is Stellantis a good stock to buy?
Whether Stellantis is a good stock to buy depends on individual objectives, risk tolerance and market view. The company has returned to profitability in Q1 2026 and set medium-term targets under its FaSTLAne 2030 plan, but it also faces material risks, including tariff costs, competitive pressure from Chinese EV manufacturers and negative industrial free cash flow expectations for 2026. This article doesn’t constitute investment advice or a recommendation to buy or sell Stellantis stock.
Could Stellantis stock go up or down?
Yes. Stellantis stock could move higher if the group delivers on its turnaround plans, improves industrial free cash flow, manages tariff costs effectively or gains traction from strategic initiatives such as its non-binding robotaxi partnership with Wayve and Uber. It could also fall if competition intensifies, tariffs weigh further on margins, or execution falls short of expectations. As with all shares, price movements can be affected by both company-specific and wider market factors.
Should I invest in Stellantis stock?
Only you can decide whether Stellantis stock fits your financial goals, risk tolerance and investment horizon. The article highlights both potential support factors, including the company’s Q1 2026 return to profitability, and ongoing risks, such as tariff exposure, EV competition and negative industrial free cash flow expectations. Consider doing your own research and, where appropriate, speaking to a qualified financial adviser before making any investment decision. This content is not financial advice.
Can I trade Stellantis CFDs on Capital.com?
Yes, you can trade Stellantis CFDs on Capital.com. Trading share CFDs lets you speculate on price movements without owning the underlying asset and to take long or short positions. However, contracts for difference (CFDs) are traded on margin, and leverage amplifies both profits and losses. You should ensure you understand how CFD trading works, assess your risk tolerance, and recognise that losses can occur quickly.