Stellantis stock forecast: FaSTLAne 2030 plan
Stellantis is a global automaker whose 2026 outlook is shaped by its FaSTLAne 2030 plan, Q1 shipment growth and higher US tariffs on EU auto imports. Explore third-party STLAM price targets and technical analysis. Past performance is not a reliable indicator of future results.
Stellantis N.V. (STLAM) is trading at €6.12 as of 4:48pm UTC on 15 June 2026, within an intraday range of €5.88–€6.24. Past performance is not a reliable indicator of future results.
Sentiment around STLAM has been shaped by several concurrent developments: the company's FaSTLAne 2030 strategic plan, presented on 21 May 2026 under new CEO Antonio Filosa (Stellantis, 21 May 2026); Q1 2026 consolidated shipments of 1.40m vehicles, up 12% year-on-year (StockTitan, 15 April 2026); and broader pressure on European automakers after President Trump announced on 1 May 2026 that US tariffs on EU auto imports would rise to 25% from 15%, citing EU non-compliance with the Turnberry trade deal (Reuters, 2 May 2026).
The FaSTLAne 2030 plan outlined a €60bn, five-year programme targeting revenue growth from €154bn to €190bn by 2030 and an adjusted operating income margin of 7% (Stellantis, 21 May 2026). Q1 shipment growth was supported by double-digit gains in both North America and Enlarged Europe (CNBC, 30 April 2026).
Third-party Stellantis outlook: FaSTLAne 2030
As of 15 June 2026, third-party Stellantis stock predictions remain widely dispersed. Views are shaped by debate over the pace of the company's operational recovery under CEO Antonio Filosa, the reception of the FaSTLAne 2030 strategic plan, and external risks including US tariffs on EU auto imports.
Morgan Stanley (Equal Weight target raised)
Morgan Stanley raises its 12-month price target on Stellantis to €7.10 from €6.50 while maintaining an Equal Weight rating on the shares. The revision reflects a modest improvement in the firm's near-term operational outlook, while the Equal Weight stance suggests the analyst sees limited upside relative to sector peers at current levels (TipRanks, 3 June 2026).
Citigroup (Neutral reiterated)
Citigroup reiterates a Neutral rating on Stellantis, with no change to its standing 12-month price assessment, in a fresh note covering developments through early June 2026. The reiteration comes during a period of range-bound trading in STLAM, as markets assess whether the FaSTLAne 2030 targets are achievable against a backdrop of elevated US tariff exposure (MarketBeat, 9 June 2026).
Public.com (five-analyst consensus)
Public.com compiles ratings from five analysts covering NYSE-listed STLA and records a Buy consensus as of 15 June 2026, with an average 12-month price target of $11.59. The breakdown shows 20% Strong Buy, 20% Buy, and 60% Hold, with no Sell ratings in the current cohort (Public.com, 15 June 2026).
MarketBeat (19-analyst Wall Street consensus)
MarketBeat aggregates 19 analyst ratings on NYSE-listed STLA and records a Hold consensus, with an average 12-month price target of $10.91. The high estimate stands at $15 and the low at $8. The tally comprises 2 Strong Buy, 4 Buy, 10 Hold, and 3 Sell ratings, with the consensus target implying approximately 59% upside from the closing price of $6.88 on 12 June 2026 (MarketBeat, 14 June 2026).
MarketScreener (27-analyst Milan-listed consensus)
MarketScreener aggregates 27 analysts covering Milan-listed STLAM and records a mean Hold consensus, with an average 12-month price target of €7.87. The high estimate stands at €12.50 and the low at €4. The wide range points to significant divergence among analysts on the credibility and timing of Stellantis's profitability recovery under the FaSTLAne 2030 framework (MarketScreener, 27 May 2026).
Predictions and third-party forecasts are inherently uncertain, as they cannot fully account for unexpected market developments. Past performance is not a reliable indicator of future results.
Stellantis earnings: Q1 2026 results and Q2 2026 date
Stellantis reported its Q1 2026 financial results on 30 April 2026, marking the company's first quarterly profit disclosure after previously reporting only on a semi-annual basis (Stellantis, 30 April 2026). Net revenues reached €38.10bn, up 6% year-on-year, while consolidated shipments rose 12% to 1.40m units across all regions, led by North America (StockTitan/SEC Filing, 15 April 2026).
Adjusted operating income (AOI) returned to positive at €1bn, a 194% increase on the €327m recorded in Q1 2025, producing an AOI margin of 2.5%, up 160 basis points year-on-year, and exceeding the Reuters analyst consensus of €568m (CNBC, 30 April 2026). Net profit came in at €400m, compared with a net loss of €387m in the same period a year earlier (Stellantis, 29 April 2026).
Industrial free cash flow remained negative at €1.90bn, although this represented a 37% improvement versus Q1 2025 and reflected typical first-quarter seasonality (AlphaSense, 30 April 2026). Stellantis confirmed its 2026 full-year financial guidance, with management expecting sequential improvement in net revenues, AOI margin, and industrial free cash flow across the remaining quarters, with North America margins forecast to improve quarter by quarter throughout the year (Seeking Alpha, 30 April 2026).
The company's next scheduled earnings event is the Q2 2026 financial results release, confirmed for 30 July 2026, with Q3 2026 results scheduled for 28 October 2026, per the corporate calendar published by Stellantis on 13 January 2026 (Yahoo Finance UK, 13 January 2026).
STLAM stock price: technical overview
The STLAM stock price trades at €6.12 as of 4:48pm UTC on 15 June 2026, sitting below the full moving-average stack on the daily chart. The 20/50/100/200-day simple moving averages (SMAs) stand at approximately €6.40/€6.58/€6.62/€7.76, with price below all four levels. This indicates a bearish alignment across the near and longer-term moving-average structure.
The 200-day exponential moving average (EMA) runs at approximately €7.65, broadly in line with the 200-day SMA and reinforcing the overhead zone. The Hull moving average (9) at €5.79 sits below spot, per TradingView data.
Momentum readings remain soft. The 14-day relative strength index (RSI) registers 43.3, a lower-neutral reading that reflects subdued buying pressure without entering oversold territory. The average directional index (ADX) at 16.5 suggests the prevailing trend lacks strong conviction in either direction, per TradingView oscillator data.
On the topside, the classic R1 pivot at €7.37 represents the first notable reference above current levels. A daily close above that area would put the R2 level near €7.86 in view. To the downside, the classic pivot point (P) at €6.66 offers an initial reference, with S1 at €6.16 the next area on a sustained move lower (TradingView, 15 June 2026).
This is technical analysis for informational purposes only and does not constitute financial advice or a recommendation to buy or sell any instrument.
Stellantis share price history (2024–2026)
STLAM’s stock price was trading near €19.02 in mid-June 2024. By 15 June 2026, the stock had fallen to €6.12, a decline of approximately 67.8%.
The decline through the second half of 2024 was steep. The stock fell from around €14.58 on 27 September to €12.44 by month-end, coinciding with a profit warning and the abrupt departure of CEO Carlos Tavares in December. STLAM ended 2024 near €12.60, roughly one-third below its mid-year levels.
The sell-off continued into 2025. By January 2026, the stock had drifted to around €9.71, pressured by weak margins, North American inventory challenges, and suspended dividends. A sharper move followed in early February: between 5 and 6 February 2026, STLAM fell from €8.21 to €6.23 in a single session, a drop of around 24.1%, after the company reported a full-year 2025 net loss of approximately €8bn and suspended its dividend. The stock touched a two-year closing low of €5.67 on 23 March 2026.
A partial recovery followed the company’s FaSTLAne 2030 Investor Day on 21 May 2026, with STLAM rebounding to €7.10 on 27 May. Those gains have since faded. As of 15 June 2026, the stock is down approximately 37.0% year to date and 28.5% year on year.
Past performance is not a reliable indicator of future results. Share prices are indicative and may differ from live market prices.
Stellantis (STLAM): Capital.com analyst view
Stellantis enters the second half of 2026 at a pivotal juncture. The company’s €60bn FaSTLAne 2030 strategic plan, presented on 21 May 2026, targets revenue growth from €154bn to €190bn by 2030 and an adjusted operating income margin of 7%. The plan is supported by a €6bn cost-reduction programme.
Q1 2026 results offered early signs of stabilisation, with net revenues rising 6% year-on-year to €38.10bn and adjusted operating income returning to positive at €1bn. These developments followed a period of significant operational difficulty, but they do not remove the execution risks attached to the group’s medium-term targets. Investor sentiment remains cautious: shares fell close to 5% on Investor Day as markets weighed the ambition of the plan against the challenge of delivering it, while the consensus analyst rating as of late May 2026 remained Hold.
External headwinds add further complexity. President Trump’s announcement of a 25% tariff on EU auto imports, up from 15% under the Turnberry Deal, represents a material cost risk for Stellantis’s North American operations, which management has identified as the primary driver of margin recovery over the plan period. That said, the group’s ongoing shift towards regional manufacturing and local sourcing under FaSTLAne 2030 could, over time, reduce some exposure to cross-border tariff friction. The range of 12-month analyst price targets, from €4 to €12.50 as of May 2026, reflects uncertainty around both the pace and durability of any recovery.
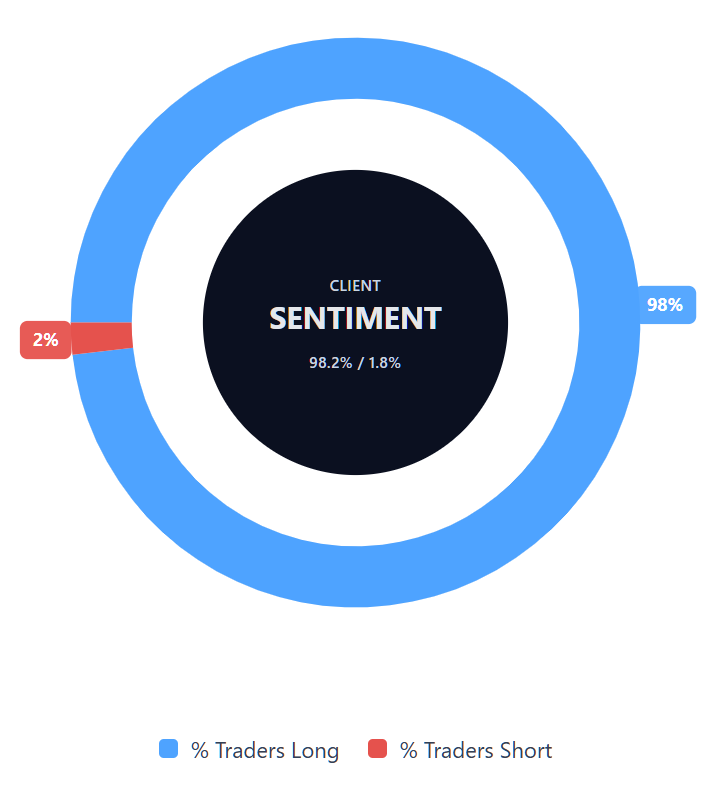
Capital.com’s client sentiment for Stellantis CFDs
As of 15 June 2026, Capital.com client positioning in Stellantis CFDs shows 98.2% buyers versus 1.8% sellers. That puts buyers ahead by 96.4 percentage points and places sentiment in heavy-buy, one-sided territory. This snapshot reflects open positions on Capital.com and can change.
Summary – Stellantis 2026
- STLAM trades at €6.12 as of 4:48pm UTC on 15 June 2026, down approximately 37% year to date and 67.8% over two years.
- The FaSTLAne 2030 plan targets €190bn in revenue and a 7% AOI margin by 2030, though markets reacted cautiously on Investor Day amid execution risk concerns.
- Q1 2026 adjusted operating income returned to positive at €1bn, up 194% year-on-year, with full-year 2026 guidance confirmed. Next results are due on 30 July 2026.
- A 25% US tariff on EU auto imports poses a material headwind for North American margin recovery, though the company’s localisation strategy under FaSTLAne 2030 may partially offset exposure over time.
Past performance is not a reliable indicator of future results.
FAQ
Who owns the most Stellantis stock?
What is the five-year Stellantis share price forecast?
Is Stellantis a good stock to buy?
Could Stellantis stock go up or down?
Should I invest in Stellantis stock?
Can I trade Stellantis CFDs on Capital.com?
Yes, you can trade Stellantis CFDs on Capital.com. Trading share CFDs lets you speculate on price movements without owning the underlying asset and to take long or short positions. However, contracts for difference (CFDs) are traded on margin, and leverage amplifies both profits and losses. You should ensure you understand how CFD trading works, assess your risk tolerance, and recognise that losses can occur quickly.