
AMD stock forecast: Q2 revenue, data centre growth
Advanced Micro Devices is a US semiconductor company. On 8 September 2026, AMD outlined a larger AI infrastructure opportunity at an investor presentation. Explore third-party AMD price targets and technical analysis. Past performance is not a reliable indicator of future results.
Advanced Micro Devices Inc (AMD) traded at $506.18 as of 2:22pm UTC on 10 September 2026, within the session’s $497.45–$525.47 intraday range. Past performance is not a reliable indicator of future results.
The shares followed an 8 September presentation in which AMD outlined a larger AI infrastructure opportunity (TradingView, 8 September 2026). A day later, AMD gained 3% while the Philadelphia Semiconductor Index rose 0.37%, despite broader US equity weakness as oil moved above $100 a barrel and Treasury yields climbed (Reuters, 9 September 2026).
Third-party AMD outlook: AI market expansion
As of 10 September 2026, third-party AMD stock predictions reflect different assumptions around AI infrastructure demand, data-centre growth, product execution and earnings rather than forecasts for the AMD CFD price.
BMO Capital Markets
BMO Capital Markets initiates coverage with an outperform rating and $550 target. The firm bases its view on expected AI-related growth, with AMD’s data-centre opportunity among its stated considerations (MarketBeat, 6 September 2026).
MarketBeat
MarketBeat reports a consensus rating of moderate buy and an average target of $553.72, based on 46 covering research firms. Individual estimates reflect differing assumptions around semiconductor demand and AMD’s execution (MarketBeat, 4 September 2026).
Raymond James
Raymond James upgrades AMD to strong buy and raises its target to $641 from $565. The revision follows the firm’s updated assessment of AMD’s semiconductor business mix and operating performance (MarketBeat, 6 September 2026).
Roth MKM
Roth MKM maintains a buy rating and sets a $650 target, reflecting its forward valuation of the company at the time (TechStock², 20 August 2026).
CLSA
CLSA raises its AMD target to $710 from $575 and maintains an outperform rating. The firm links the revision to its assumptions for MI455 GPU shipments and average selling prices (Asset Management News, 9 September 2026).
Predictions and third-party forecasts are inherently uncertain, as they cannot fully account for unexpected market developments. Past performance is not a reliable indicator of future results.
Advanced Micro Devices latest earnings and next report
Advanced Micro Devices reported second-quarter 2026 results on 4 August for the quarter ended 27 June. Revenue rose 50% year on year and 13% sequentially to $11.5bn. GAAP gross margin was 54%, operating income was $2.0bn, net income was $2.3bn and diluted earnings per share were $1.38.
On a non-GAAP basis, gross margin was 56%, operating income was $3.1bn, net income was $2.8bn and diluted earnings per share were $1.66. Data Center revenue reached $6.7bn, up 107% year on year, supported by higher sales of EPYC processors and Instinct GPUs. Client and Gaming revenue was $3.8bn, up 6% year on year, while Embedded revenue was $977m, up 19%.
For the third quarter, AMD guided for revenue of around $13bn, plus or minus $300m, and a non-GAAP gross margin of around 56% (AMD, 4 August 2026).
As of 10 September 2026, the company had not announced a date for its next earnings release.
Higher data-centre sales or results in line with guidance could support earnings expectations, while weaker demand, margin pressure or execution issues could weigh on them. AMD’s guidance is a forward-looking estimate and may differ from reported results.
Advanced Micro Devices stock price: technical overview
As of 2:22pm UTC on 10 September 2026, the AMD stock price AMD traded at $506.18, within the session’s $497.45–$525.47 range. The price sat above its 20-, 50-, 100- and 200-day simple moving averages at around $481, $497, $474 and $345 respectively. The 200-day exponential moving average was also lower at around $378.
The 14-day relative strength index (RSI) stood at 56.01, within neutral territory, while the average directional index (ADX) at 11.66 suggested limited trend strength. Stochastic %K at 87.03, stochastic RSI fast at 91.80 and the commodity channel index at 124.45 sat towards the upper ends of their respective ranges.
Above the current price, R1 at $516.90 and the Hull moving average near $518.08 provide the closest references, followed by the session high of $525.47 and R2 at $563.08.
Below the market, the classic pivot at $483.95 sits near the 20-day SMA at $480.54. The 100-day SMA at $473.75 provides another lower reference, followed by S1 at $437.77. A rise could bring $516.90–$525.47 into focus, while a decline could shift attention towards $483.95 and $473.75, followed by $437.77 (TradingView, 10 September 2026).
This is technical analysis for informational purposes only and does not constitute investment advice or a recommendation to buy or sell any instrument.
AMD share price history (2024–2026)
AMD’s stock price traded around $149.31 on 11 September 2024 before moving above $170 in early October and reaching $175.04 on 9 October. The stock then declined through the final quarter, closing 2024 at $120.59.
AMD began 2025 near $120.76 and fell to $76.25 on 8 April before recovering through the second quarter. It closed June at $141.48, moved above $180 in August and ended the year at $214.24. The period included notable moves around company updates and broader semiconductor-sector developments.
In 2026, AMD fell to $187.84 on 5 February before rising from $193.85 on 30 March to $325.95 on 28 April. The advance continued through May and June, with the shares closing at $579.55 on 30 June after reaching an intraday high of $584.77.
AMD later fell as low as $441.06 in early September before closing at $506.34 on 10 September 2026, around 239.1% above its 11 September 2024 close.

Past performance is not a reliable indicator of future results. Share prices are indicative and may differ from live market prices.
AMD (Advanced Micro Devices): Capital.com analyst view
AMD’s share price has moved over a wide range in 2026, rising from $193.85 on 30 March to $579.55 on 30 June before returning to $506.18 by 10 September. Second-quarter revenue reached $11.5bn, including $6.7bn from Data Center, while management guided for around $13bn of third-quarter revenue.
These figures help explain the focus on AI accelerators and server processors, although guidance remains an estimate rather than a guaranteed outcome.
Higher data-centre demand, stronger AI accelerator sales or delivery against management guidance could support revenue expectations and sentiment. Weaker customer spending, greater competition, supply constraints, export restrictions or margin pressure could weigh on them. Wider technology-sector valuations may also influence AMD independently of company-specific results.
The move from an intraday high of $584.77 on 30 June to $441.06 on 3 September illustrates how quickly expectations around AMD can shift in either direction.
Capital.com’s client sentiment for AMD CFDs
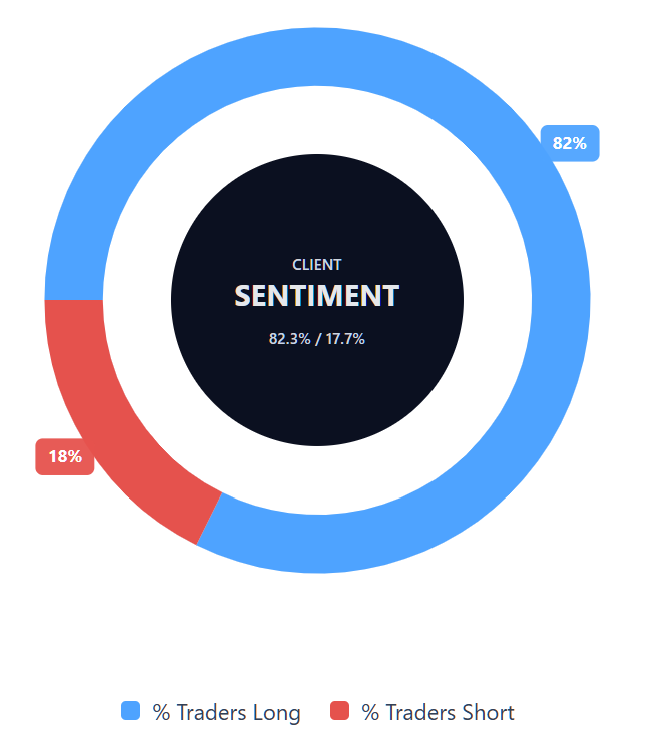
As of 10 September 2026, Capital.com client positioning in AMD CFDs shows 82.3% of open positions on the buy side and 17.7% on the sell side. The 64.6-percentage-point gap shows a clear long skew as clients weigh AI demand, earnings expectations and semiconductor-sector conditions. It does not indicate how AMD may trade next, and positioning can change.
Summary – AMD 2026
- At 2:22pm UTC on 10 September 2026, Advanced Micro Devices traded at $506.18, within an intraday range of $497.45–$525.47.
- According to TradingView data, AMD traded above its 20-, 50-, 100- and 200-day simple moving averages, while RSI stood at 56.01 and ADX at 11.66.
- Second-quarter revenue reached $11.5bn, including $6.7bn from Data Center, while management guided for around $13bn of third-quarter revenue.
- Key influences include AI accelerator and data-centre demand, semiconductor competition, customer spending, supply conditions, export restrictions and wider technology-sector valuations.
- Stronger AI demand or execution could support the outlook, while weaker spending, competition, supply constraints or margin pressure could weigh on it.
Past performance is not a reliable indicator of future results.
FAQ
Who owns the most AMD stock?
What is the five-year AMD share price forecast?
Is AMD a good stock to buy?
Could AMD stock go up or down?
Should I invest in AMD stock?
Can I trade AMD CFDs on Capital.com?
Yes, you can trade AMD CFDs on Capital.com. Trading share CFDs lets you speculate on price movements without owning the underlying asset and to take long or short positions. However, contracts for difference (CFDs) are traded on margin, and leverage amplifies both profits and losses. You should ensure you understand how CFD trading works, assess your risk tolerance, and recognise that losses can occur quickly.