Retail-investor quarterly trading trends
Analysis of Q1, 2022 trading data from Capital.com.
Across the markets
The Capital.com platform permits investors to trade more than 5,000 different instruments across many different markets: stocks and shares, exchange-traded funds, currencies, commodities, indices and cryptocurrencies. (Cryptocurrencies are not available to Retail clients resident in the UK.) Capital.com has group entities located in the UK, Cyprus and Australia that are authorised and regulated by the Financial Conduct Authority, the Cyprus Securities and Exchange Commission and the Australian Securities and Investments Commission respectively.
Traders around the world
More than three million people have applied for an account with Capital.com.
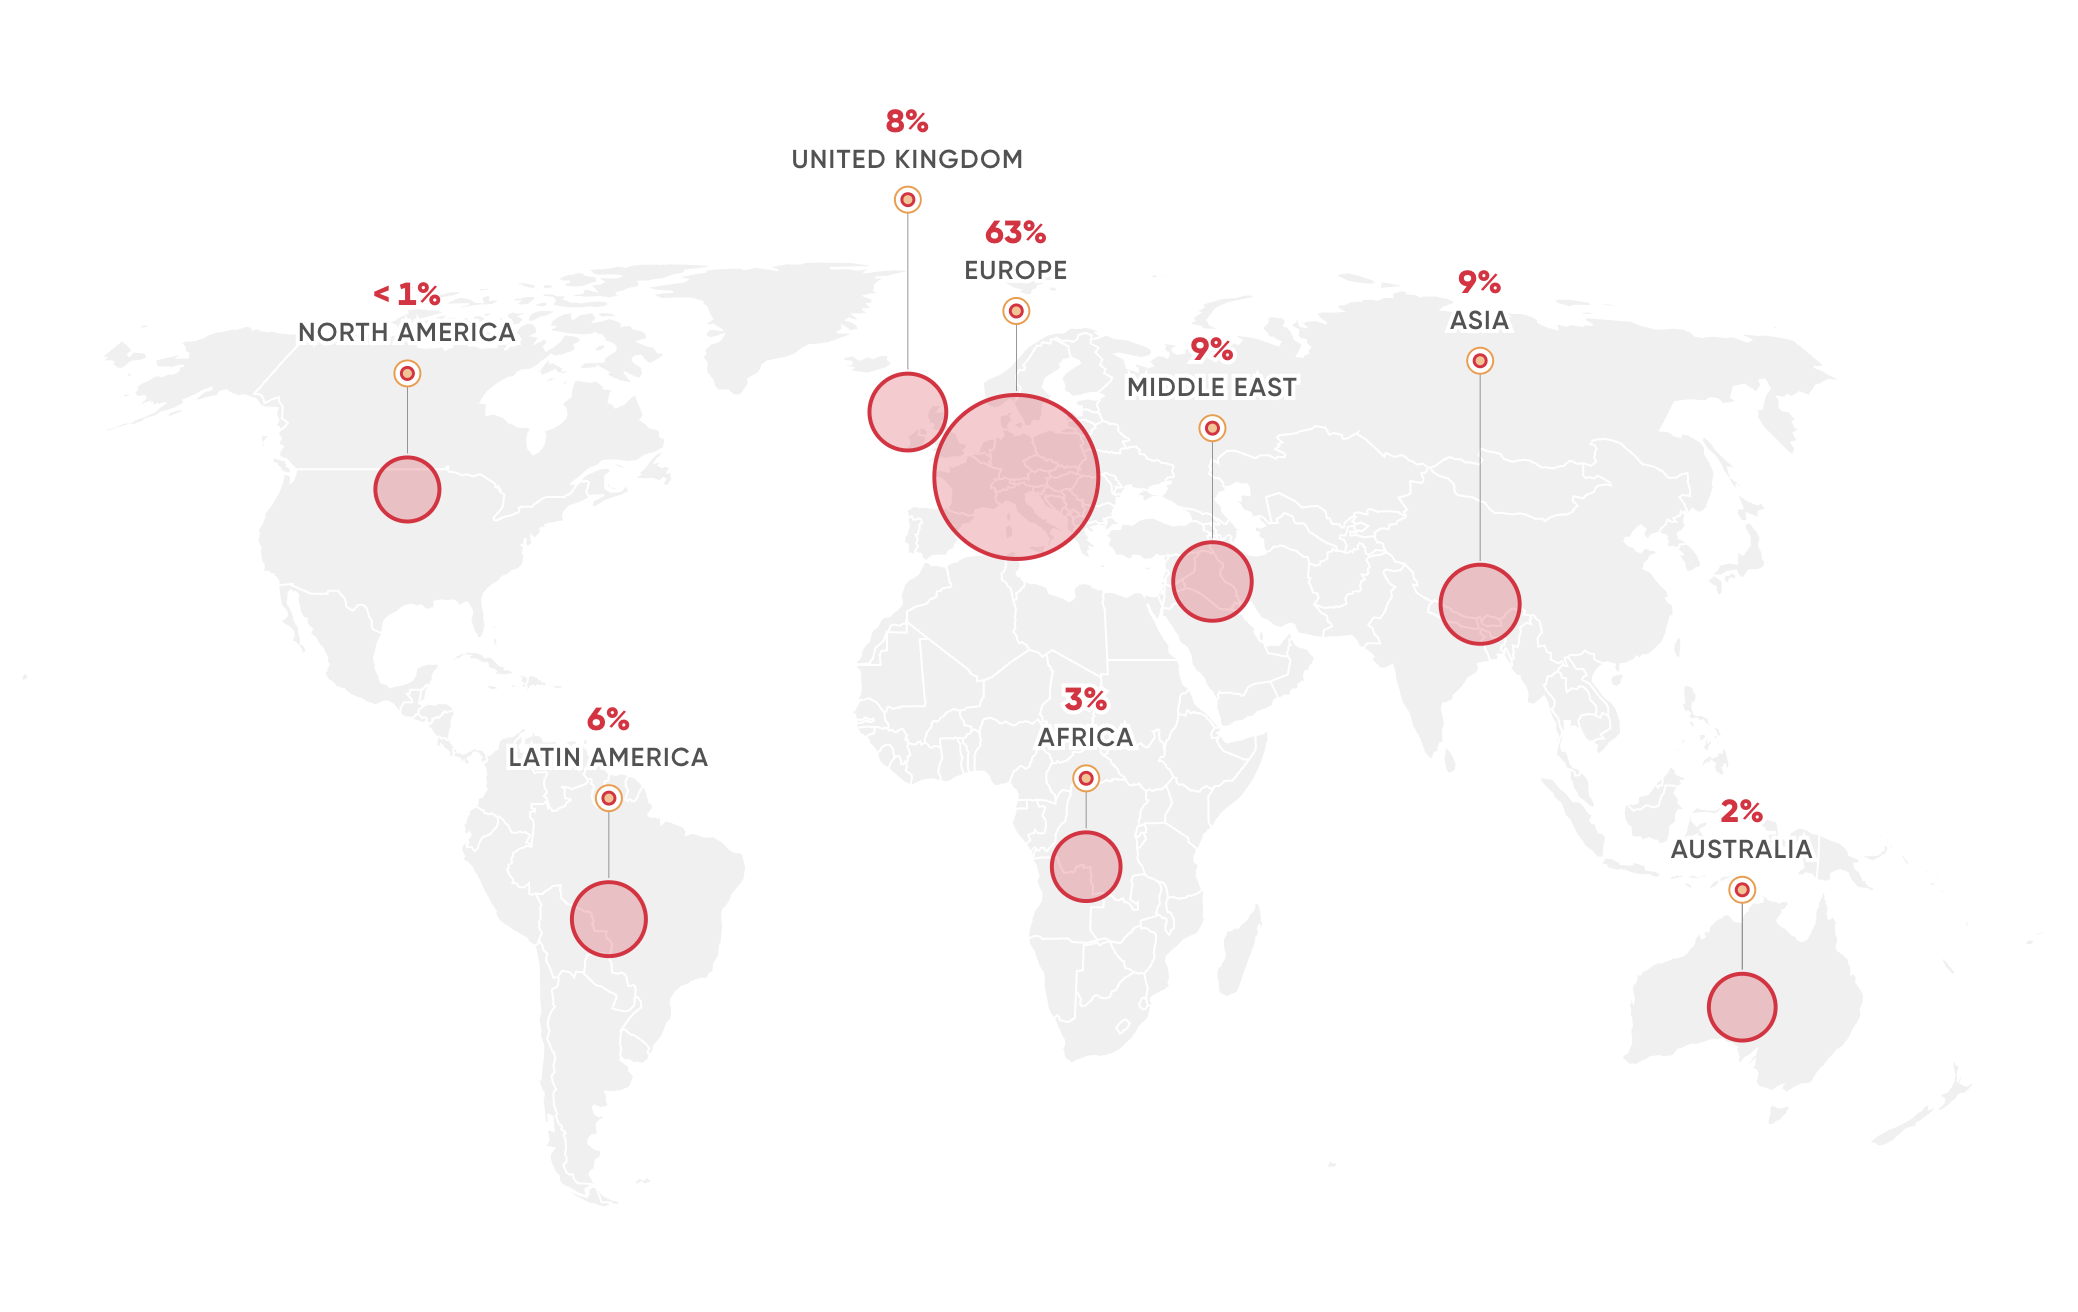
Some 13% of traders are female, though this proportion varies considerably with location. The behaviour of female traders differs significantly from that of males (see Women in trading, below).
In 2021, Capital.com reported trading volumes in excess of $560bn.
Highlights from this report
Selected key insights drawn from the trading data in Q1 2022:
- Retail traders across all Capital.com group entities, with clients located around the world, have surged into commodities since the start of the year, with a major spike in activity as Russia invaded Ukraine. The top-three commodities traded were oil, gold and natural gas.
- Traders have shown increased interest in stocks and shares, particularly those of tech companies.
- Cryptocurrencies (not available to Retail clients resident in the UK), by contrast, have declined in popularity.
- The Nasdaq 100 index was the most traded asset of the last quarter, followed by US crude oil and bitcoin (not available to Retail clients resident in the UK).
- Trading volume across all assets climbed to a new record despite the climate of heightened risk, up by 33% from the previous three months.
Capital.com data trends suggest that retail traders have responded nimbly to world events, switching markets as required to apply their personal insights into the issues.
Capital.com chief analyst David Jones comments:
Key themes
Traders shifted into commodities
The most striking retail-trading theme of the first quarter was a broad investor move into commodities, as prices of everything from crude oil to metals and grains rallied to multi-year highs. The number of traders in commodities increased by 66% from December to March.
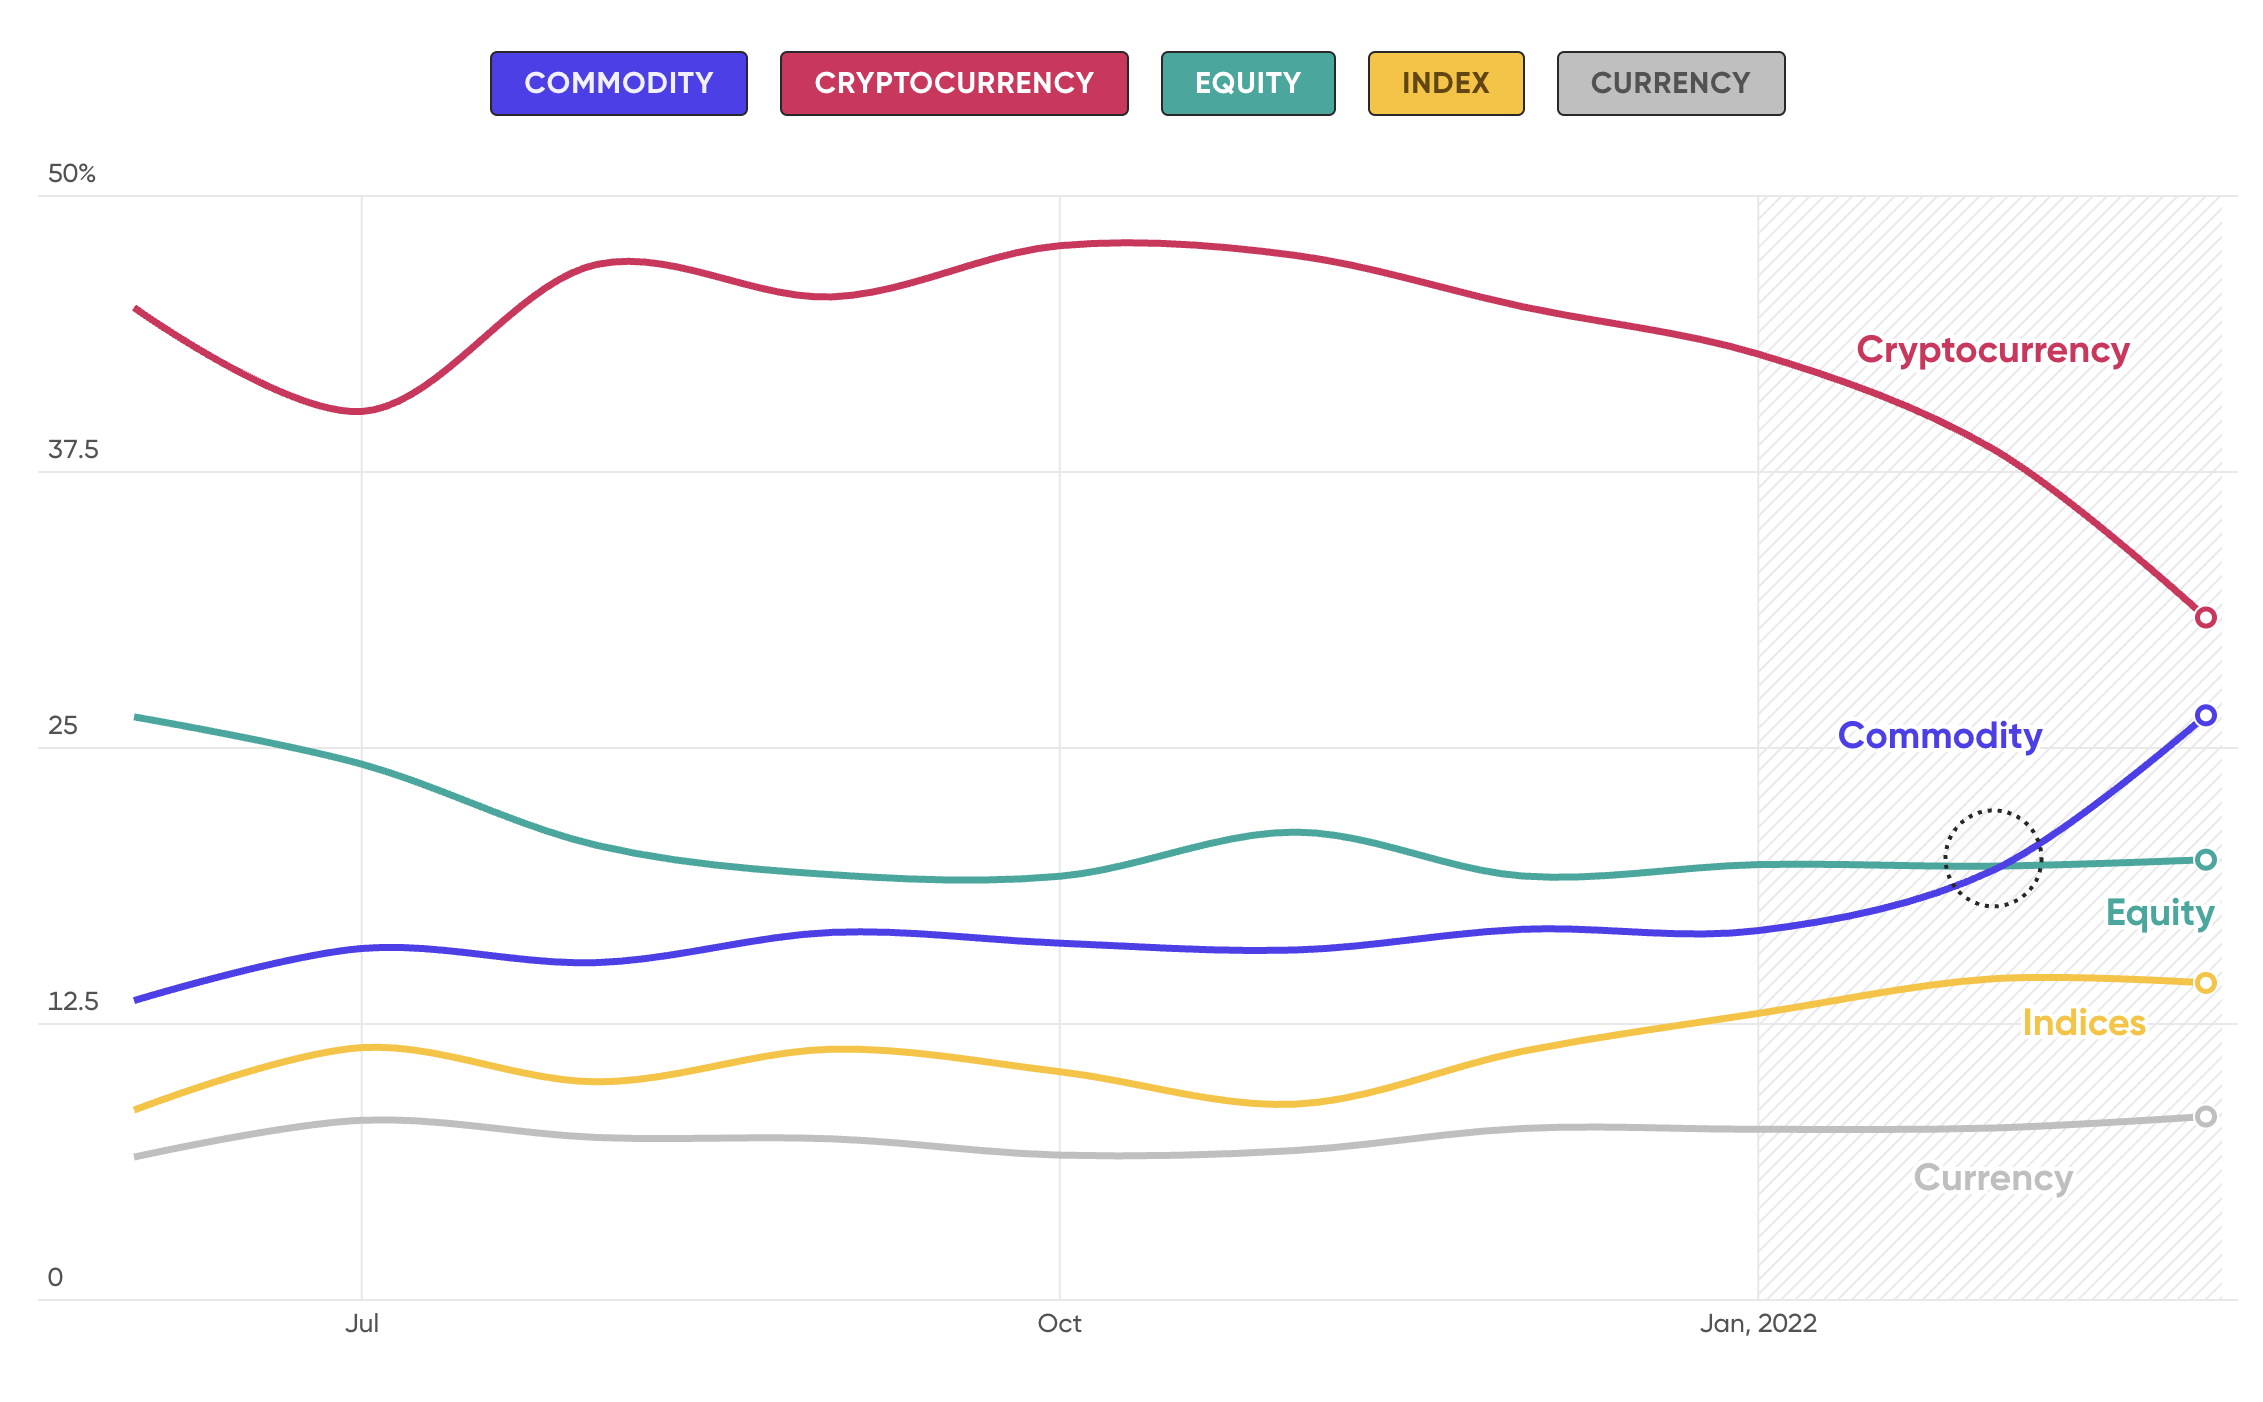
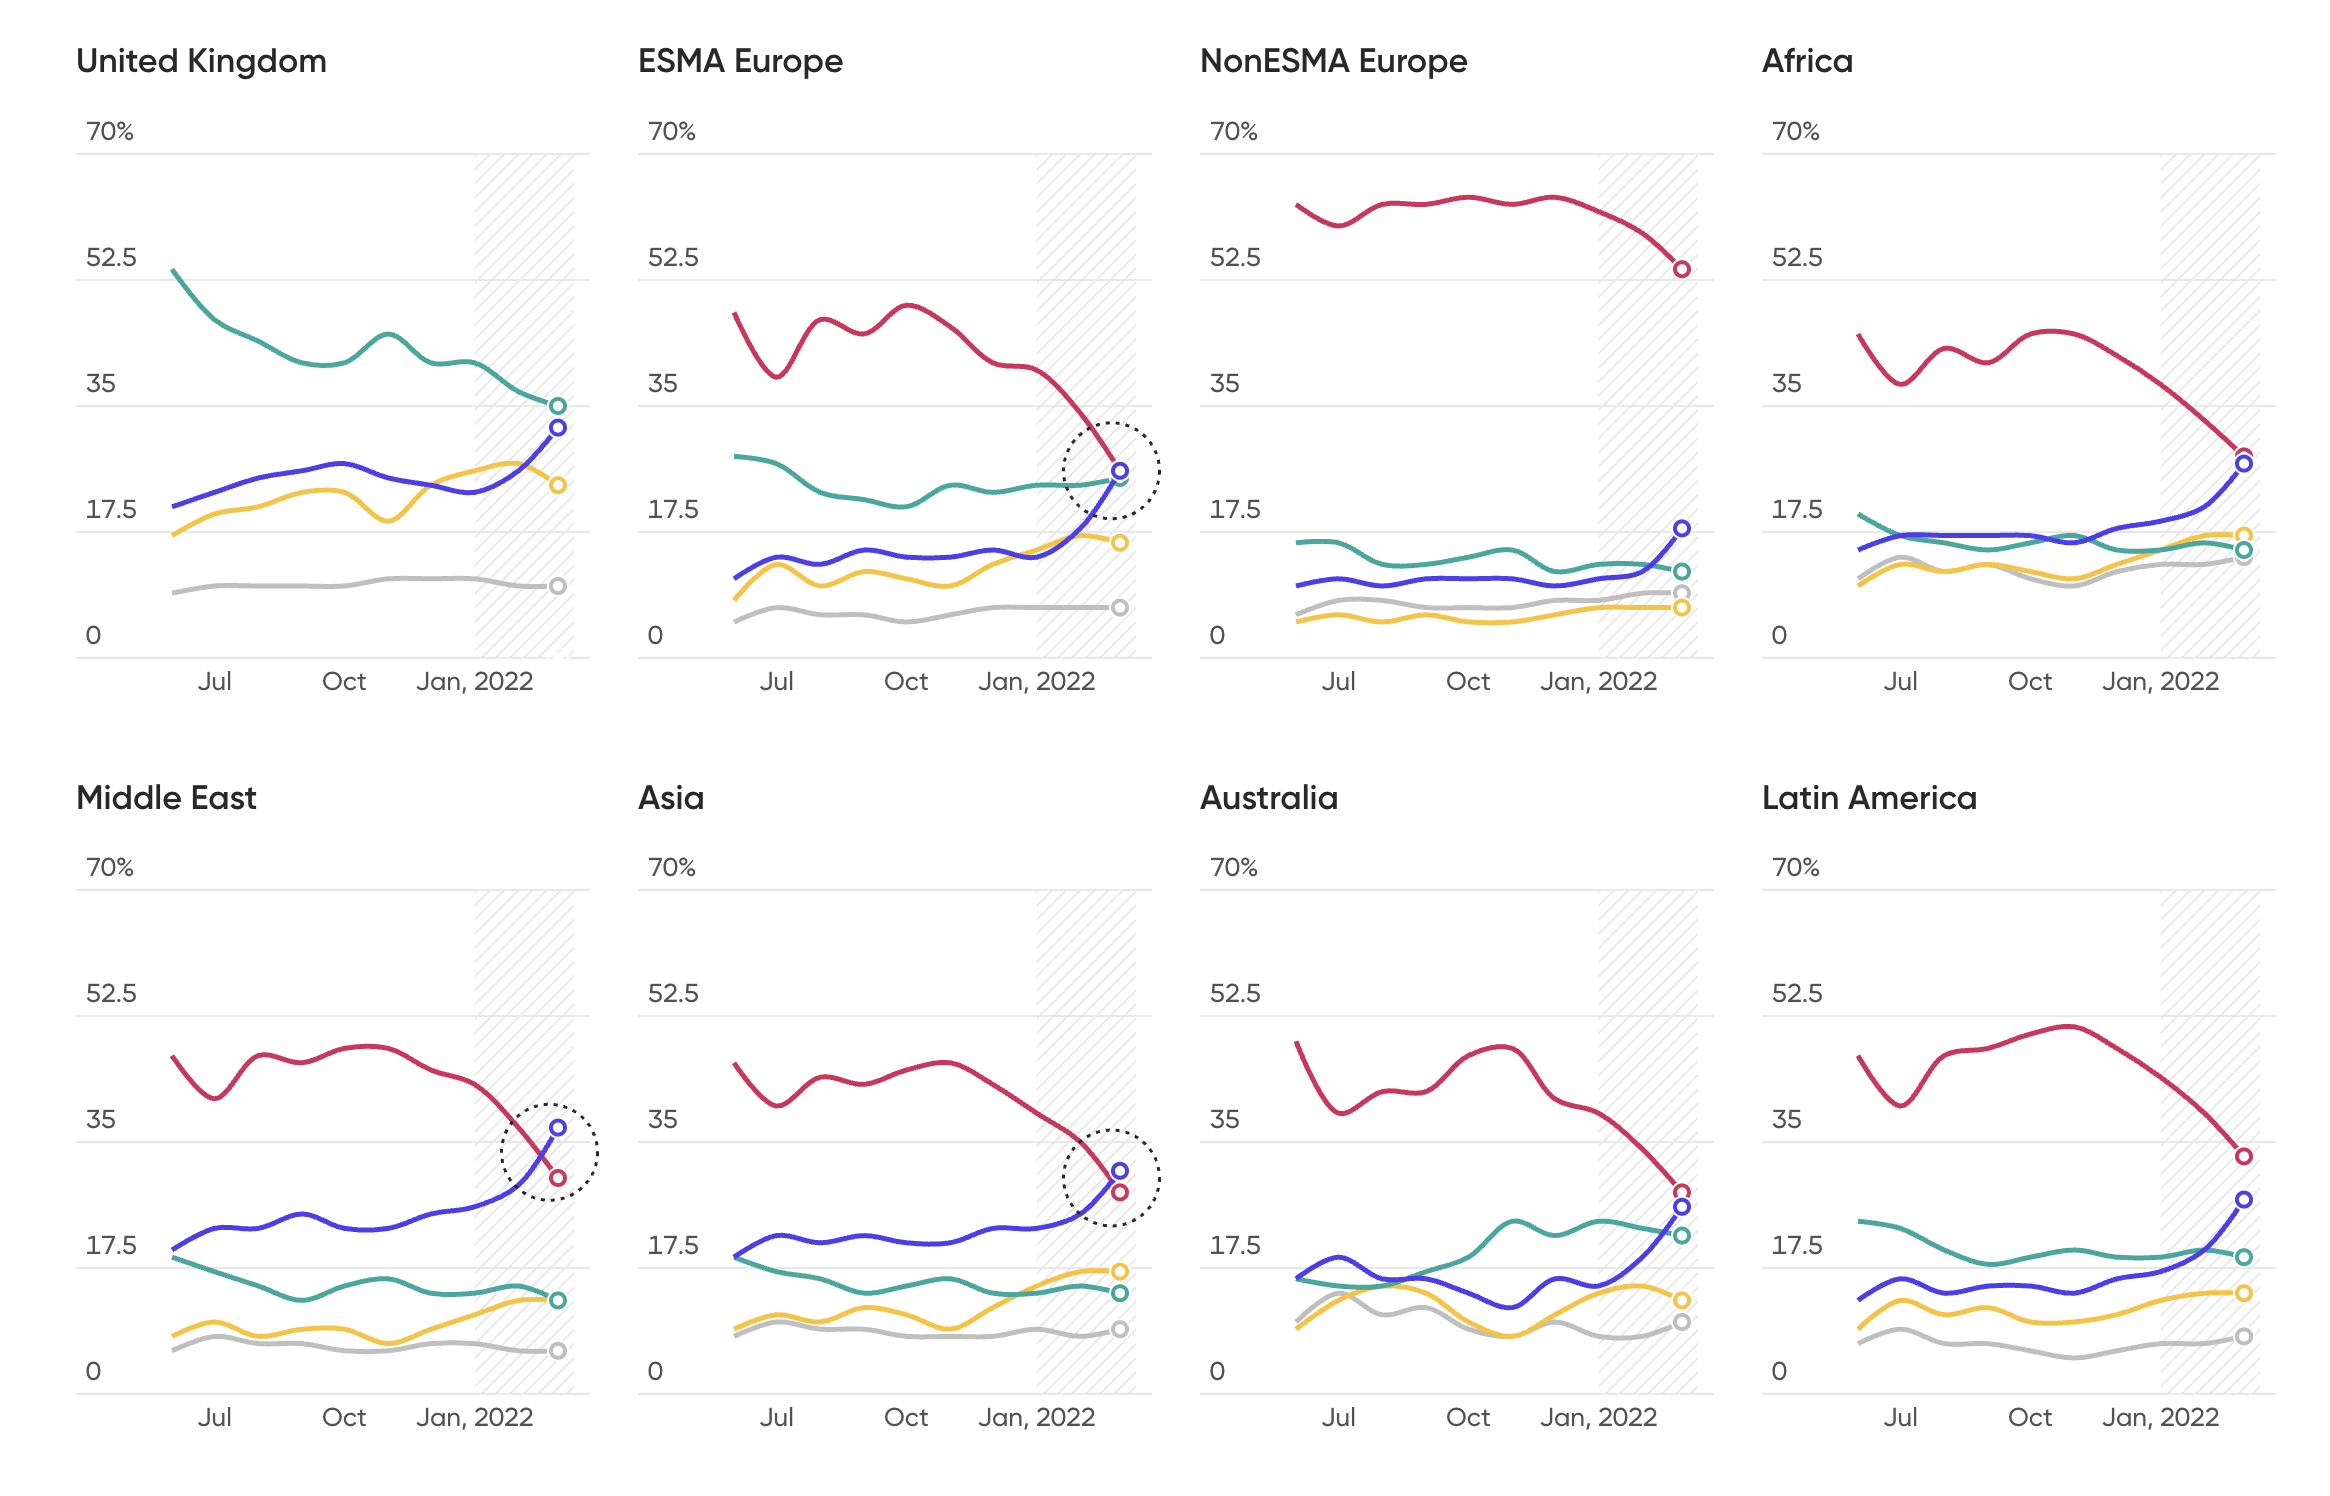
The number of commodity traders surpassed crypto CFDs in multiple regions
Percentage of total traders over the last 3 quarters.
The trend accelerated from late February as the crisis in Ukraine threatened long-term supply disruptions in commodities. Oil prices hit a 14-year peak at $130 per barrel before falling back, while the prices of metals from nickel to silver and palladium surged. Other commodities such as wheat also saw significant rises, understandably as Ukraine is a major grain producer.
Here are some details of the strongest retail-investor trend of 2022 so far:
- Investor participation in commodities climbed 29% in March, after a 21% rise in February and a 6% increase in January.
- Commodity transactions as a proportion of total trade nearly doubled to 41% in March compared to February.
- The number of commodity traders on Capital.com increased by 66% from December 2021 to March 2022.
- The absolute number of commodity trades jumped 85% in March, after an 18% increase in February and a 10% gain in January.
- Trades in crude oil alone jumped 174% in the first quarter.
- The most traded commodity of the period was crude oil, with more than twice as many transactions as gold (the second-most traded commodity).
- Commodities had the biggest influx of traders over the two weeks after the invasion of Ukraine began on 24 February.
Commodities have ended the dominance of cryptocurrencies (not available to Retail clients resident in the UK) in trader participation. In January, the top five assets by number of traders were all cryptocurrencies. But in March, three were commodities – with US crude oil ranking first. Gold and natural gas were at fourth and fifth, respectively.
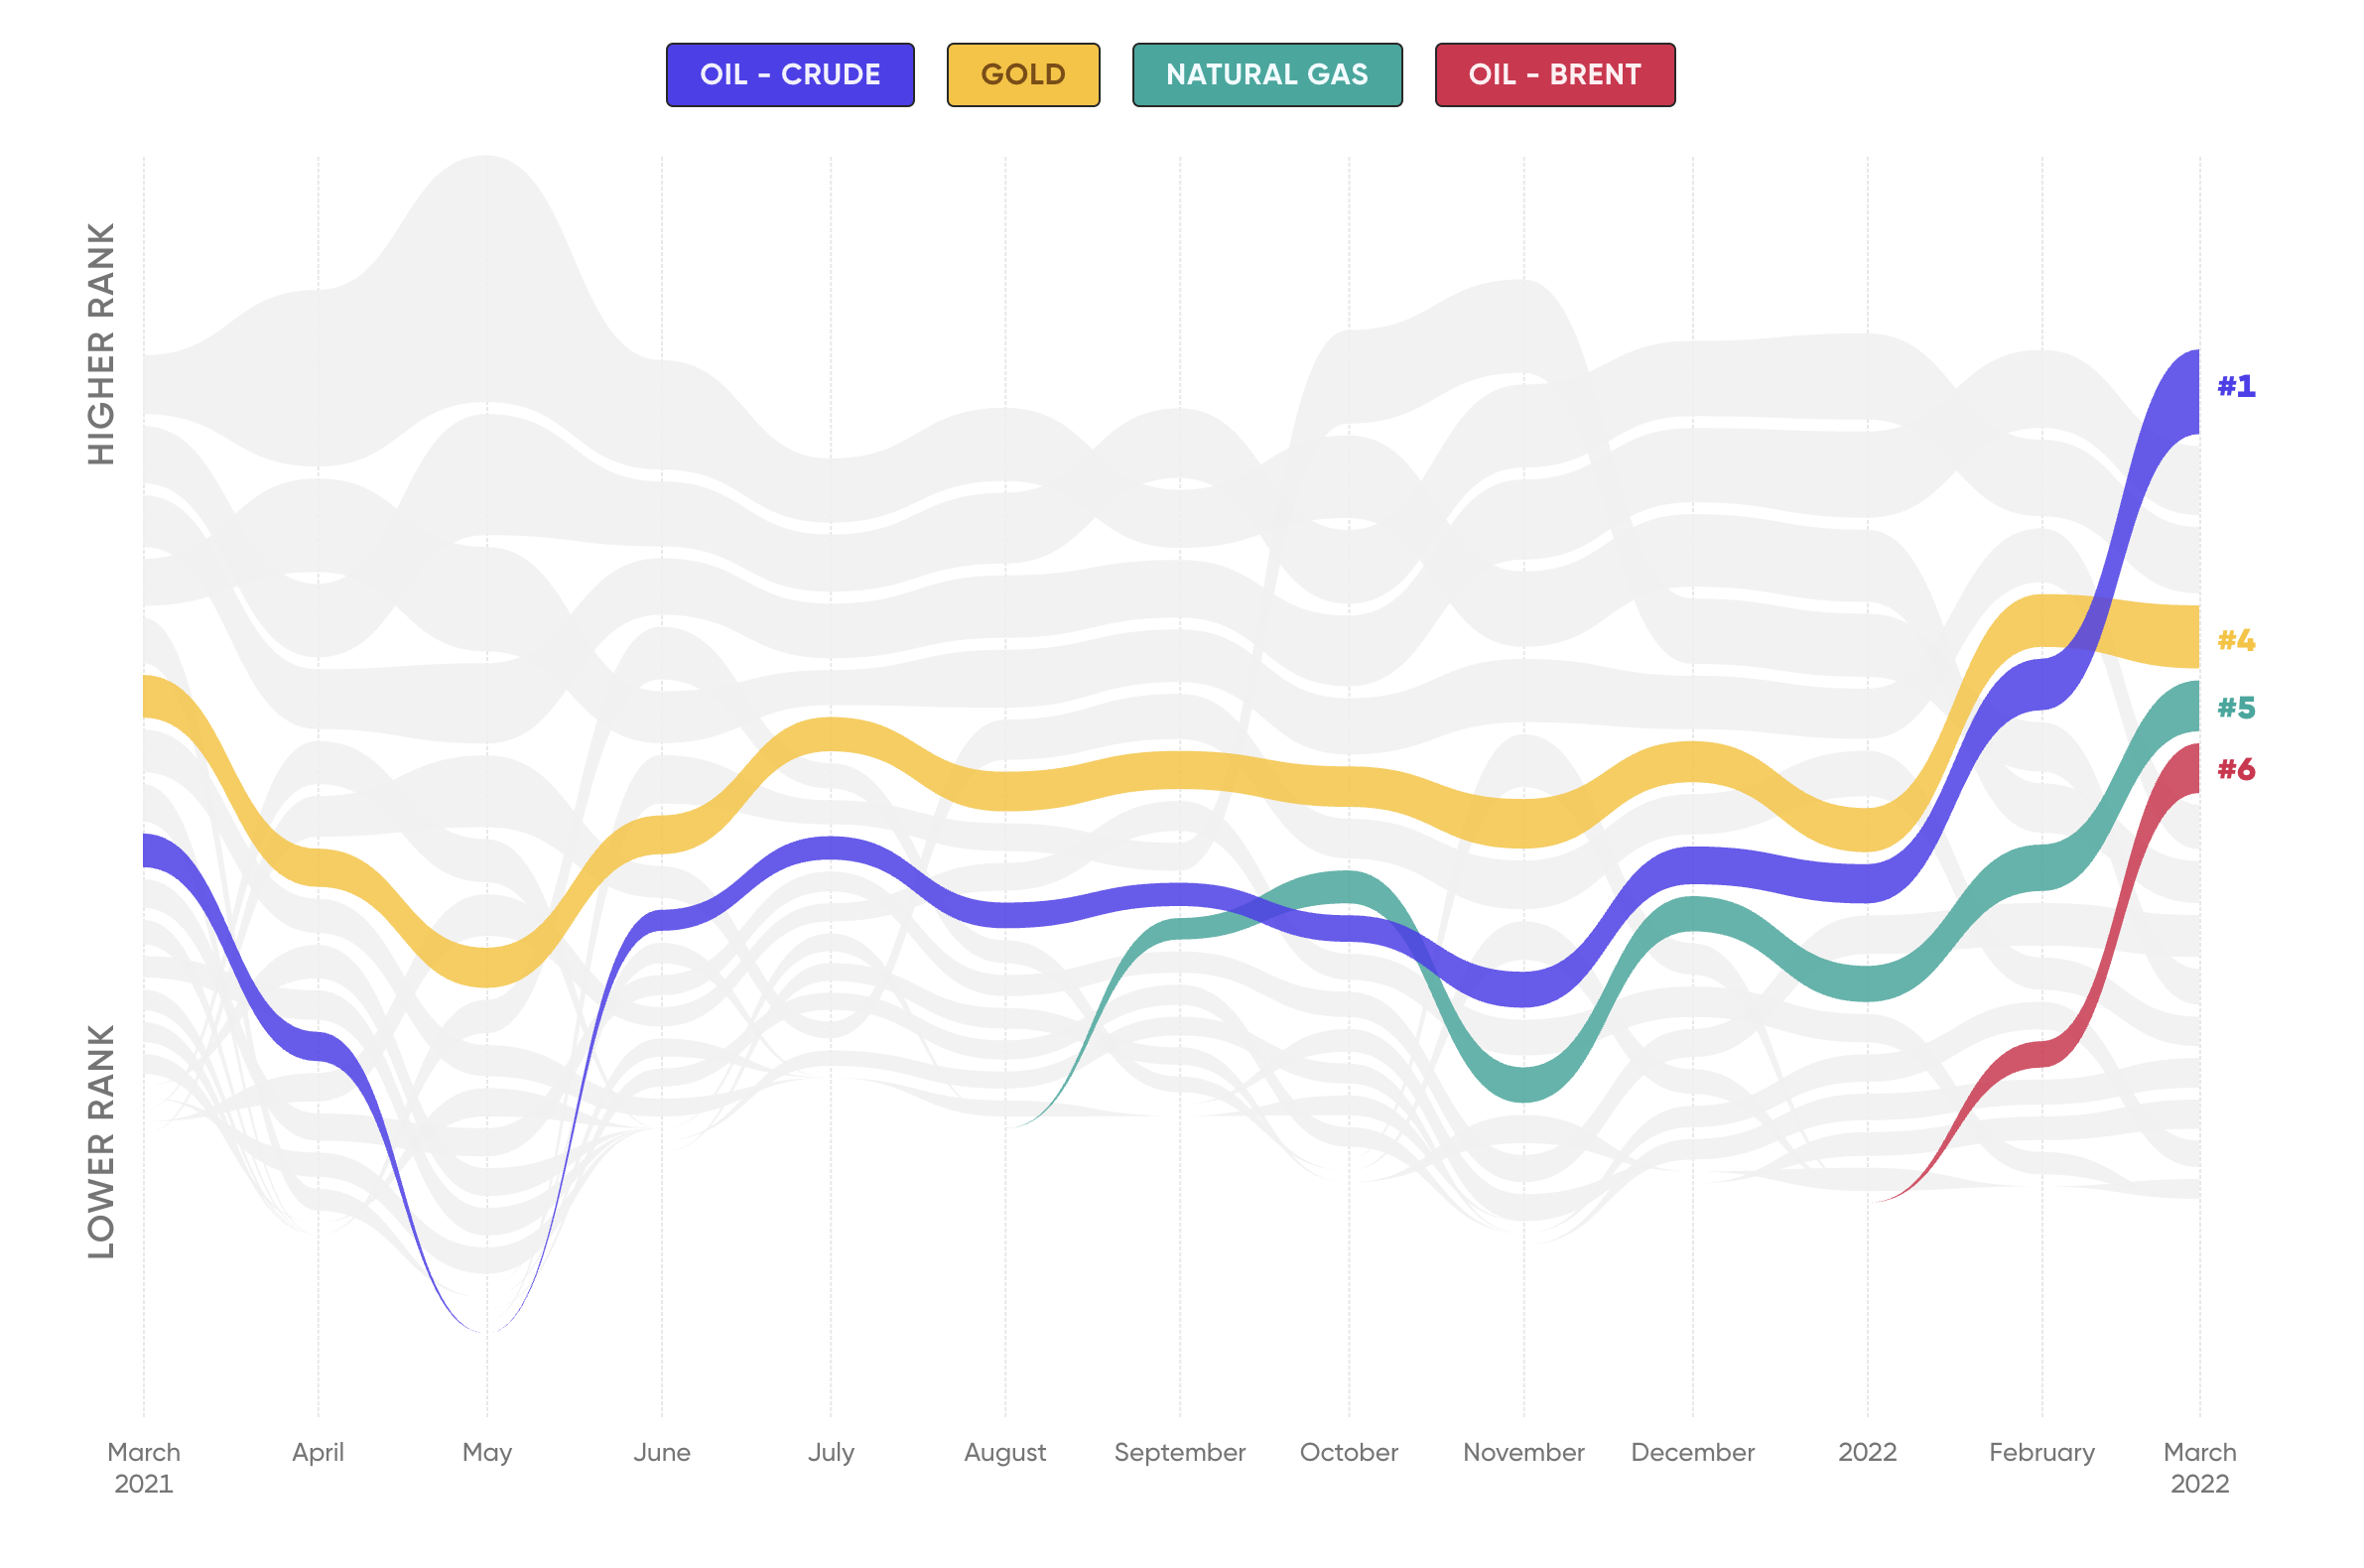
Crude oil is the most popular instrument as of March, 2022
Rank of the top 15 most popular instruments by number of traders over the last 12 months. Line thickness represents the absolute number of traders.
The increased interest in commodities comes at a time when technology and meme stocks, last year’s darlings of the trading world, have taken a beating. Tech stocks were battered last quarter as inflation in advanced economies hit levels unseen in decades, forcing central banks including the Federal Reserve and the Bank of England to raise interest rates. Meme stocks seemed to lose some of their shine, with a slowdown in trading volumes.
The investor migration into commodities appeared to be in direct correlation with the recent upbeat price action in these markets, which suggests the world may be entering a so-called commodity supercycle. Furthermore, the recent buoyancy in raw-material prices may have appealed to traders looking to sidestep increased volatility in equities and cryptocurrencies (not available to Retail clients resident in the UK).
Capital.com chief analyst David Jones comments:
Medium and big tech
The so-called meme stocks that shot into the limelight last year, such as GameStop and AMC Entertainment, were less attractive to retail investors in the first quarter of 2022, compared to the frenzy of 2021.
By contrast, companies with a stronger focus on Cloud-based technology activity and software – such as Autodesk, Meta Platforms, Microsoft, Matterport, Cloudflare, Roblox, Shopify and Unity Technologies – drew considerable interest. Investor participation in these tech stocks rose 26% over the quarter.
Cloud-based tech stocks drew considerable increase in investor participation
Percent change in the number of traders from Q4 2020 to Q1 2021 for the top tech companies by market cap and top meme stocks by Reddit mentions.
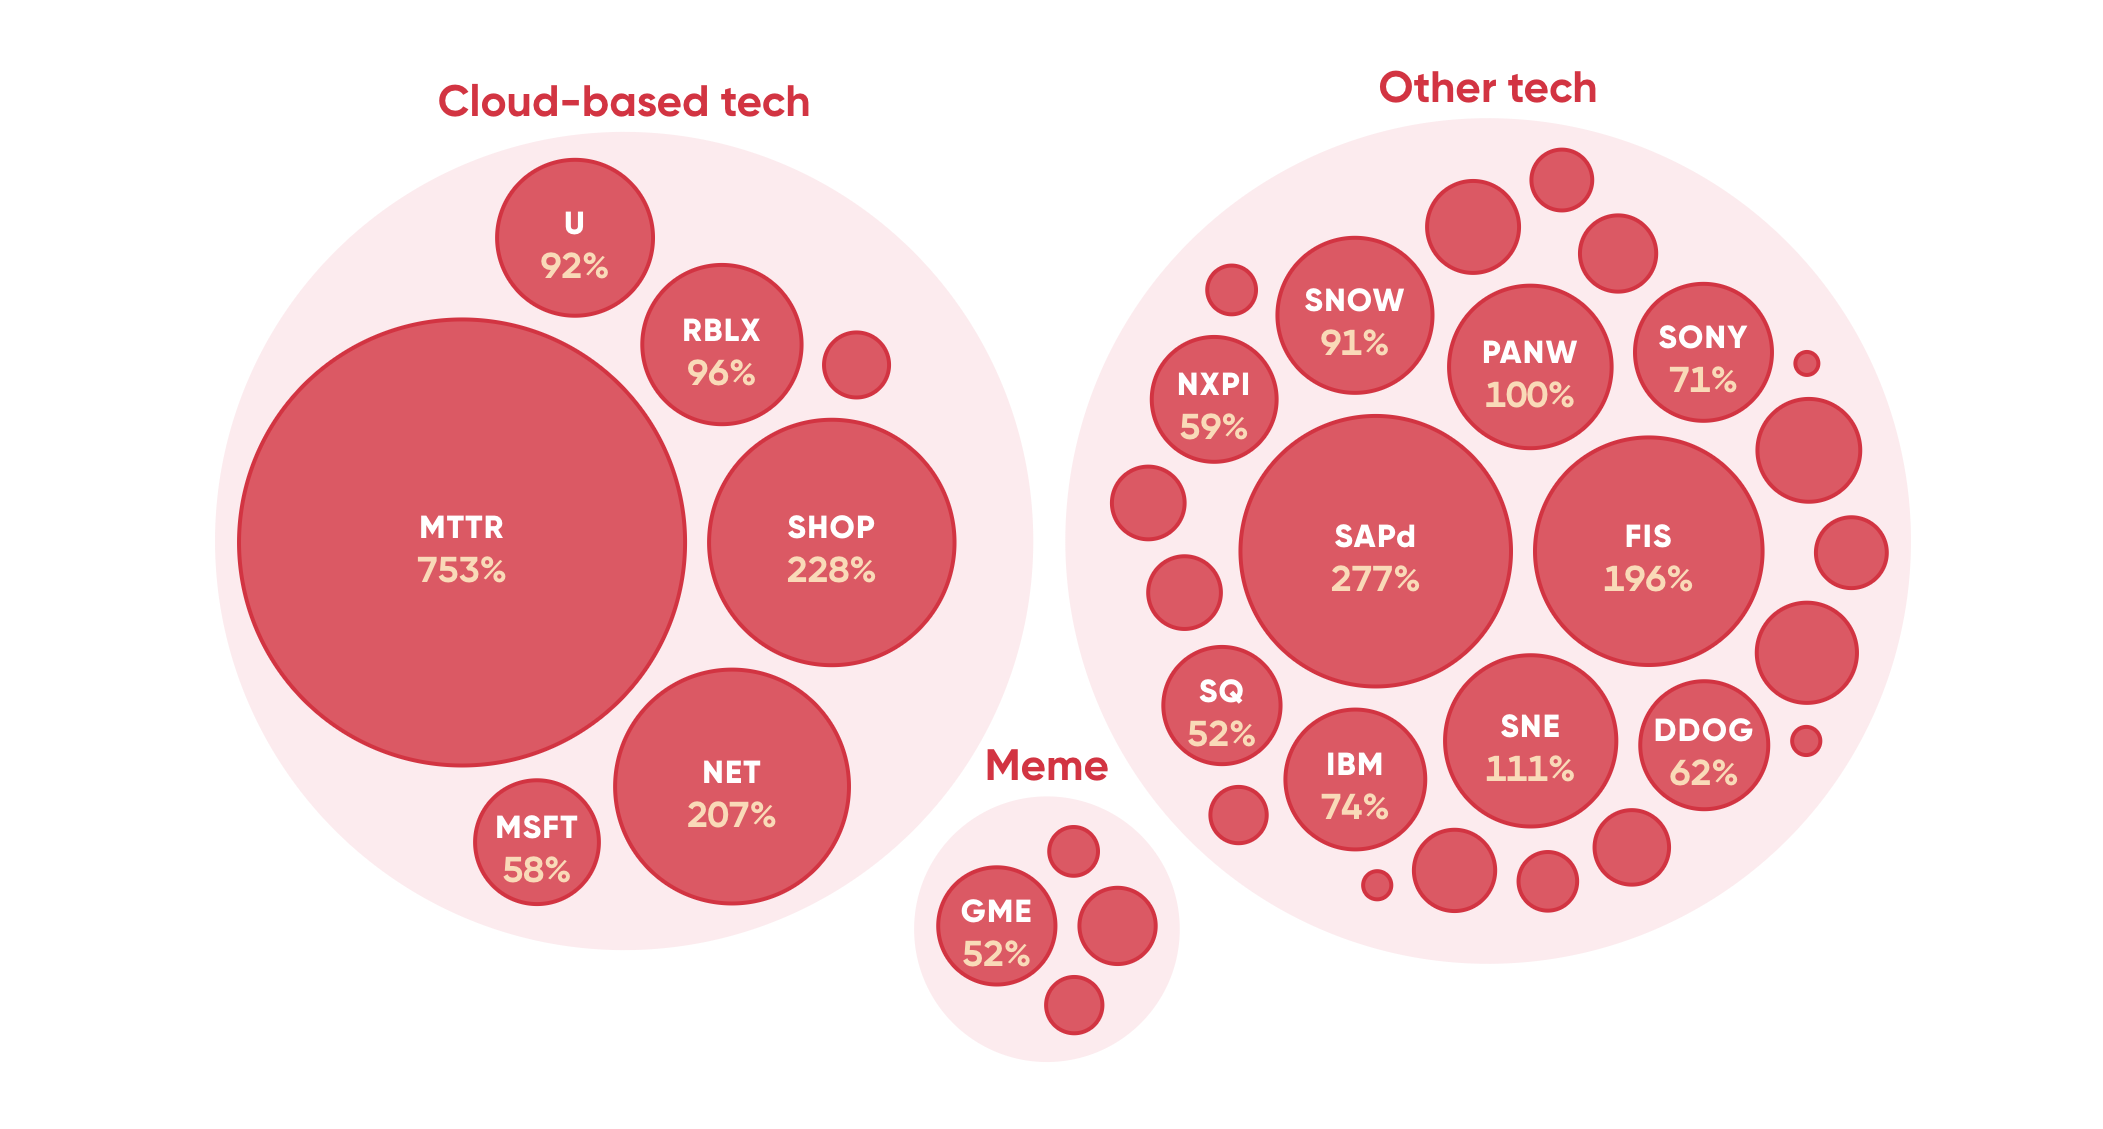
Selected data points:
- Matterport saw the biggest gain in the number of traders last quarter, at 753%.
- Shopify had a 228% increase in participation, followed by Cloudflare with a 207% rise and Roblox at 96%.
- Meta Platforms, the parent of Facebook and WhatsApp, saw the most significant single-day increase with a 768% jump in the number of retail traders on 3 February.
- Trades in tech and metaverse stocks as a proportion of all equity transactions climbed to 12% in the first quarter of 2022, from 5.6% in the December quarter and 1.8% in the prior three months.
Nevertheless, widespread market gloom had its effect on retail traders even among tech companies. Long positions in these shares dropped by 16 percentage points during the period. Bullish positions in Unity Software fell 30 percentage points, while those in Microsoft and Meta Platforms declined by 18 points each. Autodesk was the only stock that saw an increase in long positions last quarter.
Capital.com chief analyst David Jones comments:
The Ukraine crisis
The rush into commodities wasn’t the only notable impact from the Ukraine crisis on retail-trading behaviour. The conflict triggered frenzied trading activity in many areas, especially during the initial days, as investors appeared to chase volatility.
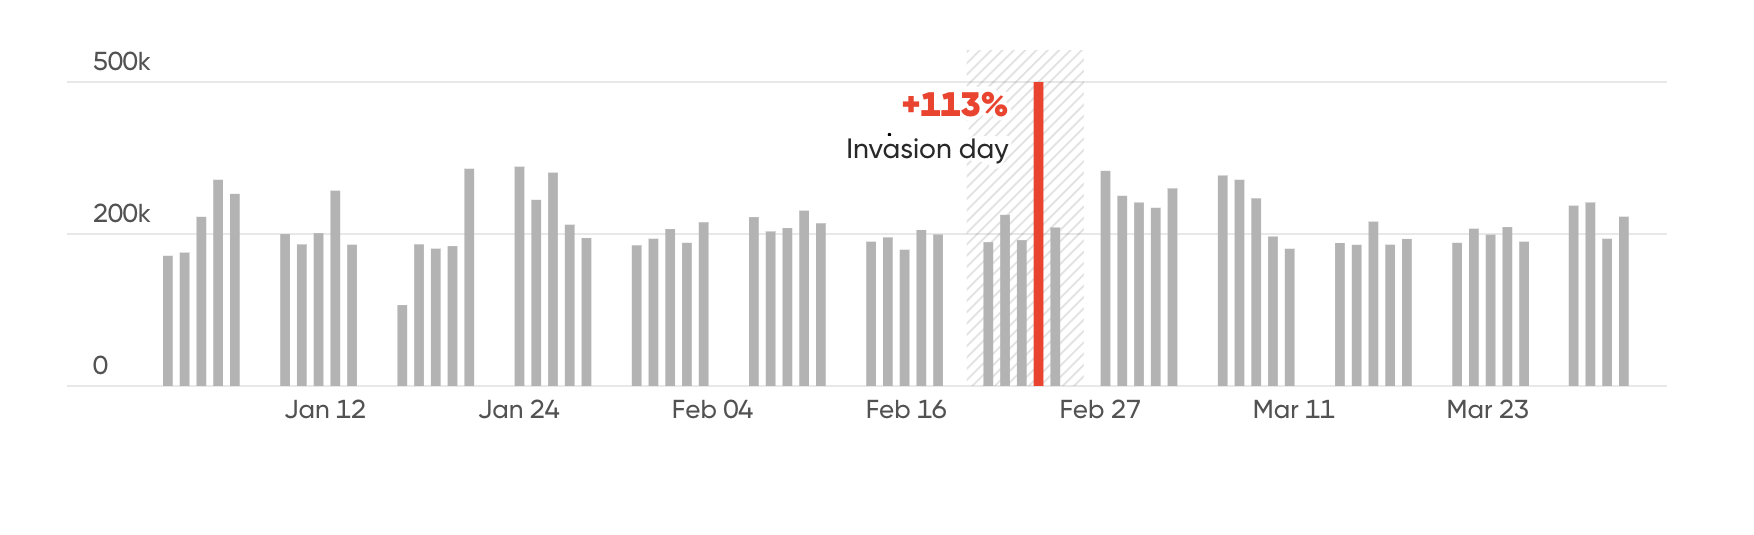
The number of traders across all asset classes surged 72% on 24 February, the day the invasion started. The total number of transactions skyrocketed by 113% on that day.
Number of trades surged on the first day of the Ukraine war
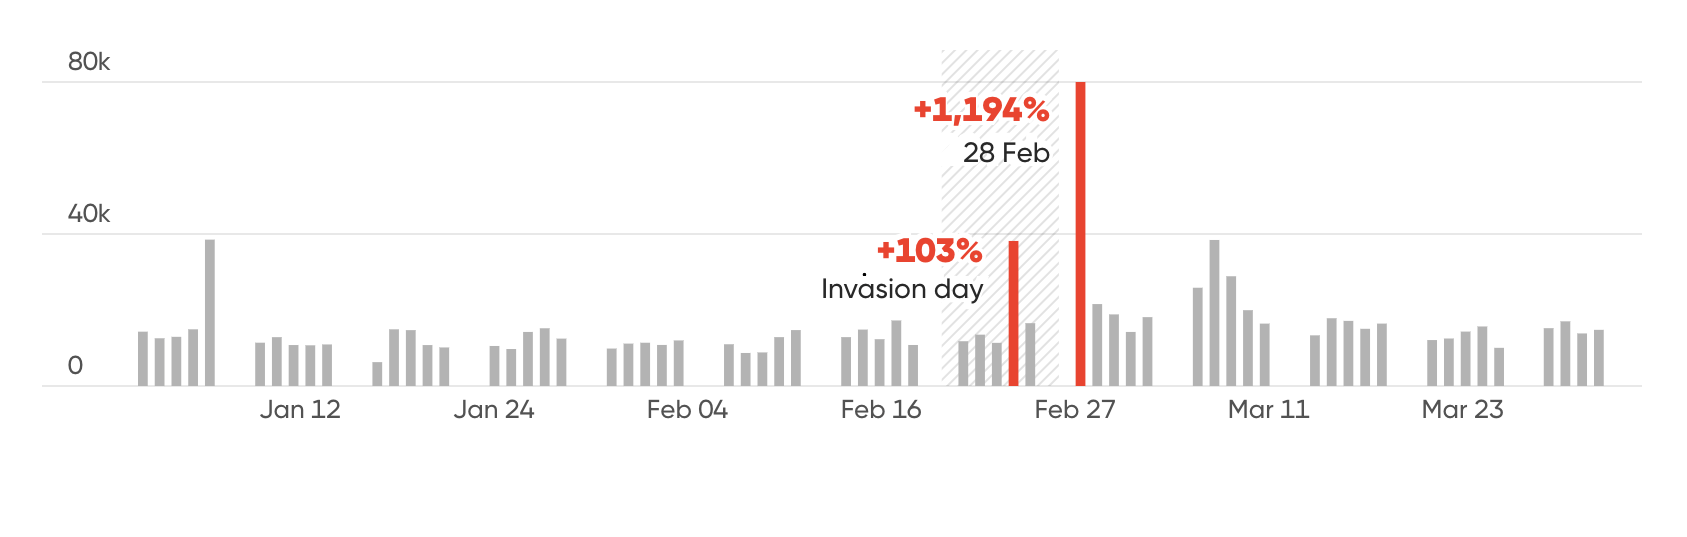
Gold saw a 103% increase in participation on the same day, suggesting increased demand for the safe-haven asset as geopolitical risks spiralled higher. Activity in the yellow metal remained hectic over the following days, leading to a 1,194% single-day spike in trading volumes on 28 February.
Increased trading activity for gold on the same day of the Ukraine crisis
Daily number of gold transactions in Q1, 2022.
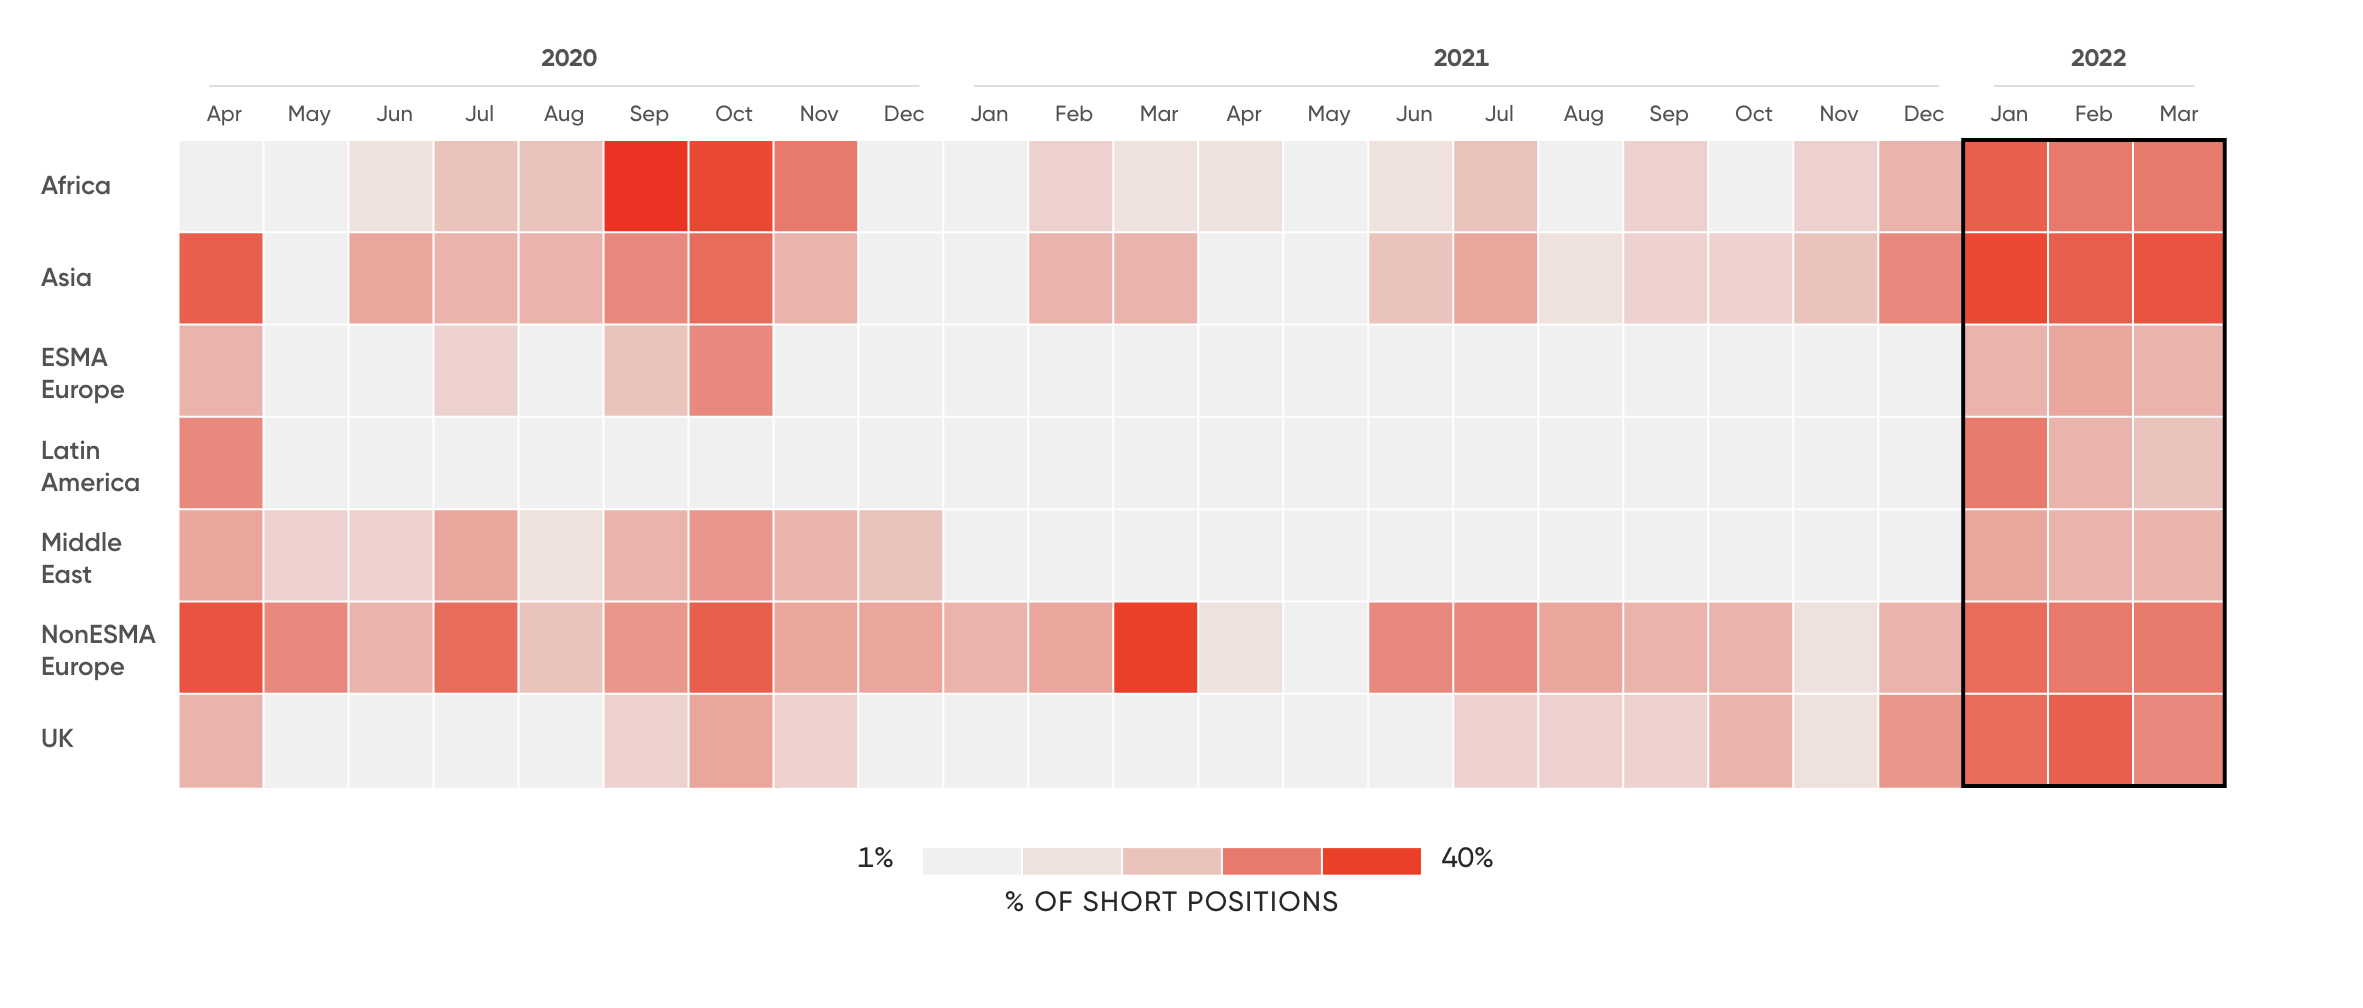
Short positions increased across asset classes and regions in the first quarter.
Percentage of short positions is increased across all regions
Monthly proportion of short positions by regions.
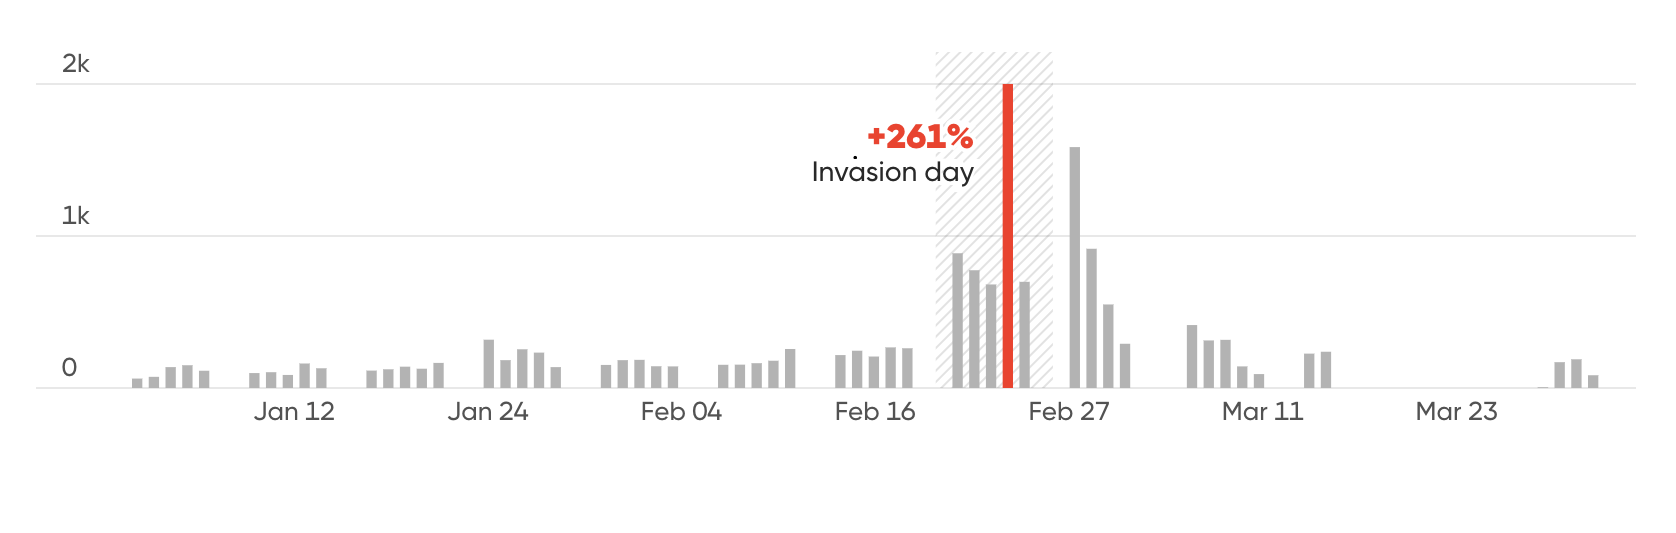
Traders in the dollar-rouble currency pair increased by 261% on the day of the invasion and sentiment towards that exchange rate went up by 21%.
Traders of the dollar-rouble nearly tripled on the first day of the invasion
Daily number of USD/RUB traders in Q1, 2022.
EUR/USD was the only foreign-exchange pair with a significant increase in traders throughout the first quarter.
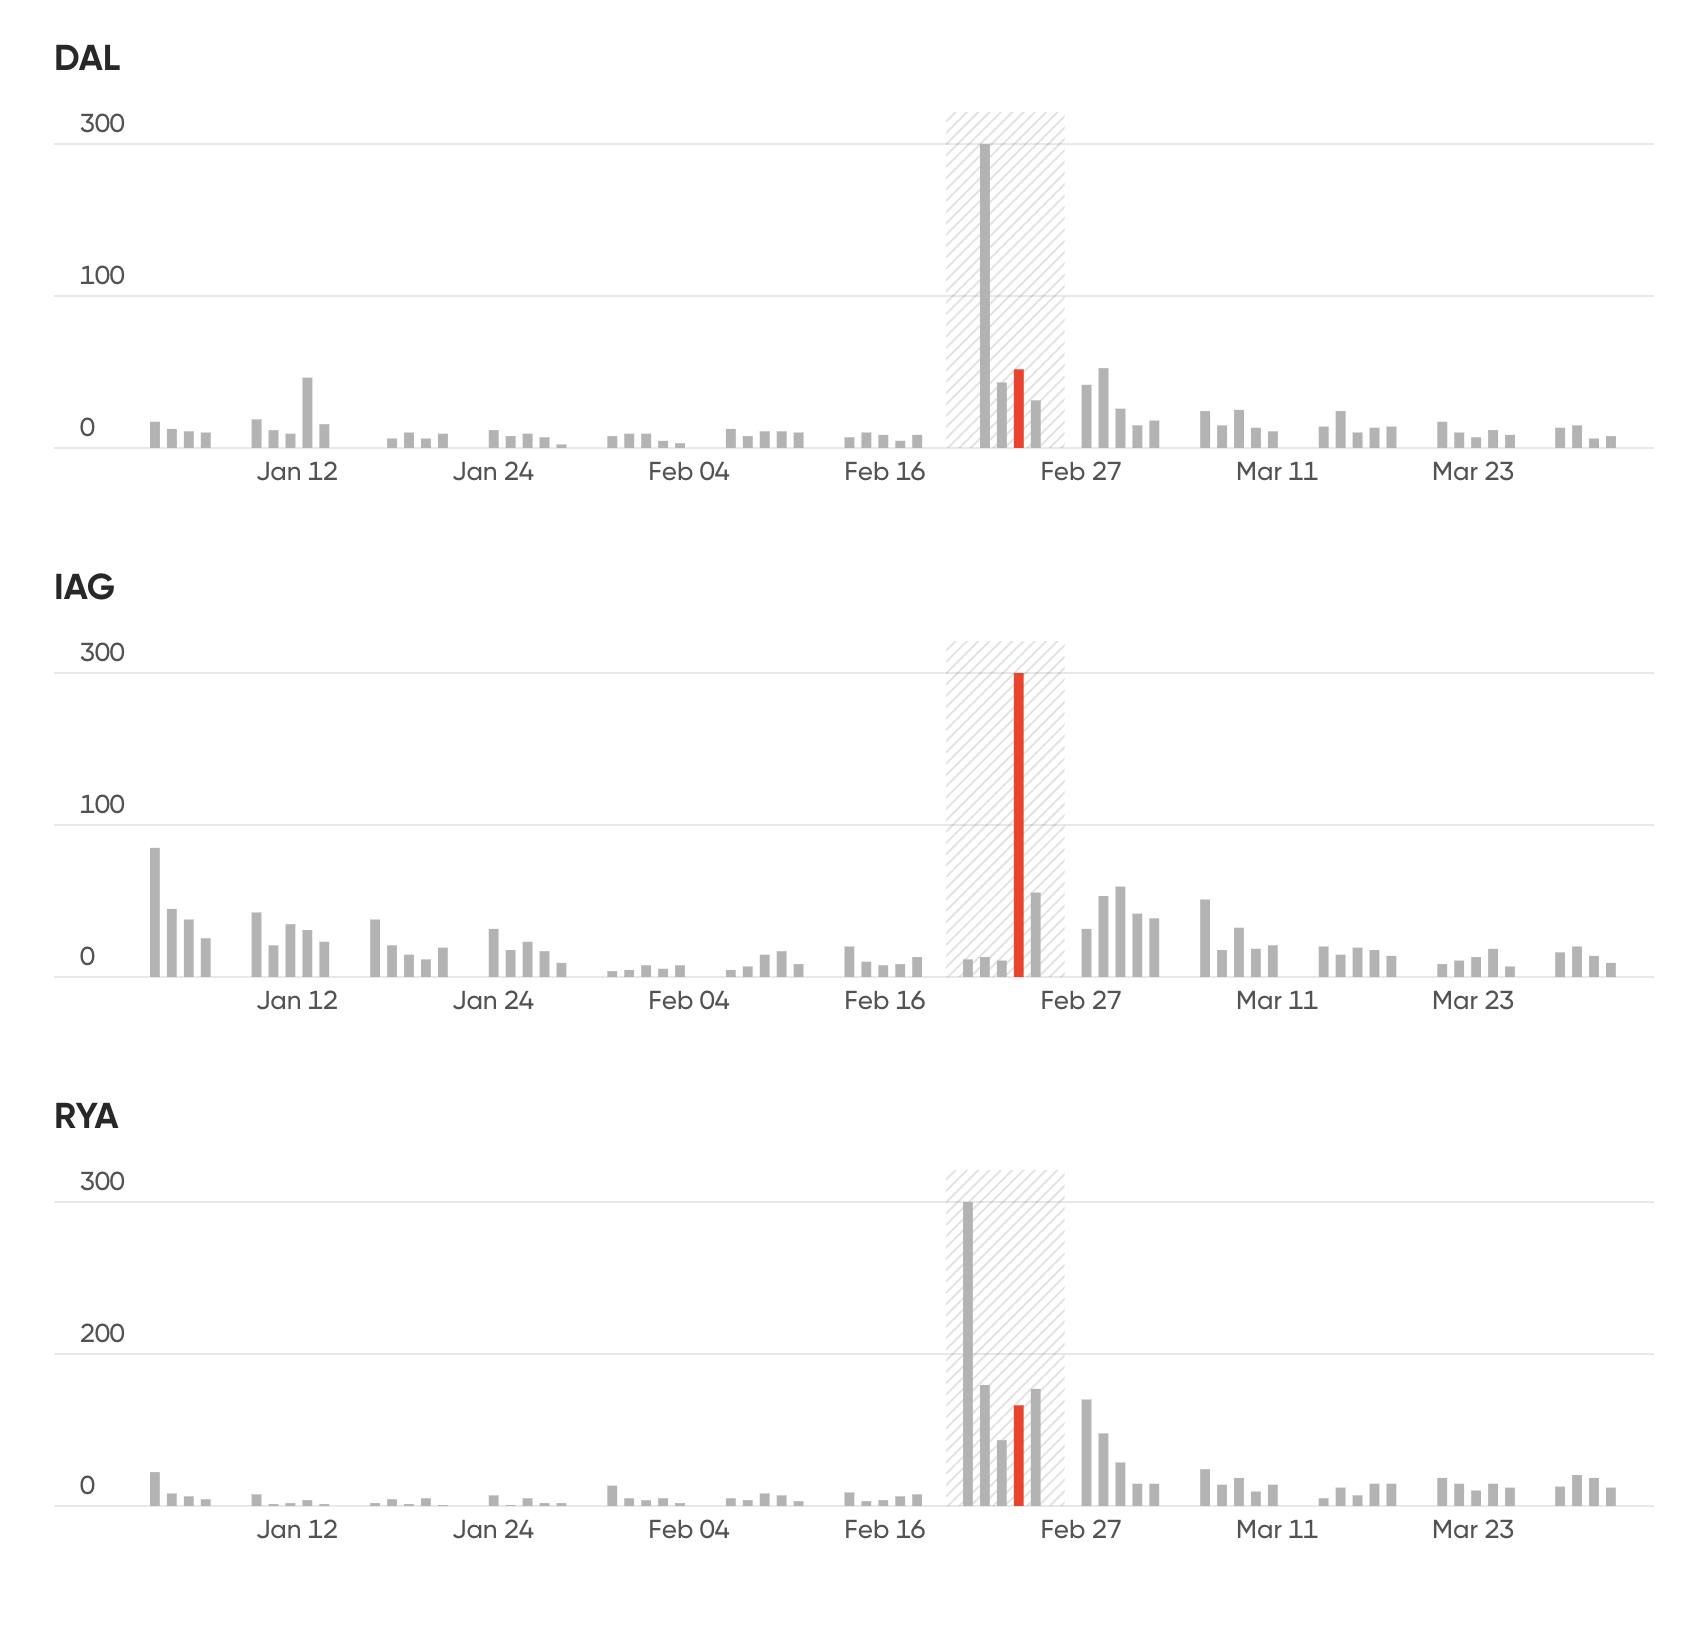
Airline stocks saw high levels of trading. International Consolidated Airlines (IAG), the parent of British Airways, saw a whopping 1,877% jump in the number of traders on the first day of the Russian offensive compared to the previous day.
Airline stocks saw increased trading activity during the start of the Ukraine crisis
Daily number of traders in Q1, 2022.
Capital.com chief analyst David Jones comments:
Cryptocurrencies
Cryptocurrencies too saw a steady decrease in investor participation through the quarter, after starting the year on a high in January. Traders of digital assets on Capital.com dropped 16% in February and a further 10% in March.
On a quarter-on-quarter basis, crypto turnover jumped 93% during the January-March period, but that was thanks to a few outlying single-day volume spikes in January and not representative.
Number of traders in digital assets declined 3% last quarter from the prior period, while the number of transactions decreased almost 7%.
The starkest signal on overall market mood came from a sentiment indicator based on relative proportion of long and short positions. The metric showed that long positions declined last quarter to 71% of total globally, the lowest level at least since mid-2020.
Bitcoin (BTC/USD) dominated trading volumes, recording more than five times the turnover of its closest rival ether (ETH/USD) – even though the number of traders in both coins were very similar. Bitcoin and ether against the Australian dollar (BTC/AUD and ETH/AUD) ranked third and fourth respectively on the trading volume chart.
Interestingly, the ETH/USD pair attracted the biggest number of traders in the three months through March, claiming that spot for the first time - by wresting it from dogecoin (DOGE/USD) which had held it through the whole of 2021.
Other actively traded virtual coins included shiba (SHIB/USD), cardano (ADA/USD) and ripple (XRP/USD).
Among the big crypto players, traders were most bullish on vechain, dogecoin and shiba, with long-to-short position balance in March of 87%, 86% and 85% respectively. They were least upbeat on bitcoin, with the position ratio at 64% in favour of longs. Ethereum was at 67% and litecoin at 75%.
Capital.com chief analyst David Jones comments:
Women in trading
While women make up just 13% of Capital.com’s retail customers, on average they consistently punch above their weight in terms of trading.
Capital.com analysed emerging trading trends showing the high level general differences between female and male traders since the start of 2021:
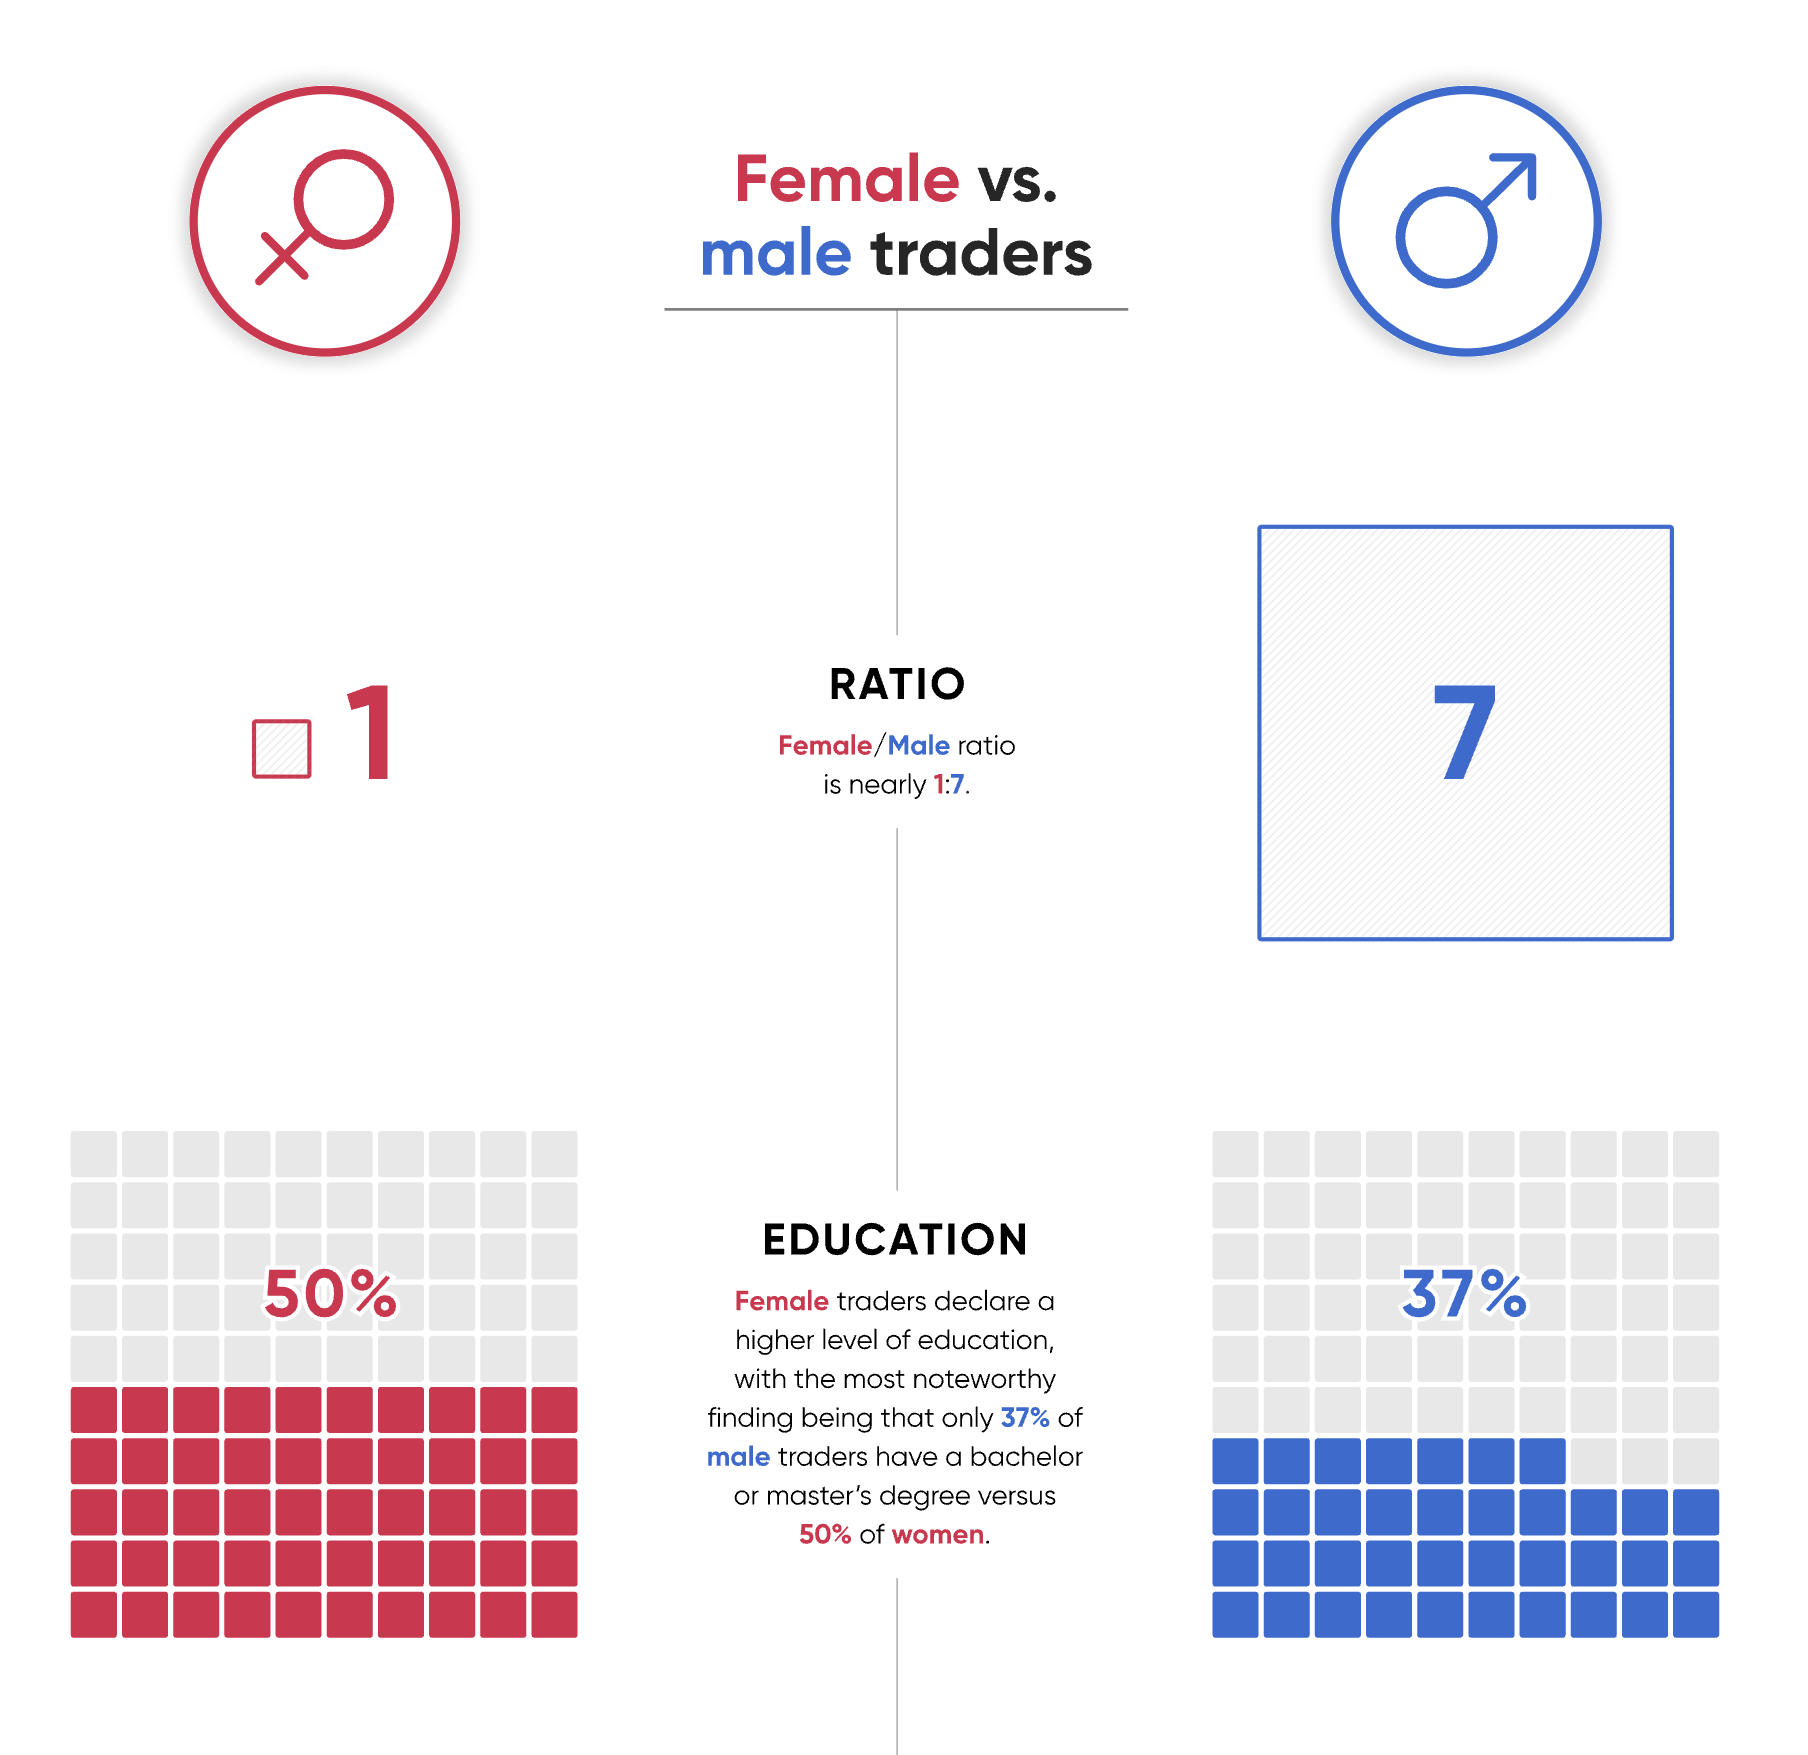
- Female/male ratio is nearly 1:7.
- Female traders declare a higher level of education, with the most noteworthy finding being that only 37% of male traders have a bachelor or master’s degree versus 50% of women.
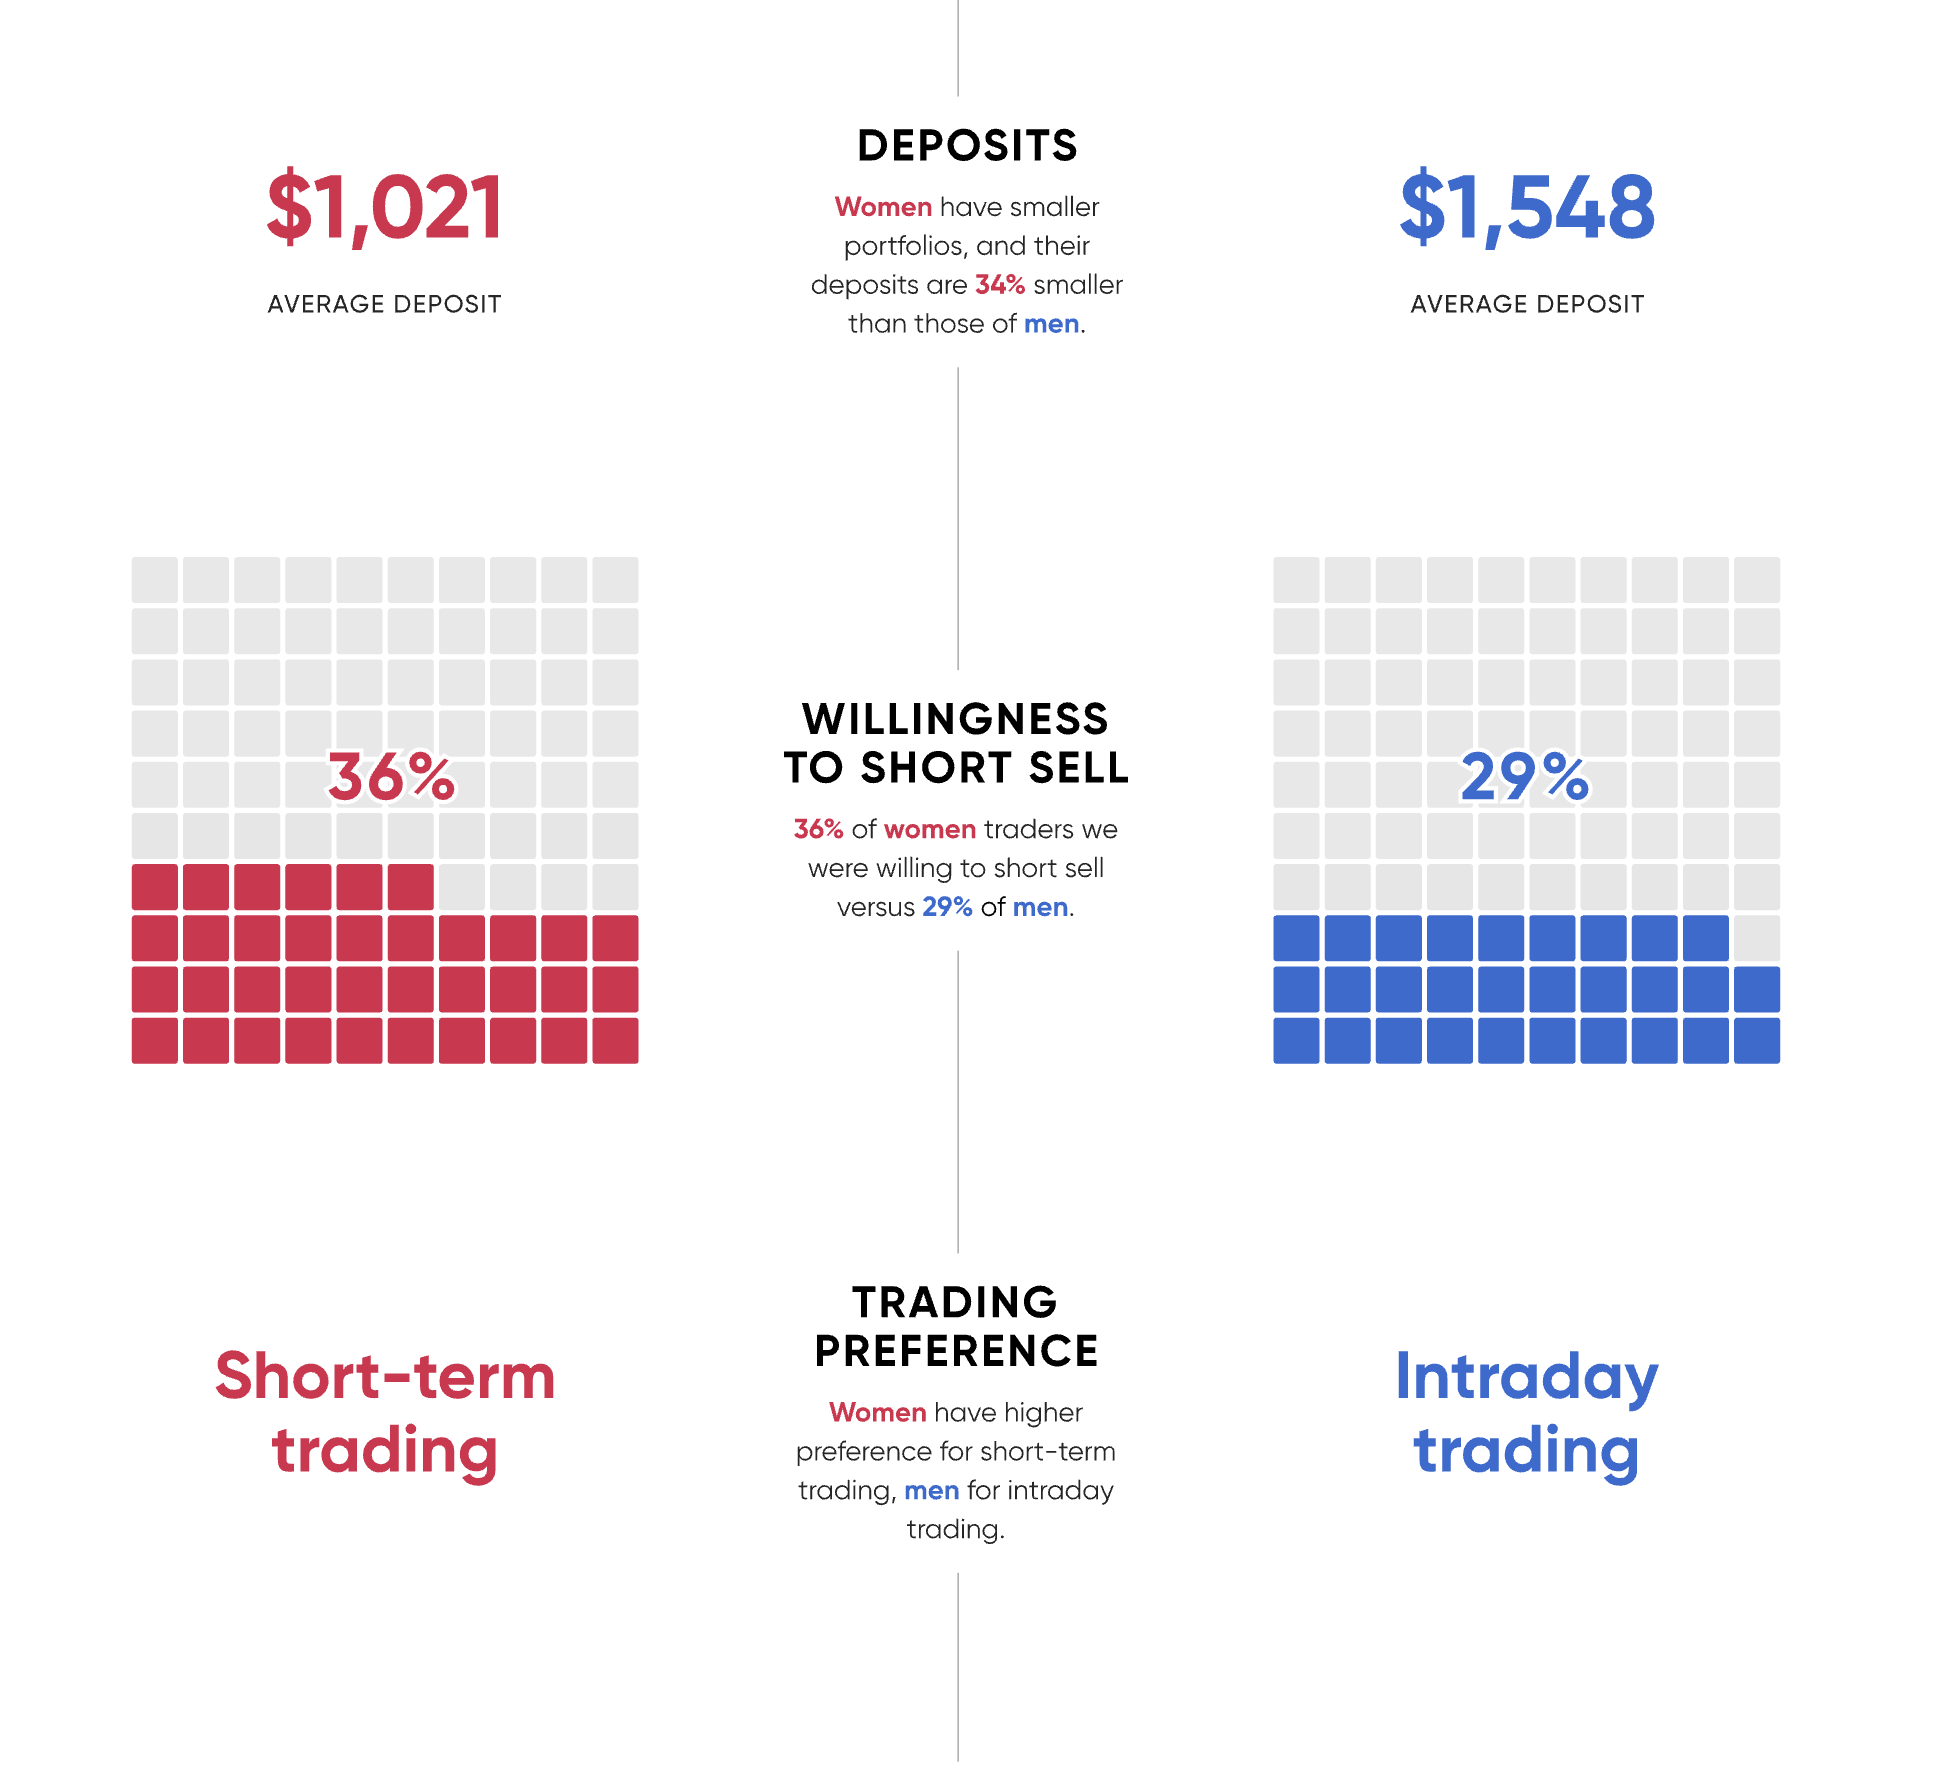
- Women have smaller portfolios, and their deposits are 34% smaller than those of men.
- Women have higher preference for short-term trading, men for intraday trading.
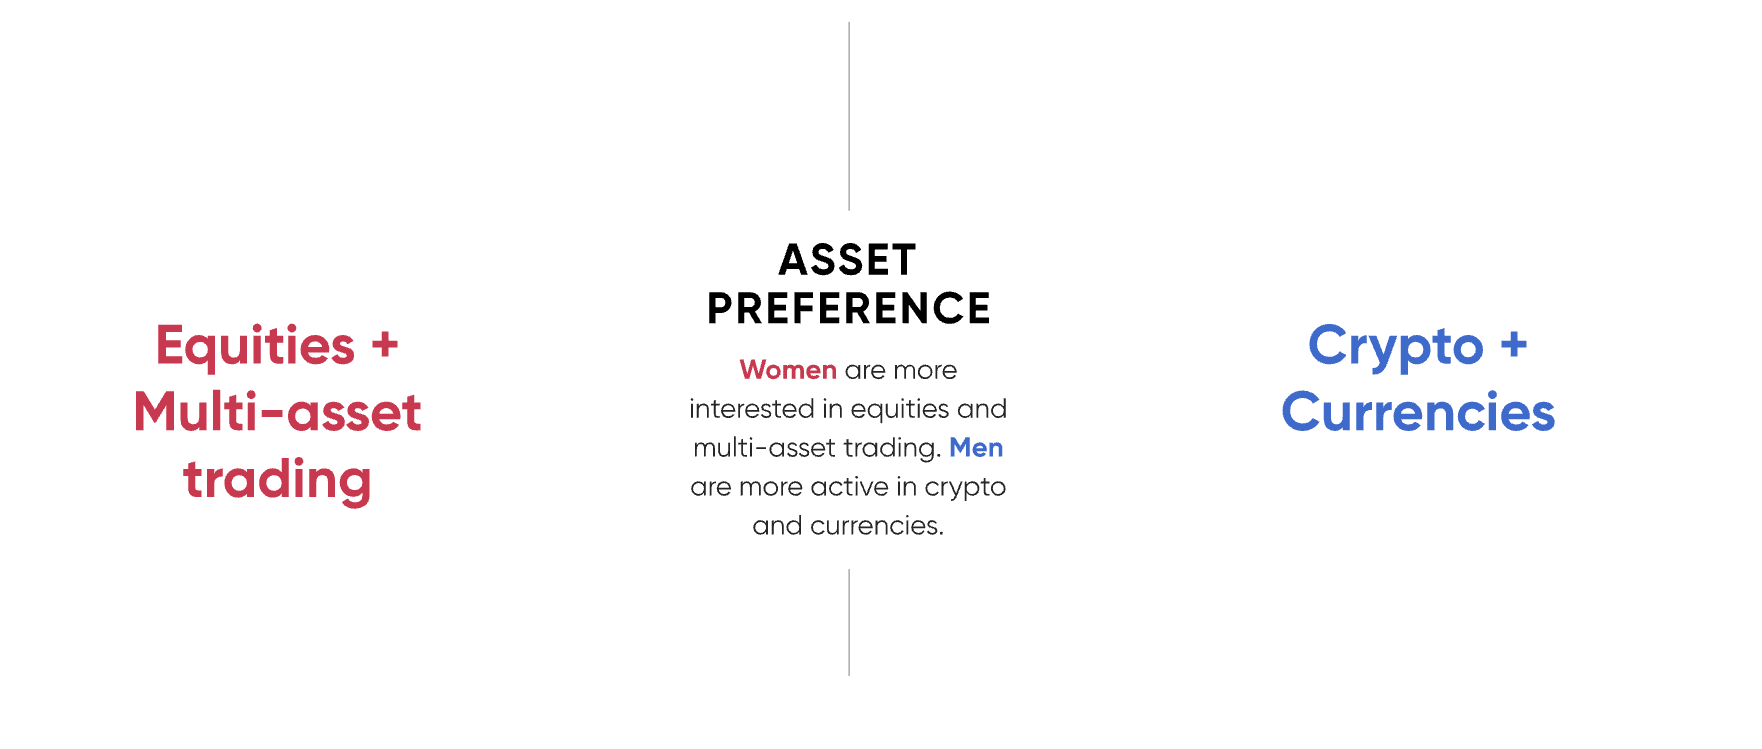
- Women are more interested in equities and multi-asset trading. Men are more active in crypto and currencies.
Regional variations
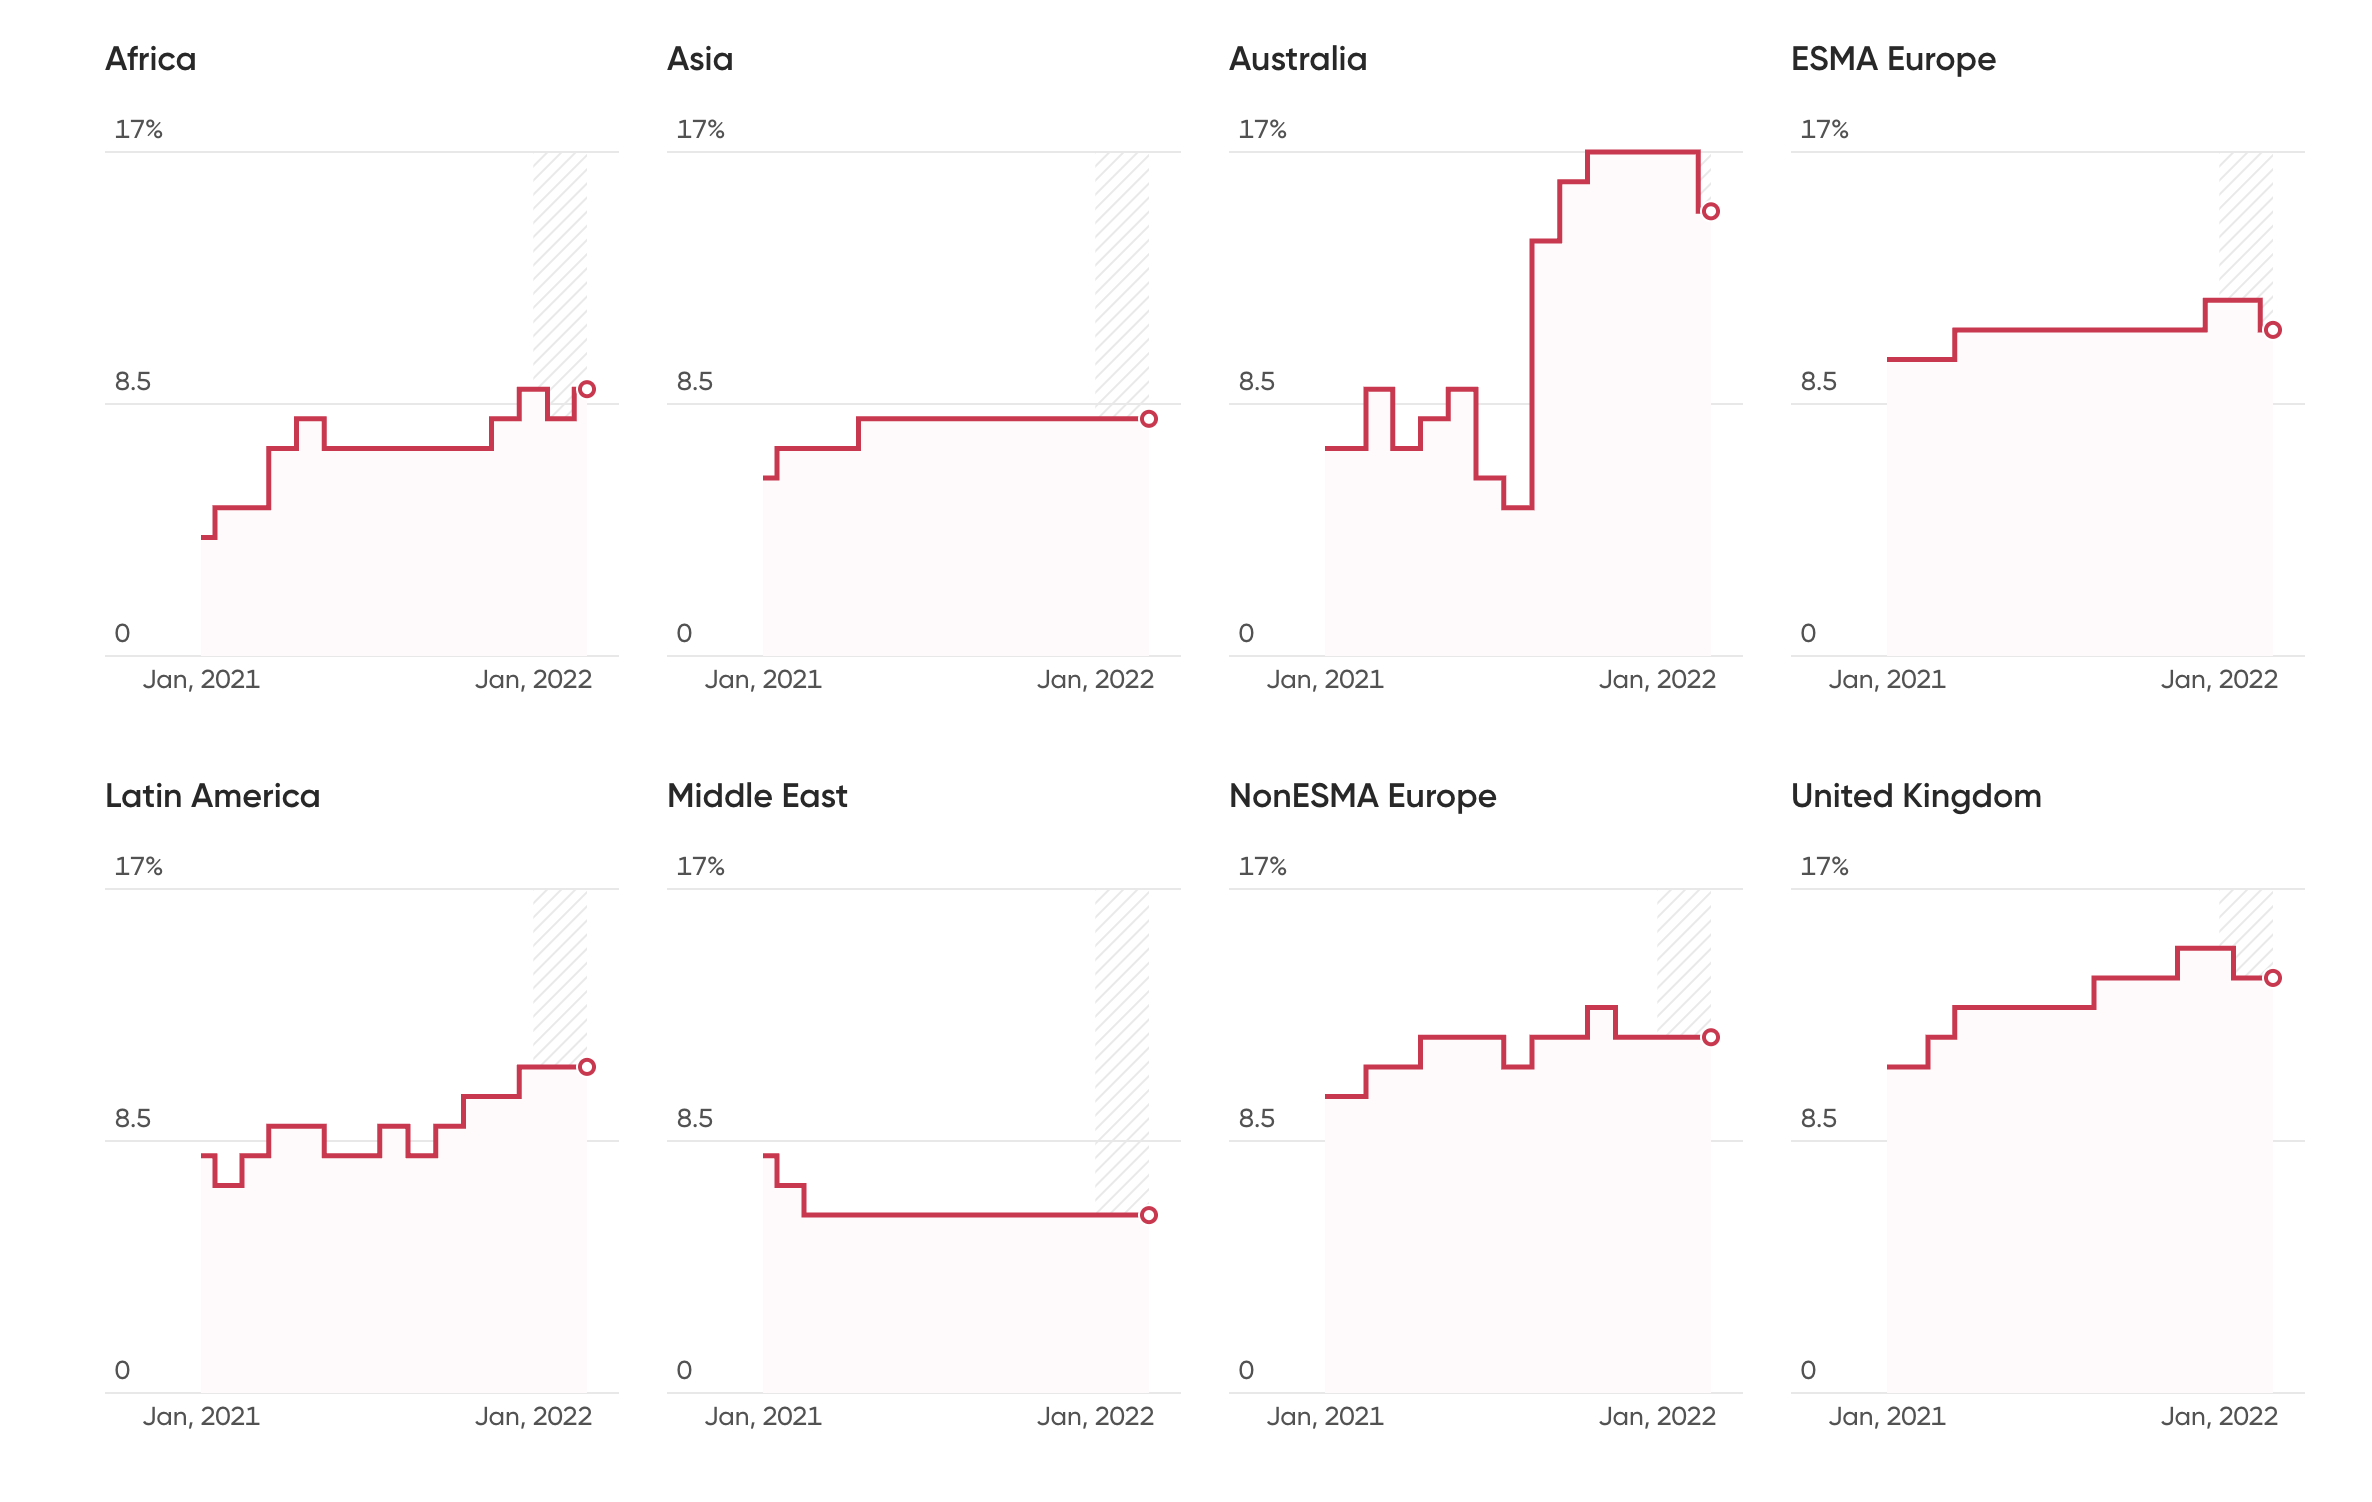
Australia has the highest percentage of female traders, 16% of overall trader numbers in that country in the first quarter of 2022, compared with the lowest numbers which are found in the Middle East (6% in Q1 2022).
The percentage of female traders in Africa is 9%, Asia (8%). Europe within the European Securities Markets Authority (ESMA) (12%), Latin America (11%), Non-ESMA Europe (12%), and UK (14%).
Australia experienced the highest female participation across all regions
Percentage of female traders over the last 12 months.
Laura Lin, CEO for Capital.com APAC, says that Capital.com’s investor data also confirms what she has observed about female investors, particularly in Asia, throughout her career. Lin points out that, “Women differ from men in investing by generally being more patient, cautious and disciplined.”
“New female clients start with a smaller average deposit amount – 21% smaller for females compared to males: $226 vs $287. This caution is a positive sign”, says Lin, and fits in with Capital.com advice to all clients.
Lin points out that, “Women start with the market they are most familiar with. Men are more likely to take risks. Another example is that a lower percentage of women traded GameStop than men in Q1 2022.”
Lin also notes that returning female clients tend to place more stop-loss orders compared to men.
She calls this a positive sign because Capital.com clients are encouraged to trade responsibly. “Women customers are more likely to put on a bigger stop-loss order and close them manually before the stop-loss order is traded. In contrast, men tend to set up narrower stop loss orders, and are more likely to move or cancel them before seeing them through.
“Female clients hold losing positions for a shorter period than men”, said Lin. “They have a better understanding of the average time- hold win-loss ratio, which might show discipline.”
“We found that 36% of our female clients classify as short traders, whereas for male it was only 29%. That does not mean our female clients are short sellers, but it could mean they understand both sides of a trade and evaluate entry from a short seller’s perspective more than male. This mindset can also help traders to identify opportunities under bearish market conditions.”
Lin says education success has been key to the larger take-up of female retail traders in Asia. “Being financially literate can also build confidence for women. Finance, commerce, and accounting are popular degrees chosen by Asian female university students.”
Despite this evidence, Lin adds, only a small percentage of women think they make better investors than men.
Capital.com chief analyst David Jones comments:
Looking ahead
Capital.com chief analyst David Jones looks to the next quarter:
“It would probably have to be something of a statistical outlier for markets to experience the same sort of volatility in the second quarter that we had in the first three months of the year. The Ukraine war continues, for the time being, and the more mundane threat from inflation to retail-investor sentiment has not gone away.
As far as stock markets are concerned, as the first quarter ended, it feels as though major indices such as the S&P 500 have already tentatively turned the corner. At its worst point in February this US benchmark had fallen 13% for the year – but as March ended it was down less than 5%.
So for stock markets perhaps we may expect some more cautious recovery. The second half of March did see a sharp rally so there is definitely some scope for that to be given up – the real test here is whether we see our retail investors happy to step in and buy the dips during Q2, rebuilding confidence after the turmoil at the beginning of this year.
Two of the obvious markets to rally sharply on the Russian invasion were oil and gold. At its highest in early March, a barrel of oil had risen by more than 70% in 2022.
Barring a major escalation of the war it may be difficult to see what the catalyst would be for those highs to be breached once more – the price of oil has dropped back by more than 20% since then.
I think the same psychology may apply to gold. Retail investors embraced it as a safe haven this quarter and the yellow metal hit its best level since August 2020. But this too has slipped back to where it was just as the invasion started – I wouldn’t be surprised if the story of the second quarter is a lack of direction for these two markets after the massive volatility seen in the first three months.
I think the rest of 2022 may see a lot of focus on the US dollar. It is viewed as something of a safe haven in times of geopolitical uncertainty, and it ended March up a couple of percent for the year to date. It had been rising anyway on the widely telegraphed higher than expected inflation numbers and as the first quarter ended it certainly had a tailwind going into April.
It has been the case for the last 18 months that retail investors have been happy to be a buyer of the US dollar on dips, and so far at least that has remained the case this year.”
Conclusion
Data from the first quarter of 2022 offers some key insights into the behaviour of Capital.com’s global retail traders during a period of exceptional upheaval. The end of the Covid-19 pandemic, supply chain shocks, inflationary pressures and bubble fears came together at the beginning of the year to create an incendiary atmosphere.
The fire storm was triggered by the Russian invasion of Ukraine. In many respects, retail traders responded just like larger investors, dashing for the traditional safe havens.
But the world’s retail traders also showed an equally strong appetite for risk, flooding into the commodities market to back their insights and instincts with their own money.
Meanwhile, against the backdrop of spikes, surges, inflation and warfare, female traders were making better profits than their male counterparts by efficient use of stop losses and an eye for a well-chosen short position.
The overall significant climb in activity may show that retail investors identify potential opportunities in a crisis and are not afraid to back their own ideas.
The second quarter edition of this report will show whether these are enduring trends, or comparatively short term ones. Capital.com’s Chief Analyst, familiar with the behaviour of retail traders, would not be surprised by a period of comparatively calm trading.
About our data
This proprietary report captures data on all executed trades on the Capital.com platform between 1 Jan 2022 and 31 March 2022.
General
Weekends are excluded from all markets except cryptocurrencies.
Traders active in multiple markets contribute to each market’s total number of traders.
Sentiment is based on the percentage of short positions for a given market or instrument.
Technology and cloud-based stocks are filtered by market cap as specified by Finviz.
Meme stocks represent the most popular instruments by the total number of mentions on WallStreetBets subreddit in 2021, following our proprietary research on meme stocks returns in 2021.
Markets
Product types include CFD, stockbroking and spread betting (available for FCA clients) unless stated otherwise.
Markets covered include commodities, cryptocurrencies, currencies, indices and equities.
Demographics
Regions are determined by the registered location of residence. Inaccurate data is corrected within 14 days by Capital.com.
Regions covered include Africa, Asia, Australia, ESMA Europe, Latin-America, Middle East, Non-ESMA Europe, North-America, United Kingdom. ESMA Europe includes all countries which fall under supervision of the European Regulator (ESMA).
Regions with less than 1000 traders throughout Q1 are excluded.
Gender identification is performed via applying natural language processing on the account names.
Percentage of female traders is calculated by excluding unknown and unisex gender.