Opendoor stock forecast: Third-party price targets
Opendoor Technologies (OPEN) was trading at $8.35 at 10.43pm UTC on 23 September 2025, within an intraday range of $8.34-$9.40 and sitting just above its session low.
The move followed the US Federal Reserve’s first rate cut to 4.00-4.25% on 17 September and a subsequent fall in the average 30-year mortgage rate to 6.39% – the lowest since October 2024. This shift has supported sentiment in housing-related shares. Retail client positioning remains strongly bullish, with 79.26% of positions on the buy side (Reuters, 21 September 2025).
Opendoor stock predictions: Analyst price target view
Citigroup (sell)
Citigroup sets a $0.70 12-month target, reduced from $0.80, citing valuation pressure from weak home-resale activity and margin compression (AInvest, 6 August 2025).
Keefe, Bruyette & Woods (hold)
KBW’s Ryan Tomasello places a $1.00 target, noting cost-cutting progress but highlighting uncertainty around revenue growth (Quiver Quantitative, 13 August 2025).
UBS (neutral)
UBS raises its 12-month price target to $1.60 from $1.30, pointing to expectations that ongoing home-price declines could delay adjusted EBITDA breakeven until FY 2026 (Ainvest, 7 August 2025).
CFDs are complex instruments and come with a high risk of losing money rapidly due to leverage. Past performance is not a reliable indicator of future results.
OPEN stock price: Technical overview
On the daily chart, OPEN was trading at $8.35 at 10.43pm UTC on 23 September 2025, holding above its 20-, 50-, 100- and 200-day moving averages (DMAs) at around 7 / 4 / 2 / 2. The 20-over-50 alignment remains intact, with trend strength indicated by an ADX(14) reading of 60.2. Momentum is neutral, with the 14-day RSI at 59.5, consistent with price action above the moving-average band.
The first resistance level to watch is the $12.35 pivot zone; a daily close above this area would bring $15.60 into view. On pullbacks, initial support sits near the $4.01 pivot and then the $2.46 100-day SMA. A break below these levels would increase the risk of further downside (TradingView, 23 September 2025).
This is technical analysis for informational purposes only and does not constitute financial advice or a recommendation to buy or sell any instrument.
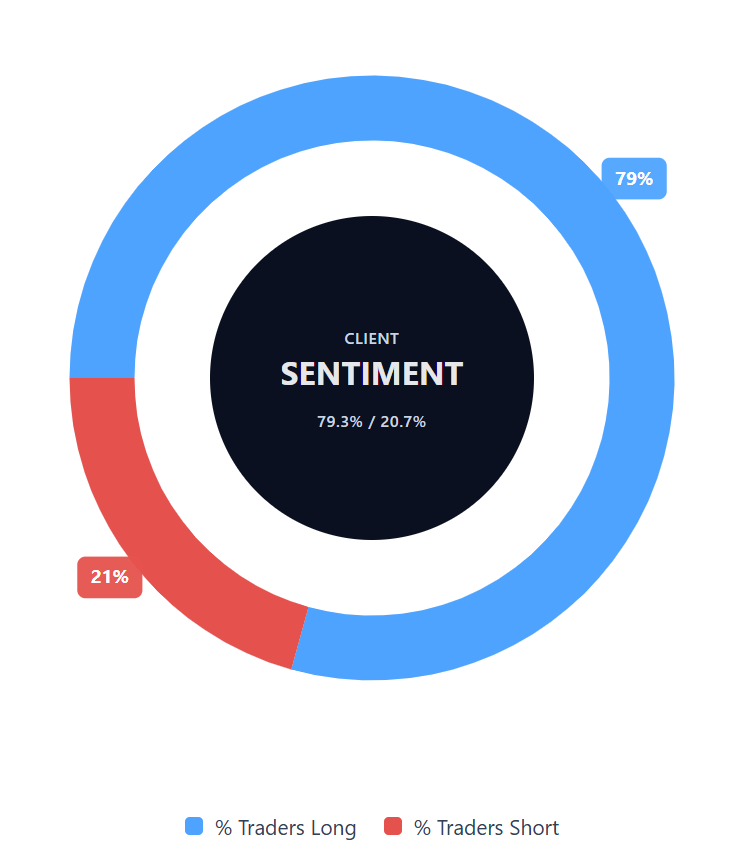
Capital.com’s client sentiment for Opendoor CFDs
Buyers account for 79.3% of positions compared with 20.7% for sellers on OPEN CFDs, showing a strong buy-side bias (23 September 2025). This leaves buyers ahead by 58.5 percentage points, highlighting a one-sided market positioning. The data reflects open positions on Capital.com and is subject to change.
FAQ
Who owns the most Opendoor stock?
Opendoor’s largest shareholders are typically institutional investors such as asset managers and investment funds. The exact breakdown varies over time and can be confirmed in the company’s most recent filings.
What is the 5 year forecast for Opendoor stock?
There is no universally agreed five-year forecast. Analysts provide price targets based on their models, but these are subject to revision as market conditions change. Remember, past performance is not a reliable indicator of future results.
Is Opendoor a good stock to buy?
We don’t provide recommendations on whether to buy or sell any stock. Analysts’ views and price targets are available for reference, but trading decisions should be based on your own research and consideration of risk.
Could Opendoor stock go up or down?
Yes. Like all listed shares, Opendoor’s price may move in either direction depending on company performance, sector conditions, interest rates and wider market trends.
Should I invest in Opendoor stock?
We don’t provide investment advice. Whether to invest depends on individual circumstances, trading objectives and risk tolerance. Independent financial advice may be appropriate if you’re unsure. Contracts for difference (CFDs) are traded on margin. Leverage higher than 1:1 amplifies potential losses and potential gains.