
NIO Inc. stock forecast: Firefly deliveries pass 70,000
NIO is a Chinese electric vehicle manufacturer whose Firefly brand surpassed 70,000 cumulative deliveries in July 2026 as the company expanded its lower-priced EV offering. Explore third-party NIO price targets and technical analysis. Past performance is not a reliable indicator of future results.
NIO Inc. (NIO) last traded at $4.69 as of 10:46am UTC on 24 July 2026, within the session’s $4.56–$4.72 range. Past performance is not a reliable indicator of future results.
Recent sentiment has partly reflected progress at NIO's Firefly brand, which surpassed 70,000 cumulative deliveries on 16 July 2026. The milestone followed NIO's second-highest monthly delivery volume on record as the company continued expanding in the lower-priced electric vehicle (EV) segment (CnEVPost, 16 July 2026).
Shares had earlier gained 3.2% on 13 July, although trading volume remained below its recent average (MarketBeat, 13 July 2026). Investors have also considered NIO's opposition to further price cuts during China's continuing EV price war. The company has prioritised profitability, while rival Li Auto has adopted more aggressive pricing (Wall Street Journal, 26 June 2026).
Third-party NIO outlook: Firefly milestone
As of 24 July 2026, third-party NIO Inc. stock predictions present a range of 12-month outlooks, shaped by delivery growth, pricing competition in China and the company's progress towards profitability.
Intellectia.ai: short-term model forecast
Intellectia.ai projected an average NIO price of $6.21 for July 2026, with a forecast range of $5.45–$7.40, as of 6 July. Its model then projected an average of $5.33 for August, citing short-term volatility in its trading-channel estimates (Intellectia.ai, 6 July 2026).
Public.com: consensus overview
Public.com reported a 12-month target of $6.76, based on ratings from 10 analysts and an overall 'buy' consensus, as of 6 July 2026. Of the analysts included, 50% rated NIO a 'strong buy', 10% a 'buy', 30% a 'hold' and 10% a 'sell' (Public.com, 6 July 2026).
Price-target.com: analyst tracker
Price-target.com reported an average 12-month target of $7, with estimates ranging from $6–$8.20 across five Wall Street analysts, as of July 2026. The relatively narrow range may partly reflect the smaller analyst sample (Price-target.com, 16 July 2026).
MarketBeat: consensus overview
MarketBeat's compilation of 13 analysts placed the average 12-month target at $6.70, with estimates ranging from $4–$8.50, as of 22 July 2026. The range reflected a mix of 'buy', 'hold' and 'sell' ratings issued over the previous three months (MarketBeat, 22 July 2026).
TipRanks: consensus overview
TipRanks reported an average 12-month target of $6.90, with forecasts ranging from $3–$8.60. The estimate was based on ratings from 13 Wall Street analysts issued over the previous three months, as of 22 July 2026 (TipRanks, 22 July 2026).
Predictions and third-party forecasts are inherently uncertain, as they cannot fully account for unexpected market developments. Past performance is not a reliable indicator of future results.
NIO Inc. upcoming earnings
NIO last reported unaudited financial results for the first quarter of 2026 on 21 May, before US markets opened. The company recorded total revenue of 25.53bn RMB ($3.70bn USD), a gross margin of 19.0% and quarterly vehicle deliveries of 83,465 (NIO, 21 May 2026).
Management hosted a conference call at 8am US Eastern Time on the same day. In its outlook, NIO guided for second-quarter deliveries of 110,000–115,000 vehicles and total revenue of 32.78bn–34.44bn RMB ($4.75bn–$4.99bn USD) (NIO, 11 May 2026).
As of 24 July 2026, NIO hasn’t confirmed the date of its second-quarter results, and its investor relations events page contained no formal announcement (NIO, accessed 24 July 2026).
Third-party calendars provided several estimates. MarketChameleon projected a window of 25 August–4 September 2026 (MarketChameleon, 24 July 2026), Wall Street Horizon listed an unconfirmed date of 1 September (Wall Street Horizon, 24 July 2026), MarketScreener projected 8 September (MarketScreener, 19 February 2026) and TipRanks estimated 9 September (MarketBeat, 22 July 2026).
These dates are based on historical reporting patterns rather than company confirmation and may change before NIO makes an official announcement.
NIO stock price: technical overview
The NIO stock price traded at $4.69 as of 10:46am UTC on 24 July 2026, below its 20-, 50-, 100- and 200-day simple moving averages (SMAs) of approximately $4.87, $5.26, $5.59 and $5.59, respectively, according to TradingView data.
The stock also remained below its equivalent exponential moving averages (EMAs) of about $4.91, $5.18, $5.36 and $5.40. The shorter-term EMAs sat below the longer-term readings, indicating weaker recent price performance relative to longer-term averages. The nine-day Hull moving average stood at $4.65.
The 14-day relative strength index (RSI) was 36.08, placing it in the lower part of the neutral range. The 14-day average directional index (ADX) stood at 14.71, suggesting limited trend strength. The stochastic %K reading was 8.54, while Williams %R was −90.48, placing both towards the lower end of their respective ranges.
Above the current price, the classic pivot point near $5.33 provides an initial reference level. The 100- and 200-day SMAs at $5.59 form a further potential resistance area, followed by the first pivot resistance level near $6. Above that, the second resistance level stands at about $6.94.
Below the current price, the first pivot support level near $4.39 provides an initial reference. A move below it would bring the second support level near $3.72 into view (TradingView, 24 July 2026).
Technical indicators describe historical price behaviour and do not reliably predict future movements. This analysis is for informational purposes only and does not constitute financial advice or a recommendation to buy or sell any instrument.
NIO Inc. share price history (2024–2026)
NIO’s stock price began July 2024 at around $4.31 before rising to approximately $8.02 by 8 October 2025, its highest level during the two-year period. The advance faded in late 2025, and NIO ended the year at $6.11, up 40.14% from the end of 2024.
The stock then moved lower in early 2026 as pricing competition in China’s EV market continued. Shares traded mainly within the low-$4–mid-$5 range through the winter and spring.
They rose to $5.64 on 21 May 2026 after NIO published its unaudited first-quarter results, which reported the company’s first quarterly profit. The stock later reached about $6.07 on 2 June before declining over the following weeks.
By 24 July 2026, NIO was trading at around $4.69, approximately 8% lower than a year earlier and below its two-year high. Over the period, its price movements coincided with changes in profitability, delivery volumes and pricing pressure across China’s EV sector.

Past performance is not a reliable indicator of future results. Share prices are indicative and may differ from live market prices.
NIO Inc. (NIO): Capital.com analyst view
NIO’s 2026 price performance has reflected both operational progress and continuing competitive pressure.
The company reported its first quarterly profit in Q1 2026 and recorded consecutive months of year-on-year delivery growth. Its share price rose during parts of the spring, but later retreated from its 2026 highs as pricing competition and margin pressure remained key considerations.
Analyst views also vary. Some point to NIO’s expansion through the Firefly and ONVO brands as a possible source of longer-term delivery growth. Others highlight margin pressure and strong competition as factors that could affect future financial performance.
Average 12-month targets from the sources cited above remained above NIO’s share price on 24 July 2026. However, these forecasts involve substantial uncertainty and may change in response to delivery figures, earnings, competitive developments and changes in China’s regulatory environment.
Capital.com’s client sentiment for NIO Inc. CFDs
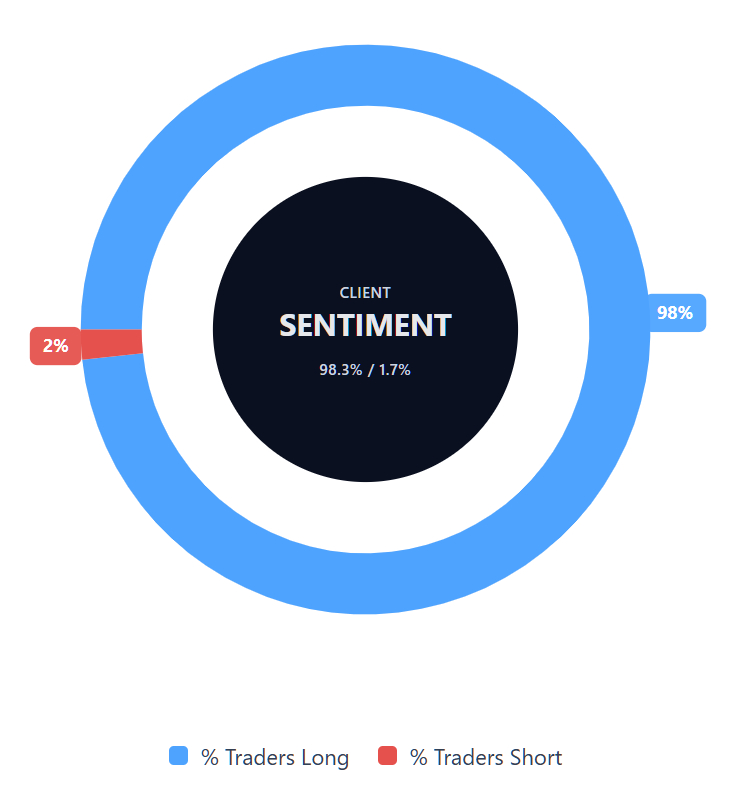
As of 24 July 2026, Capital.com client positioning in NIO Inc. CFDs was 98.3% long and 1.7% short at the time of the snapshot. This represented a difference of 96.6 percentage points and showed that most open positions included in the data were long.
Client sentiment reflects open positions on Capital.com at a particular point in time. It can change and does not indicate how NIO’s price will move.
Summary – NIO Inc. 2026
- NIO traded near $4.69 at 10:46am UTC on 24 July 2026, below its two-year high of $8.02 in October 2025.
- The price remained below its main moving-average cluster, while the RSI sat in the lower part of the neutral range and the ADX indicated limited trend strength.
- Key factors included pricing competition in China’s EV market, delivery growth and NIO’s first reported quarterly profit.
- Recent developments included Firefly surpassing 70,000 cumulative deliveries and NIO’s opposition to further price cuts.
- Third-party 12-month price targets varied considerably and remain subject to revision.
Past performance is not a reliable indicator of future results.
FAQ
Who owns the most NIO Inc. stock?
The article does not identify NIO’s largest individual or institutional shareholder. Ownership levels can also change as investors buy or sell shares and as companies update regulatory filings. To confirm the latest position, check NIO’s most recent shareholder disclosures, annual report or relevant exchange filings. These sources can show major institutional holdings, insider ownership and changes in significant positions, although reporting dates may not reflect real-time ownership.
What is the five-year NIO Inc. share price forecast?
The article does not provide a five-year NIO stock forecast. The third-party estimates reviewed focus mainly on 12-month targets, with averages clustering around $6.70–$7 and individual forecasts ranging from $3–$8.60. Longer-term forecasts carry greater uncertainty because they depend on factors such as delivery growth, competition, margins, regulation and broader EV demand. Any five-year projection should therefore be treated as speculative rather than a reliable prediction.
Is NIO Inc. a good stock to buy?
Whether NIO is suitable to buy depends on your objectives, financial circumstances and tolerance for risk. The article highlights both potential drivers and risks, including delivery growth, expansion through Firefly and ONVO, improving profitability, margin pressure and strong competition in China’s EV market. Analyst targets also vary considerably. These factors may help inform further research, but they do not establish whether NIO is a suitable investment for any individual.
Could NIO Inc. stock go up or down?
Yes. NIO’s share price could move in either direction as investors respond to earnings, delivery figures, pricing decisions, competition and developments in China’s EV sector. Technical indicators in the article placed the price below its main moving-average cluster, while analyst forecasts showed a wide range of outcomes. Neither technical analysis nor price targets can reliably predict future performance, and unexpected market or company-specific events may lead to sharp price changes.
Should I invest in NIO Inc. stock?
The article does not recommend investing in NIO. A decision would require you to consider the company’s financial position, competitive environment, delivery trends, profitability and the risks linked to the wider EV market. You would also need to assess whether the shares fit your own goals and risk tolerance. Third-party forecasts and analyst targets can provide context, but they are uncertain and should not replace independent research or regulated financial advice.
Can I trade NIO Inc. CFDs on Capital.com?
Yes, you can trade NIO Inc. CFDs on Capital.com. Trading share CFDs lets you speculate on price movements without owning the underlying asset and to take long or short positions. However, contracts for difference (CFDs) are traded on margin, and leverage amplifies both profits and losses. You should ensure you understand how CFD trading works, assess your risk tolerance, and recognise that losses can occur quickly.