Michael Kramer and the clients of Mott Capital own Apple long-term
Big Tech Earnings Set to Steer US Markets into Year-End.
It will be a big week for the US stock market, with five of the Magnificent Seven companies reporting results over two days. The outcome of those earnings results and guidance will likely dictate what happens in the stock market for the remainder of the year.

The three big AI hyperscalers — Alphabet, Meta, and Microsoft — will report earnings after the close of trading on Wednesday, 29 October. It will be more than just the top and bottom lines that investors care about; how much they plan to spend in the future may matter even more. Then, on Thursday, 30 October, Apple and Amazon will follow.
S&P 500 Post CPI Rally
It wasn’t the excitement over earnings season that lifted stocks on Friday, 24 October. It was also the better-than-feared September CPI report, which helped boost the S&P 500 by 80 bps on the day — a modest move, and mostly in line with what the VIX 1-Day was pricing in the day before, with a reading of 14.
The S&P 500 managed to gap above resistance at 6,750 on Friday, which is a positive sign if it can be confirmed on Monday. However, it is worth pointing out that we again saw a weak close on Thursday, followed by a gap higher on Friday — and every time we have seen that happen since 13 October, it has resulted in the S&P 500 giving back the gains and filling the gap, which in this case would be at 6,740.
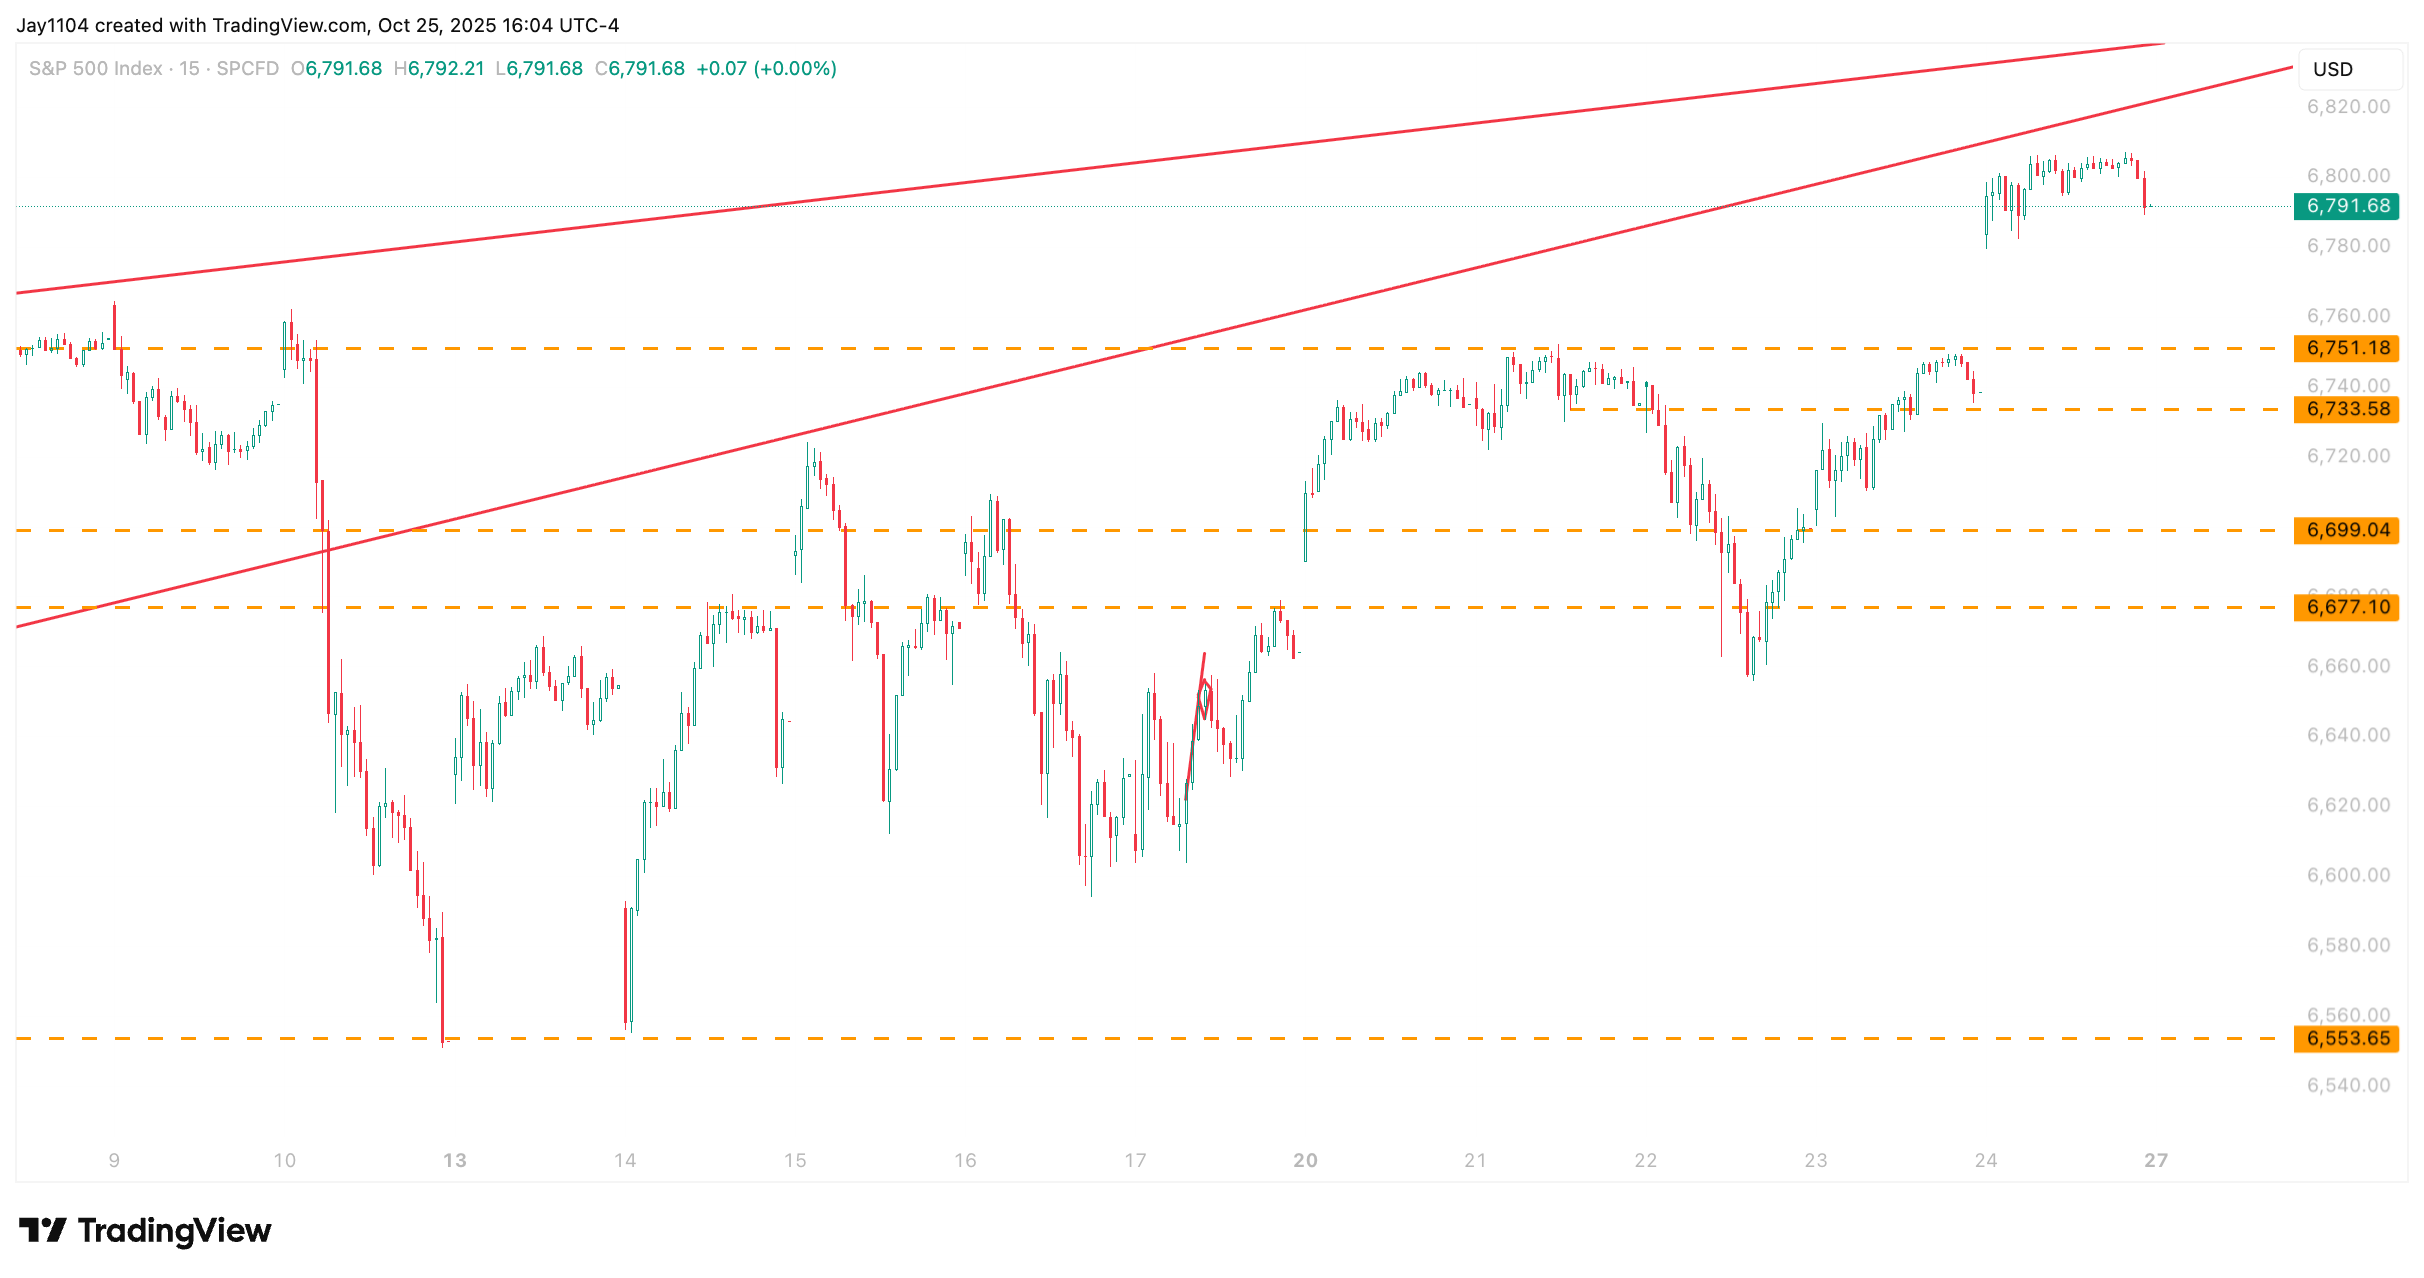
(Source: TradingView)
(Past performance is not a reliable indicator of future results)
META Post Earnings Analysis
Options positioning in Meta shares is not much different from what was seen in Tesla and Netflix last week, with the only exception being that the implied post-earnings move is expected to be smaller, at just 6%. Gamma positioning in Meta is positive, meaning that market makers will generally be buyers of the stock on pullbacks and sellers if the shares move higher, if the stock remains in positive gamma territory.
However, that gamma positioning would flip negative below $730, shifting market-maker hedging flows and putting downward pressure on the stock. In that scenario, the shares could fall towards the put wall around $680. Conversely, if the stock rises, the call wall appears to be near $750.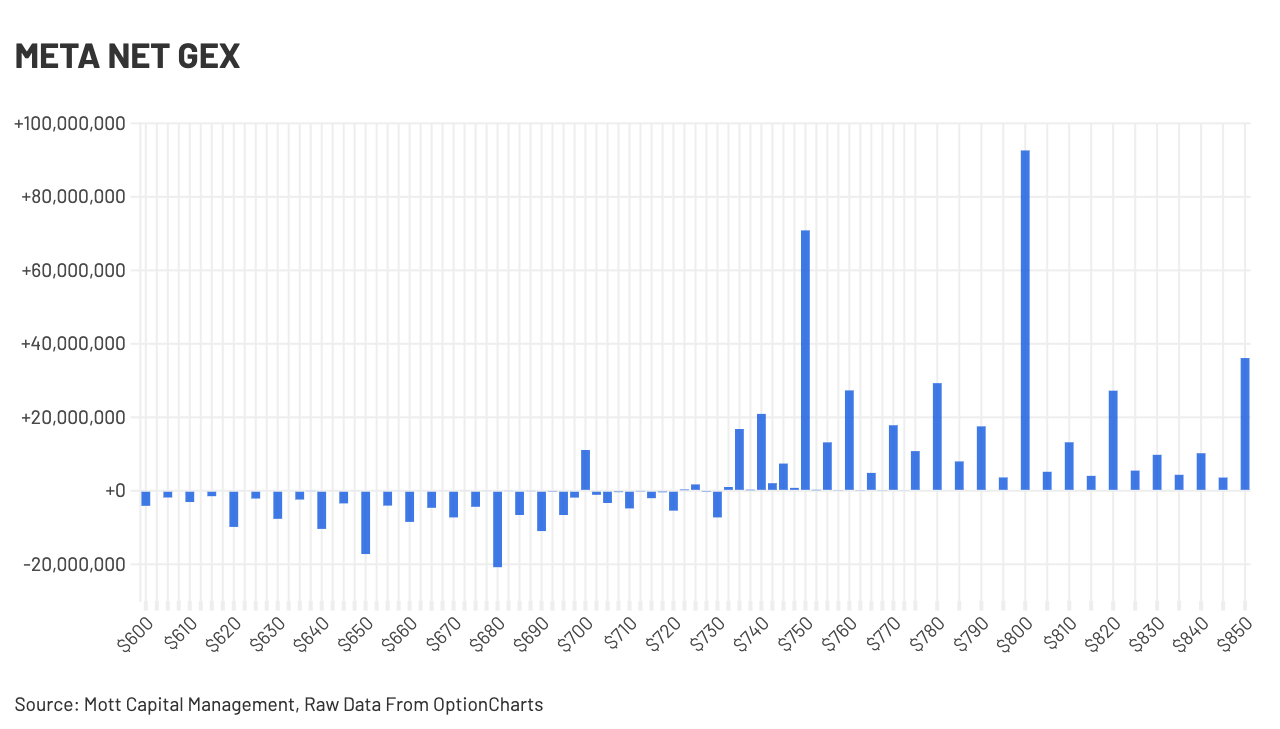
(Source: Mott Capital Management, Raw Data From OptionsCharts)
(Past performance is not a reliable indicator of future results)
Meta’s stock has struggled and appears to be forming a double-top pattern. Additionally, volume levels have been falling, and the relative strength index has been trending lower — both bearish indications. If the stock falls below $710, it could easily move down to $680. If it manages to break out above $740, the upside appears limited to around $750, as option positioning suggests.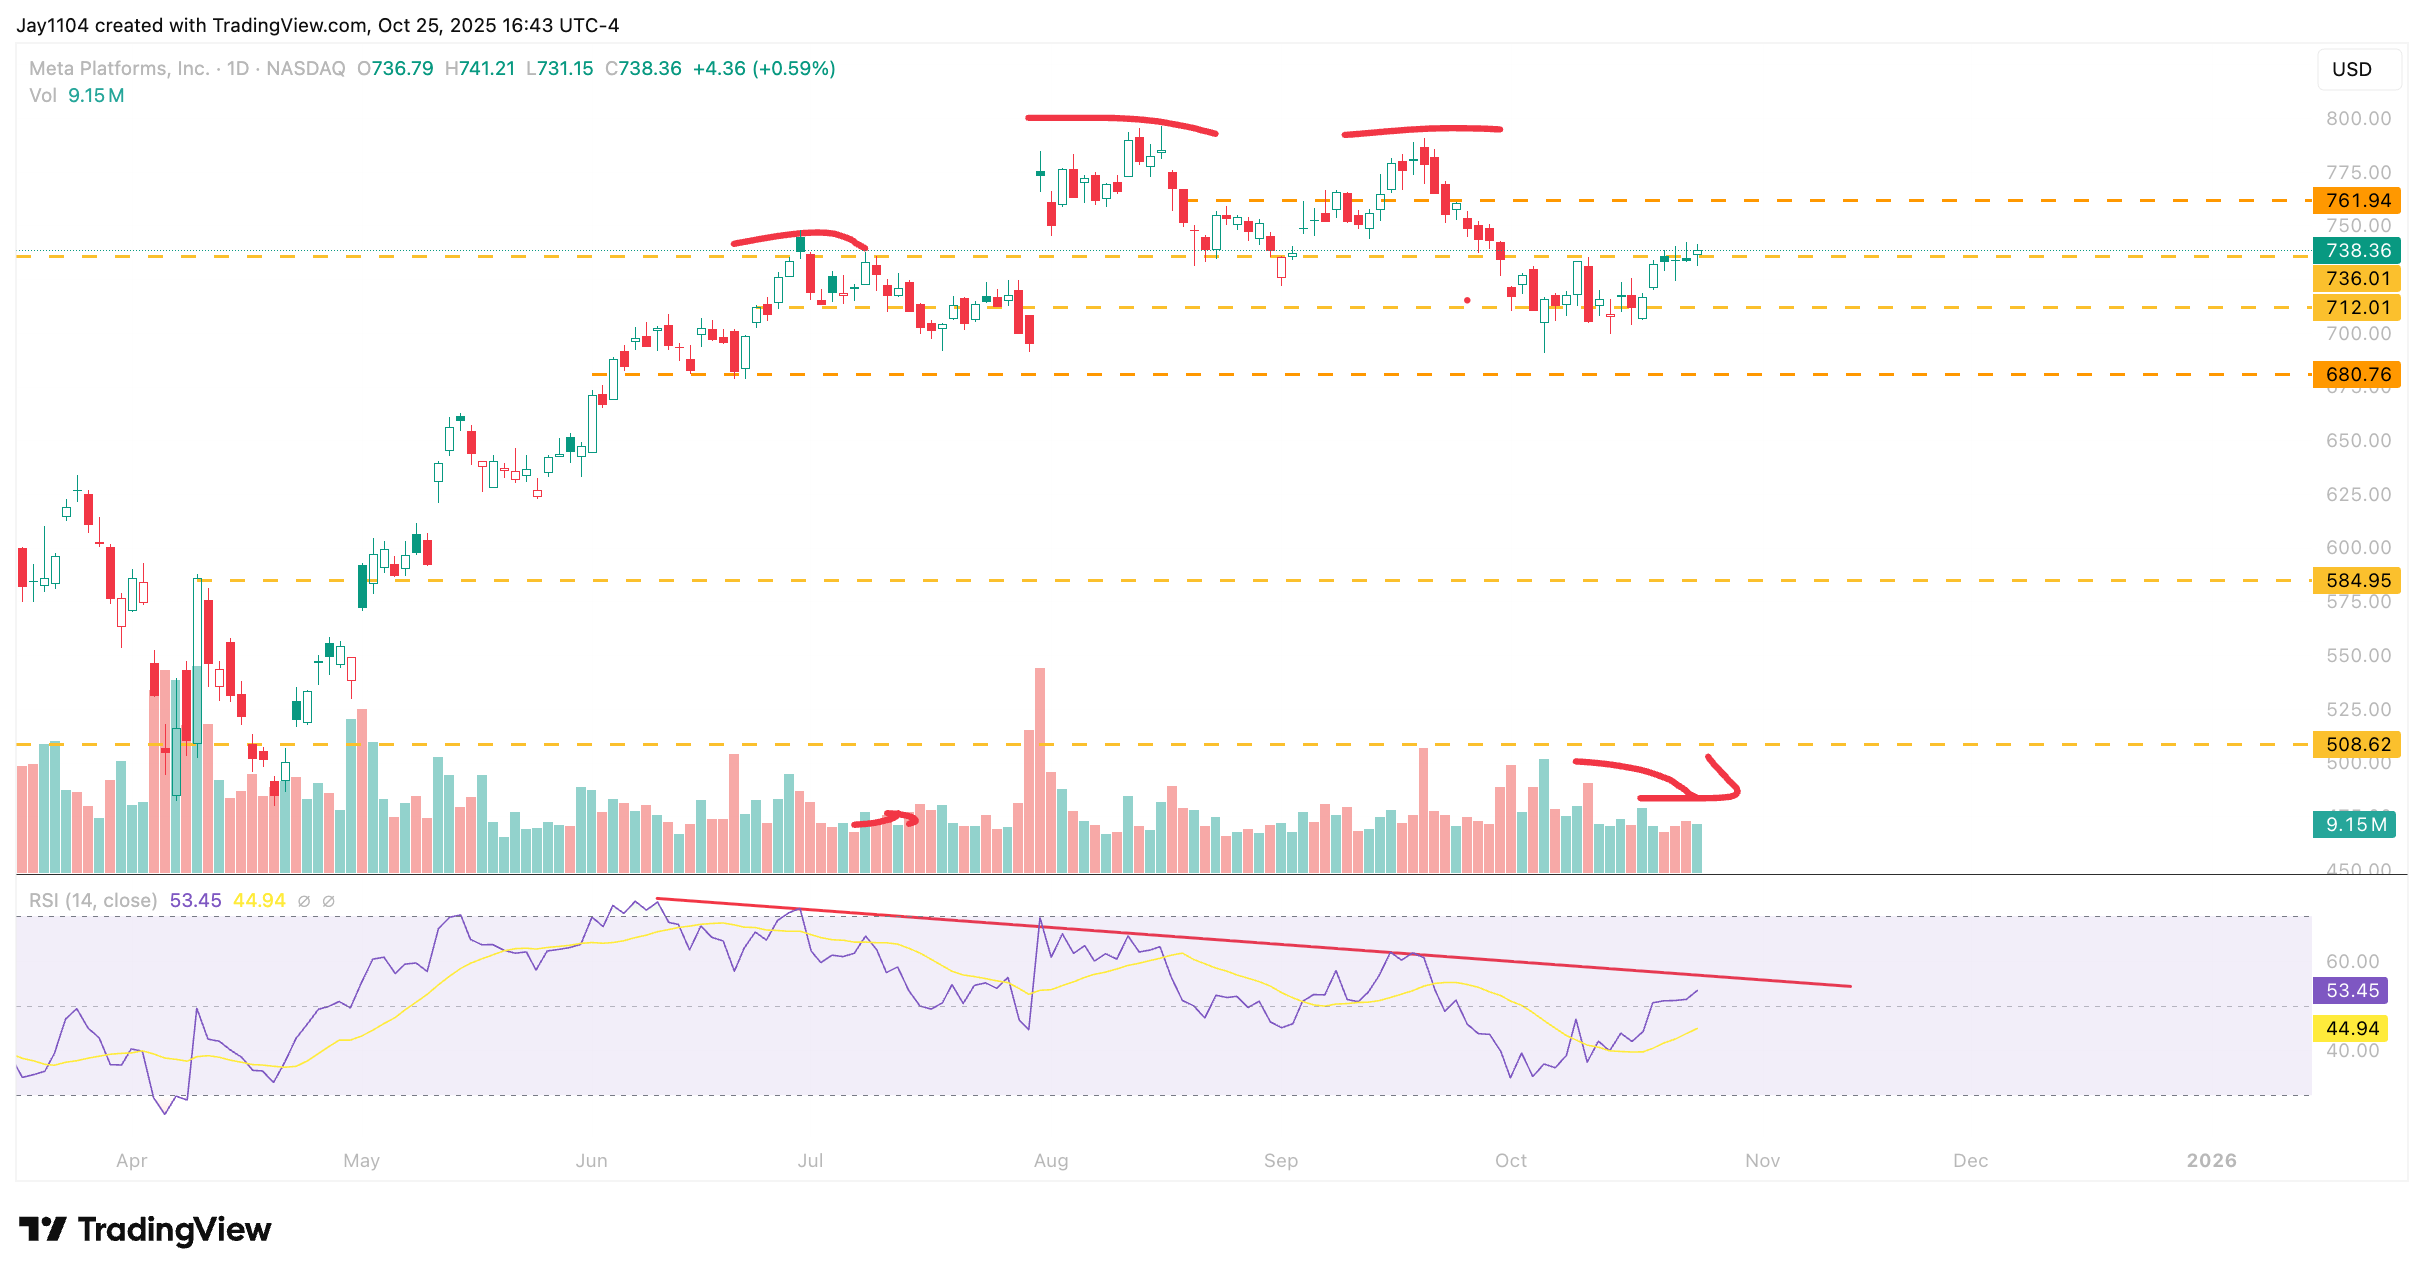
(Source: TradingView)
(Past performance is not a reliable indicator of future results)
Apple Post Earnings Analysis
Options positioning for Apple is also very bullish. However, the stock is expected to see only about a 3.5% post-earnings move, making it the least likely of the group to experience a significant move. From an options standpoint, Apple is also in a positive gamma positioning, but unlike Meta, the stock would need to fall much further to enter negative territory. This means that market-maker flows are likely to keep Apple’s share price relatively contained unless there is a major surprise in the actual earnings report.
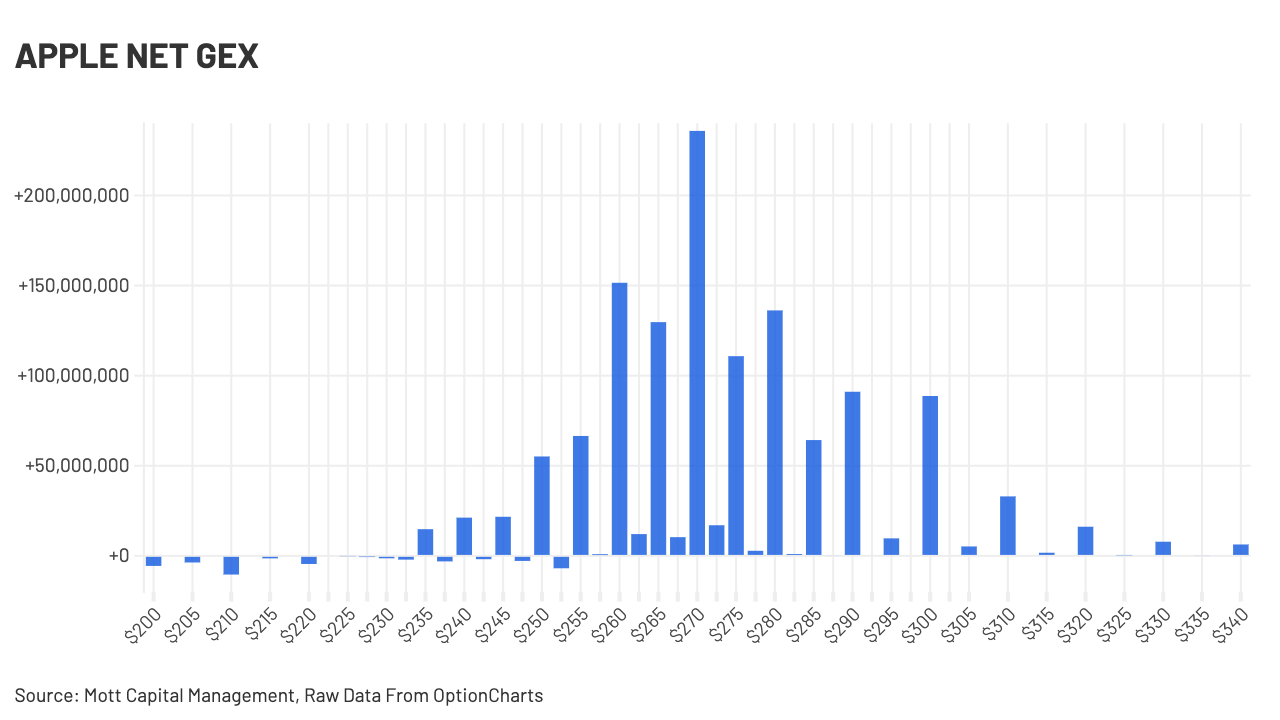
(Source: Mott Capital Management, Raw Data From OptionsCharts)
(Past performance is not a reliable indicator of future results)
It also means that the stock will not find it easy to advance beyond $270, where it is likely to become pinned due to the tremendous amount of call positioning at that level. For now, the stock is clearly trending higher within a trading channel, and with it near all-time highs, there is not much in the way of resistance from a technical perspective to stop the shares from rising following results. However, the upside is probably limited to around the $270 level.
Downside also appears limited, with room for the shares to fall to around $240, at least on a technical basis. This area has served as both support and resistance since early September.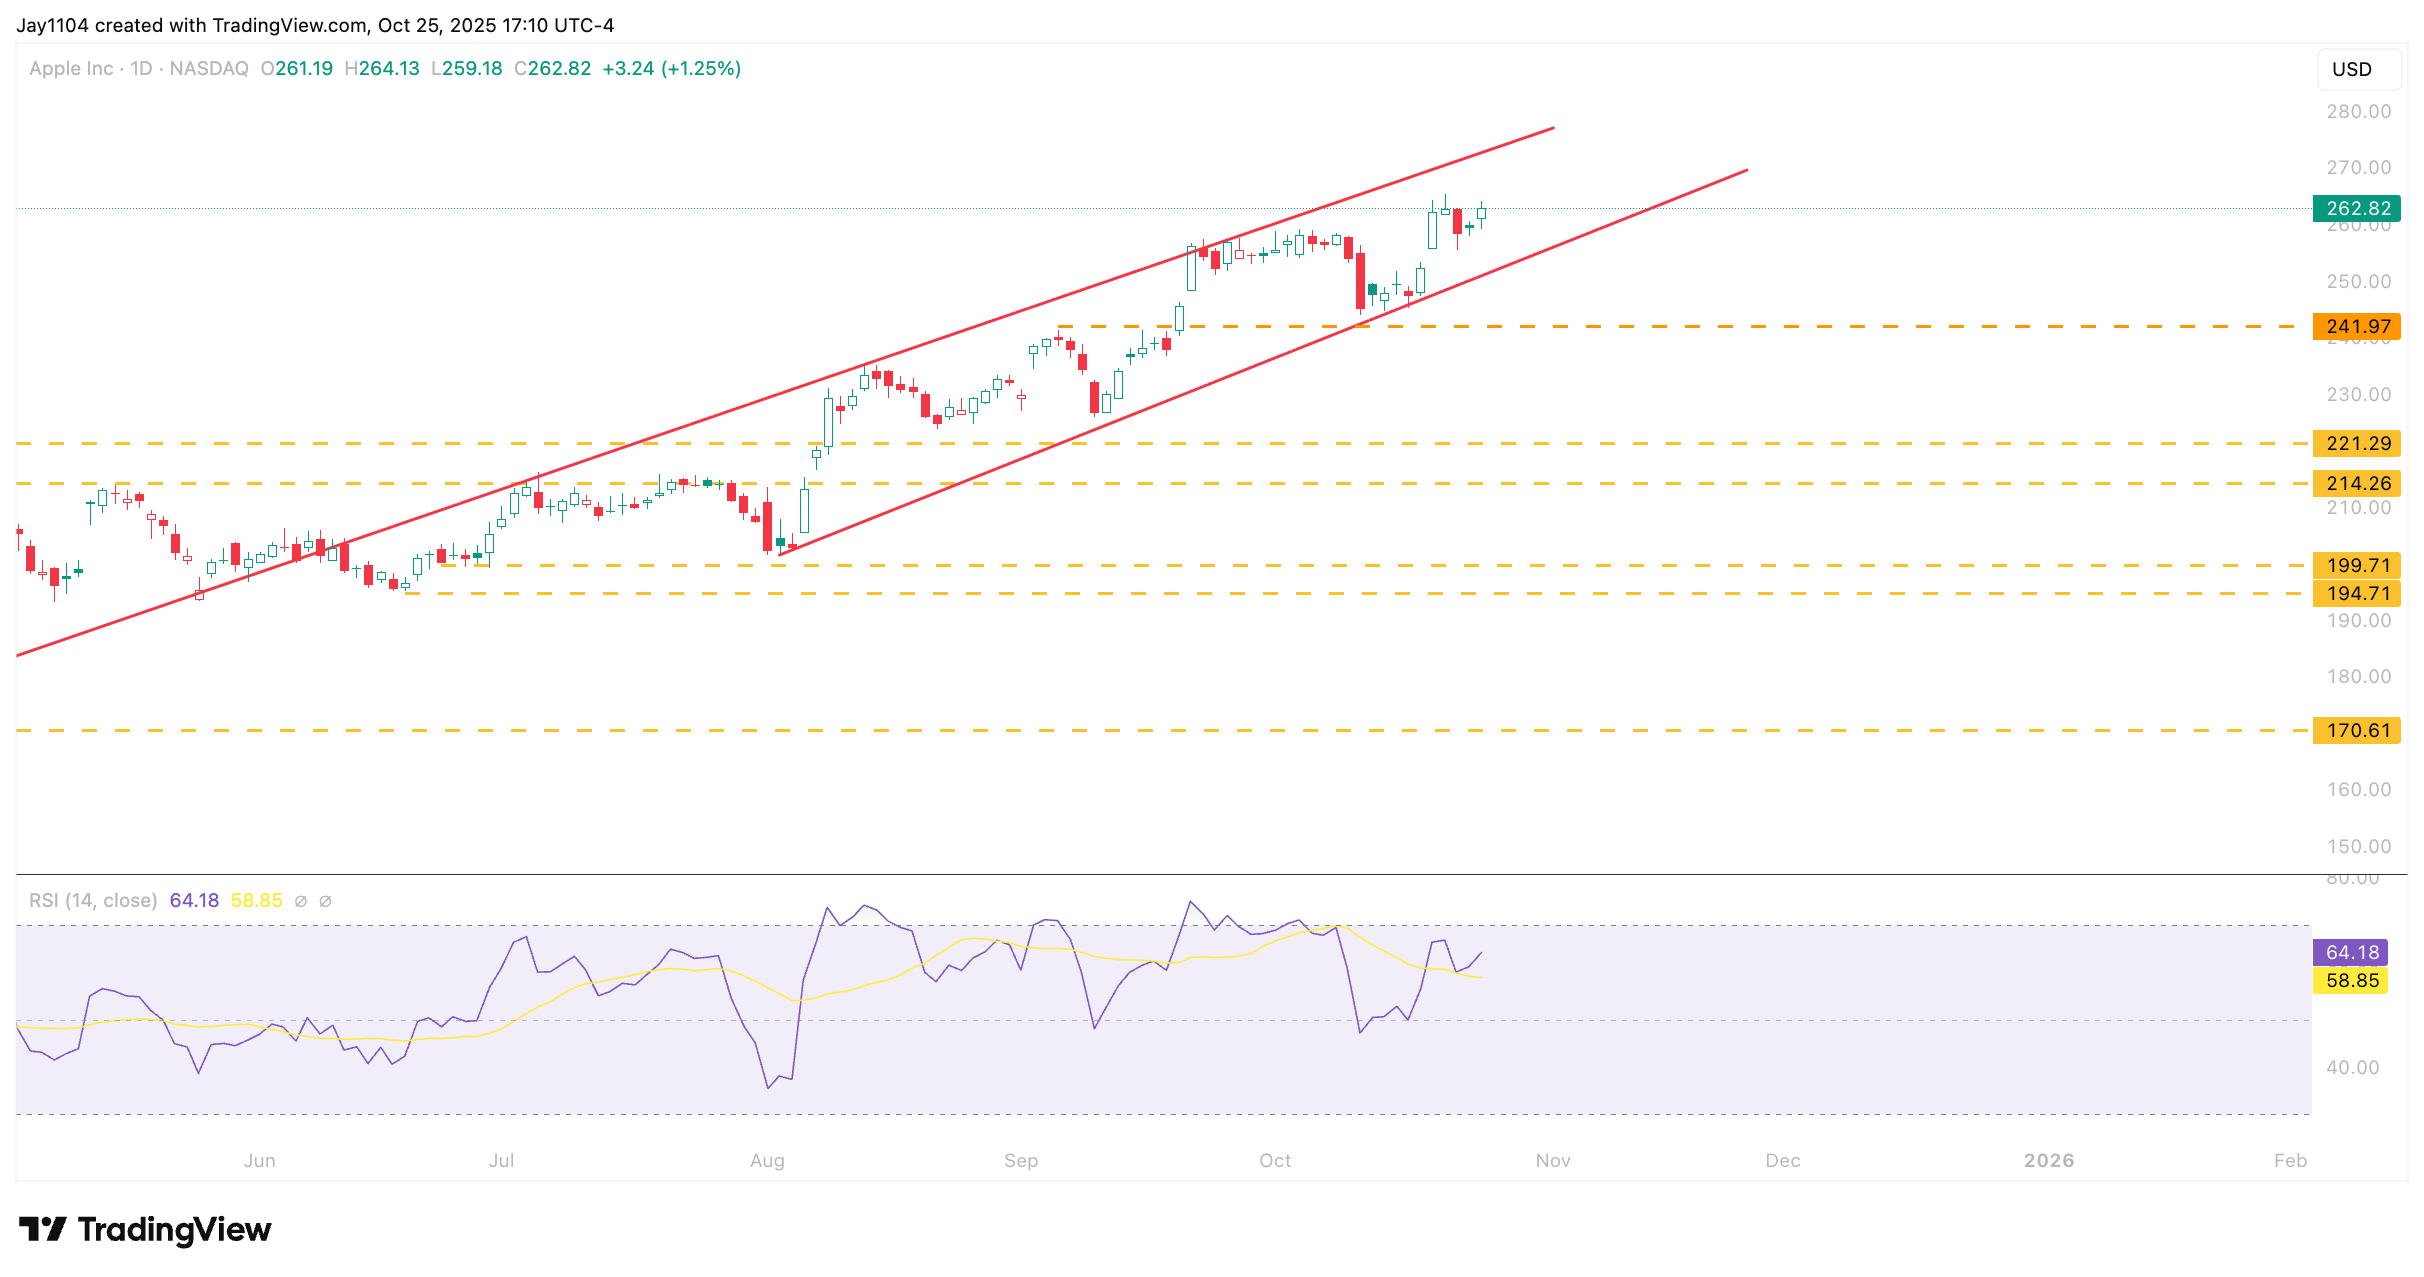
(Source: TradingView)
(Past performance is not a reliable indicator of future results)