

Microsoft stock forecast: Azure revenue, reporting changes
Microsoft is a US technology company. In fiscal 2026, Azure revenue reached $101.9bn, while the company announced new reporting segments for fiscal 2027. Explore third-party MSFT price targets and technical analysis. Past performance is not a reliable indicator of future results.
Microsoft Corp. (MSFT) ) traded at $491.80 as of 10:28am UTC on 10 September 2026, within the session's $490.30–$494.07 range. Past performance is not a reliable indicator of future results.
Recent attention has centred on Microsoft's expanded Azure financial disclosure. Azure generated $29.4bn in quarterly revenue and $101.9bn for fiscal 2026, while Microsoft plans to reorganise its reporting into 'Agents and Infra' and 'Devices and Consumer' from fiscal 2027 (TradingView, 8 September 2026). Chief Financial Officer Amy Hood also highlighted faster Azure hardware deployment and agentic AI products including Agent 365 and Copilot on 9 September (Yahoo Finance, 9 September 2026).
Third-party Microsoft outlook: Azure reporting and AI spending
As of 10 September 2026, third-party Microsoft stock predictions reflect different assumptions around Azure growth, AI monetisation and capital spending. The following summarises selected 12-month broker and consensus estimates.
Stifel
Stifel sets a $530 12-month target and maintains a hold rating as of 4 September 2026. The target reflects 2027 earnings assumptions linked partly to Copilot adoption and wider AI demand (MarketScreener, 4 September 2026).
MarketBeat
MarketBeat's aggregation of 47 analysts points to an average 12-month target of $564.27, with a moderate-buy consensus rating as of 6 September 2026. Contributing forecasts from Oppenheimer, Wolfe Research, Benchmark and Goldman Sachs range from $515–$640 (MarketBeat, 6 September 2026).
TipRanks
TipRanks reports an average 12-month target of $568.31 across Wall Street coverage, compared with a $496.82 closing price referenced in its 3 September update. Its strong-buy consensus reflects analysts' expectations for continued cloud and AI-related revenue growth (TipRanks, 3 September 2026).
Bank of America
Bank of America Securities sets a 12-month target of $600 with a buy rating as of 1 September 2026. The broker applies a 28x calendar-year 2027 price-to-earnings multiple and cites expectations for continued Azure growth (Investing.com, 1 September 2026).
Morgan Stanley
Morgan Stanley's Adam Wood sets a $600 target with an overweight rating as of 3 September 2026. The analyst expects Microsoft's revised segment reporting to provide greater visibility into Azure consumption and cloud margins (TipRanks, 3 September 2026).
Predictions and third-party forecasts are inherently uncertain, as they cannot fully account for unexpected market developments. Past performance is not a reliable indicator of future results.
Microsoft (MSFT) earnings outlook
Microsoft reported its fourth-quarter fiscal 2026 results on 29 July. Revenue reached $90bn, up 18% year on year, while operating income rose 18% to $40.6bn. Diluted earnings per share reached $4.81 on a GAAP basis, up 32%, or $4.74 on a non-GAAP basis, up 23% after adjusting for the impact of Microsoft's OpenAI investment (Microsoft IR, 29 July 2026).
Microsoft Cloud revenue reached $59.3bn, up 27%, while Azure revenue grew 43%. Full-year Azure revenue exceeded $100bn for the first time (Yahoo Finance, 30 July 2026).
For the first quarter of fiscal 2027, Chief Financial Officer Amy Hood said Microsoft expects revenue of $89.85bn–$90.95bn, equivalent to 16%–17% year-on-year growth. Management also expects free cash flow to remain positive in fiscal 2027, although continued capital investment may affect its level (The Globe and Mail, 4 August 2026).
Microsoft has not formally confirmed its next earnings date. Based on its previous reporting schedule, MarketBeat estimates Q1 fiscal 2027 results may be published on 28 October 2026 after market close (MarketBeat, 29 July 2026).
Company guidance and third-party estimates reflect assumptions that may change. Past performance is not a reliable indicator of future results.
MSFT stock price: technical overview
As of 10:28am UTC on 10 September 2026, TradingView data shows the MSFT stock price at $491.80, below its 20-day simple moving average near $494 but above its 50-, 100- and 200-day averages at approximately $449, $430 and $431 respectively. The 20-day exponential moving average sits nearby at around $491, while the 20-day simple moving average remains above the 50-day average.
The 14-day relative strength index (RSI) stands at 54.62, within neutral territory. The average directional index (ADX) at 36.25 indicates an established trend but does not show its direction on its own.
Above the latest price, the 20-day moving average near $494 and classic pivot around $500 provide nearby references, followed by R1 near $525 and R2 around $543. Below the price, S1 sits near $482, followed by the 50-day moving average around $449 and the 100- and 200-day averages near $430–$431.
A move higher could bring $494 and $500 into focus before $525, while a decline could shift attention towards $482 and $449 (TradingView, 10 September 2026).
This is technical analysis for informational purposes only and does not constitute investment advice or a recommendation to buy or sell any instrument.
Microsoft share price history (2024–2026)
MSFT’s stock price has moved substantially over the past two years, from around $423 in September 2024 to $491.80 in September 2026, an increase of roughly 16%.
The stock moved higher through late 2024 before falling in early 2025, from a January high near $448 to a low of $341.55 on 7 April amid tariff-related market volatility. Shares then recovered through the summer, reaching an intraday high of $562.58 on 31 July following quarterly results, before ending 2025 at $483.72.
Microsoft moved lower again in 2026, reaching around $355 in June before recovering through July and August as investors reassessed Azure growth and AI-related demand. As of 10:28am UTC on 10 September, the shares traded near $491.80, around 1.7% higher year to date and approximately 1.7% below their $500.51 close on 10 September 2025.

Past performance is not a reliable indicator of future results. Share prices are indicative and may differ from live market prices.
Microsoft (MSFT): Capital.com analyst view
Microsoft's share price has seen sizeable moves in both directions over the past two years as expectations around cloud growth, AI investment and capital spending have changed. Shares fell during broader tariff-related volatility in April 2025 before recovering later that year, while 2026 brought another decline and subsequent rebound.
Azure and AI-related revenue growth could support earnings expectations if demand develops in line with or above expectations. Microsoft's substantial spending on data centres and AI infrastructure, however, could weigh on free cash flow or margins if revenue growth fails to keep pace. Slower cloud growth or weaker AI monetisation could also pressure valuations, while stronger adoption or improving returns on investment may work in the opposite direction.
Capital.com’s client sentiment for Microsoft CFDs
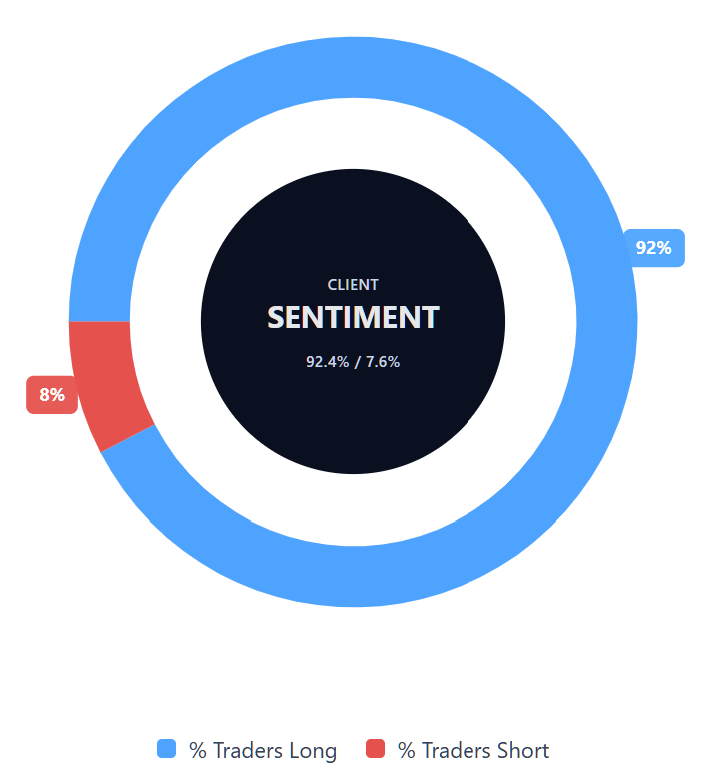
As of 10 September 2026, Capital.com client positioning in Microsoft CFDs is weighted towards long positions, with 92.4% long and 7.6% short. This reflects open positions on Capital.com at the time of measurement rather than future price direction and can change.
Summary – Microsoft 2026
- As of 10:28am UTC on 10 September 2026, Microsoft traded near $491.80, within an intraday range of $490.30–$494.07.
- According to TradingView data, the price sat below its 20-day moving average but above its 50-, 100- and 200-day averages, while RSI stood near 55 and ADX at 36.25.
- Key factors include Azure growth, AI monetisation, infrastructure spending and wider technology-sector valuations.
- Stronger cloud growth, AI adoption or improving returns on investment could support the shares, while slower growth, higher capital spending or margin pressure could weigh on them.
- Recent news centres on Microsoft's expanded Azure financial disclosure, revised segment structure and CFO commentary on AI and infrastructure investment.
Past performance is not a reliable indicator of future results.
FAQ
Who owns the most Microsoft stock?
What is the five-year Microsoft share price forecast?
Is Microsoft a good stock to buy?
Could Microsoft stock go up or down?
Yes. Microsoft shares can move in either direction as company-specific and broader market conditions change. Stronger Azure growth, wider Copilot adoption or improving returns from AI investment could support the share price. Slower cloud growth, higher infrastructure spending, weaker AI monetisation or margin pressure could weigh on it. Wider moves in technology-sector valuations may also influence Microsoft independently of company results, while analyst forecasts cannot reliably predict future price movements.
Should I invest in Microsoft stock?
Can I trade Microsoft CFDs on Capital.com?
Yes, you can trade Microsoft CFDs on Capital.com. Trading share CFDs lets you speculate on price movements without owning the underlying asset and to take long or short positions. However, contracts for difference (CFDs) are traded on margin, and leverage amplifies both profits and losses. You should ensure you understand how CFD trading works, assess your risk tolerance, and recognise that losses can occur quickly.