

Michael Kramer: How to Analyse Meta Before Earnings
Earnings announcements can be among the most closely watched events for individual stocks. Alongside the financial results themselves, investors often monitor historical earnings performance, valuation metrics and options pricing to provide context for prior reporting periods.
While none of these measures can predict future outcomes, they can provide historical context for the company's performance and for how the options market has priced uncertainty around previous earnings announcements.
The Results
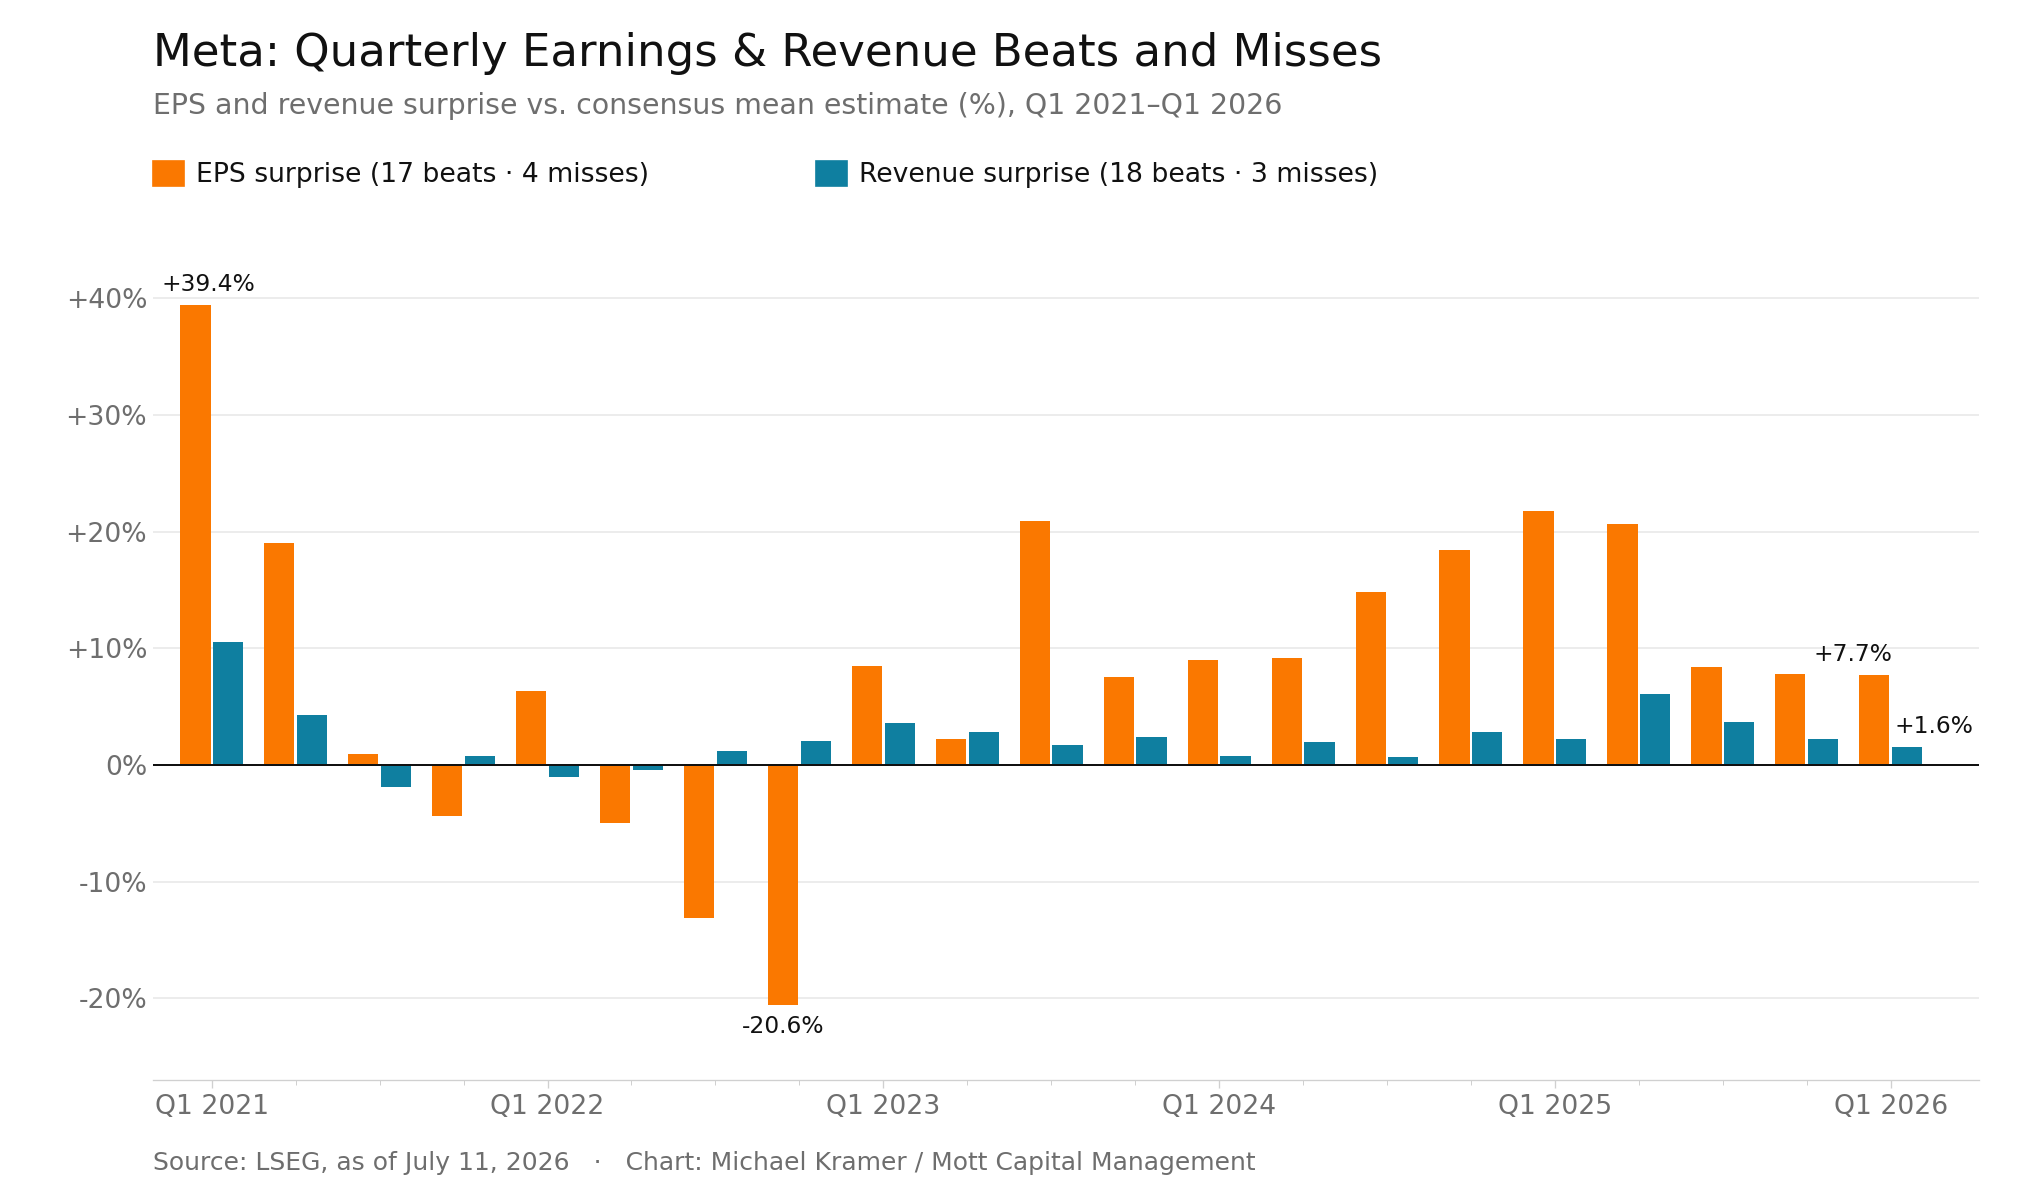
Meta has a history of reporting better-than-expected quarterly results for both earnings and revenue. Since the first quarter of 2021, Meta has beaten analysts’ revenue estimates 18 out of 21 times and earnings estimates 17 out of 21 times. Additionally, over the last 13 quarters, Meta has beaten analysts’ estimates for both revenue and earnings.
(Source: LSEG, as of 11 July 2026. Chart: Michael Kramer / Mott Capital Management)
(Past performance is not a reliable indicator of future results)
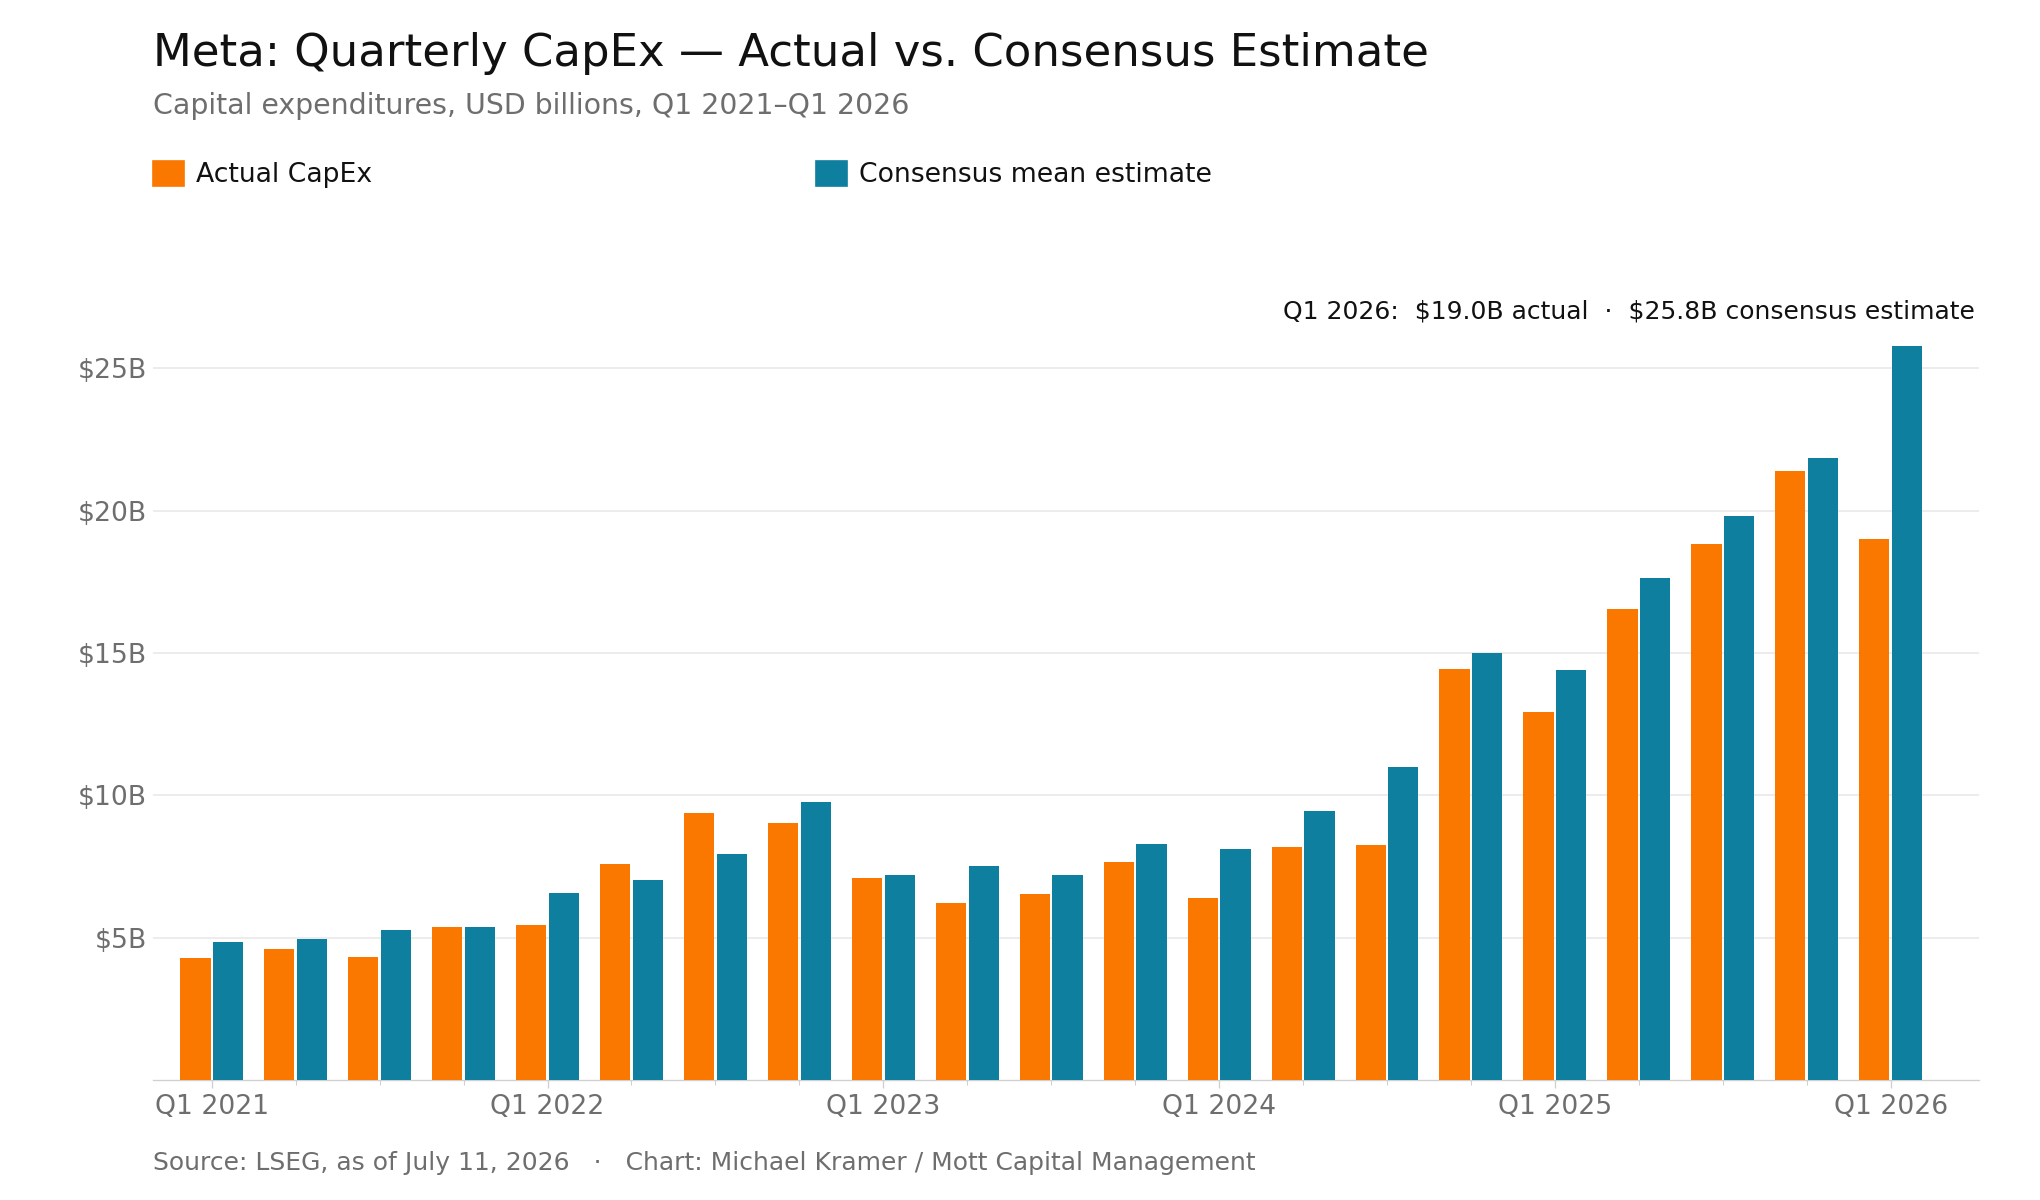
Investors also often monitor capital expenditure because it can provide insight into the pace of investment in infrastructure, including AI-related spending. Historically, Meta has often reported capital expenditure below analysts’ consensus estimates. Capital expenditure has ebbed and flowed over the years, with spending increasing in 2021 and falling in 2022. Spending began rising again in 2023 and has continued to increase since. The company tends to see capital expenditure peak in the fourth quarter and then fall in the first quarter of the new year.
(Source: LSEG, as of 11 July 2026. Chart: Michael Kramer / Mott Capital Management)
(Past performance is not a reliable indicator of future results)
Options Price Uncertainty
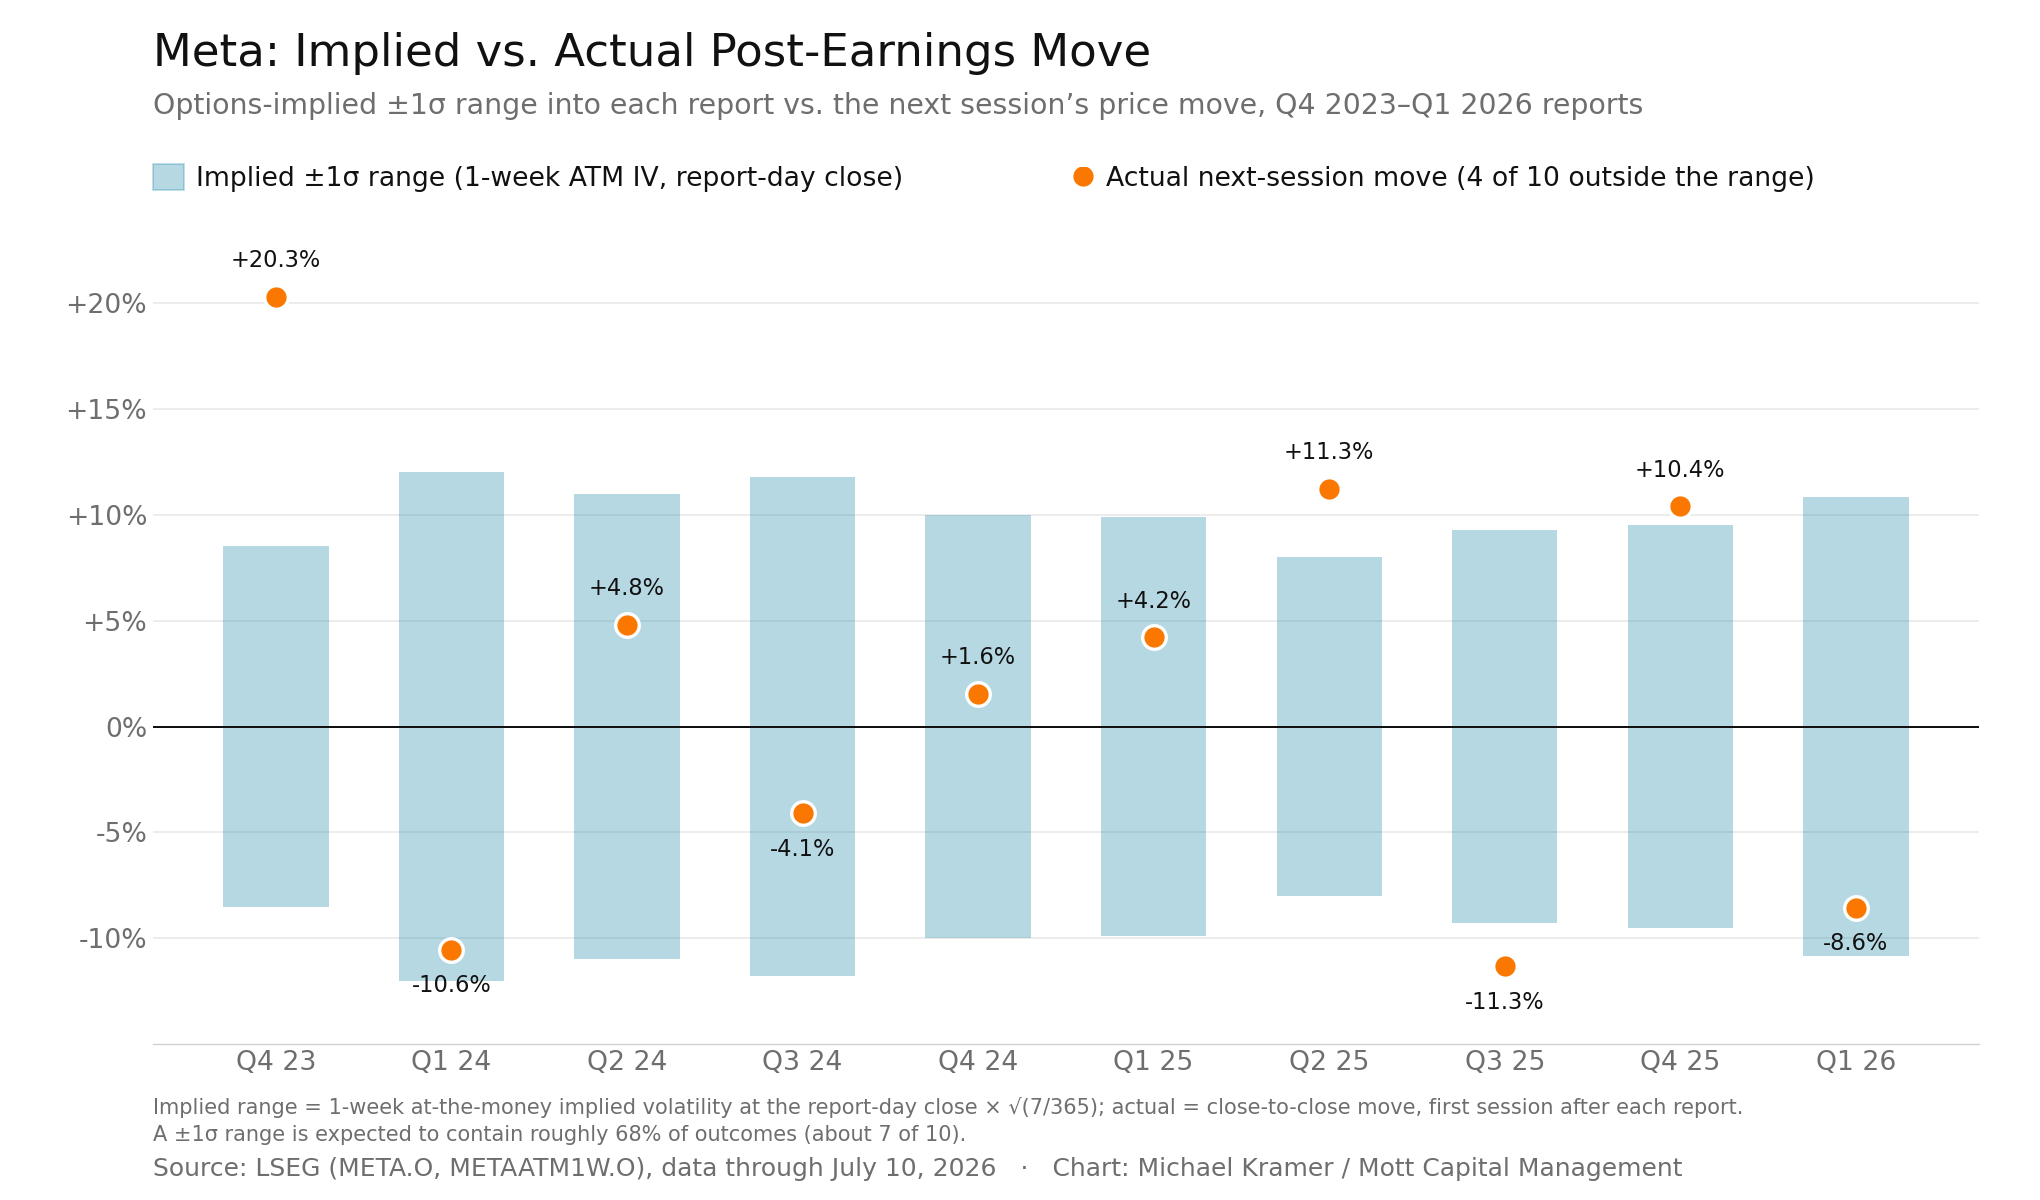
Options prices can be used to derive an implied trading range for a stock following earnings. Historically, the options market has typically priced a one-standard-deviation range of approximately ±6% to ±11% for Meta ahead of earnings, based on one-week at-the-money implied volatility. The subsequent share price movement has remained within the implied range in six of the ten earnings announcements shown and exceeded it in four cases. The implied range reflects market pricing rather than a forecast of the actual move.
The implied range was estimated using the one-week at-the-money implied volatility observed at the close on the day of the earnings announcement, scaled to the option's one-week term (implied volatility × √(7/365)) and applied to the share price. This produces the one-standard-deviation range implied by option prices and does not represent a forecast of the actual share price move.
The implied range can provide context for how much uncertainty option prices are reflecting ahead of the results. It does not indicate the direction of any potential share price move.
(Source: LSEG (META.O, METAATM1W.O) data through July 10 2026. Chart: Michael Kramer / Mott Capital Management)
(Past performance is not a reliable indicator of future results)
Since the fourth quarter of 2023, Meta’s shares have risen following earnings announcements in six of the ten quarters shown, with an average gain of 8.8% across those six positive reactions. However, outcomes have varied widely, ranging from a 20.3% gain to an 11.3% decline. Over the period shown, Meta alternated between gains and losses following each earnings announcement from Q2 2025 through Q1 2026.
Valuation Metrics
As of 10 July 2026, Meta’s forward price-to-earnings ratio, based on analysts’ estimates for the next twelve months, is 19.6. From September 2019 through July 2026, Meta's average P/E was 21.6, and its median was 22.1, so its P/E is below both its historical average and median over the period.
Historical valuation multiples provide context for how the market has priced the company over time. They do not indicate whether the shares are currently overvalued or undervalued.
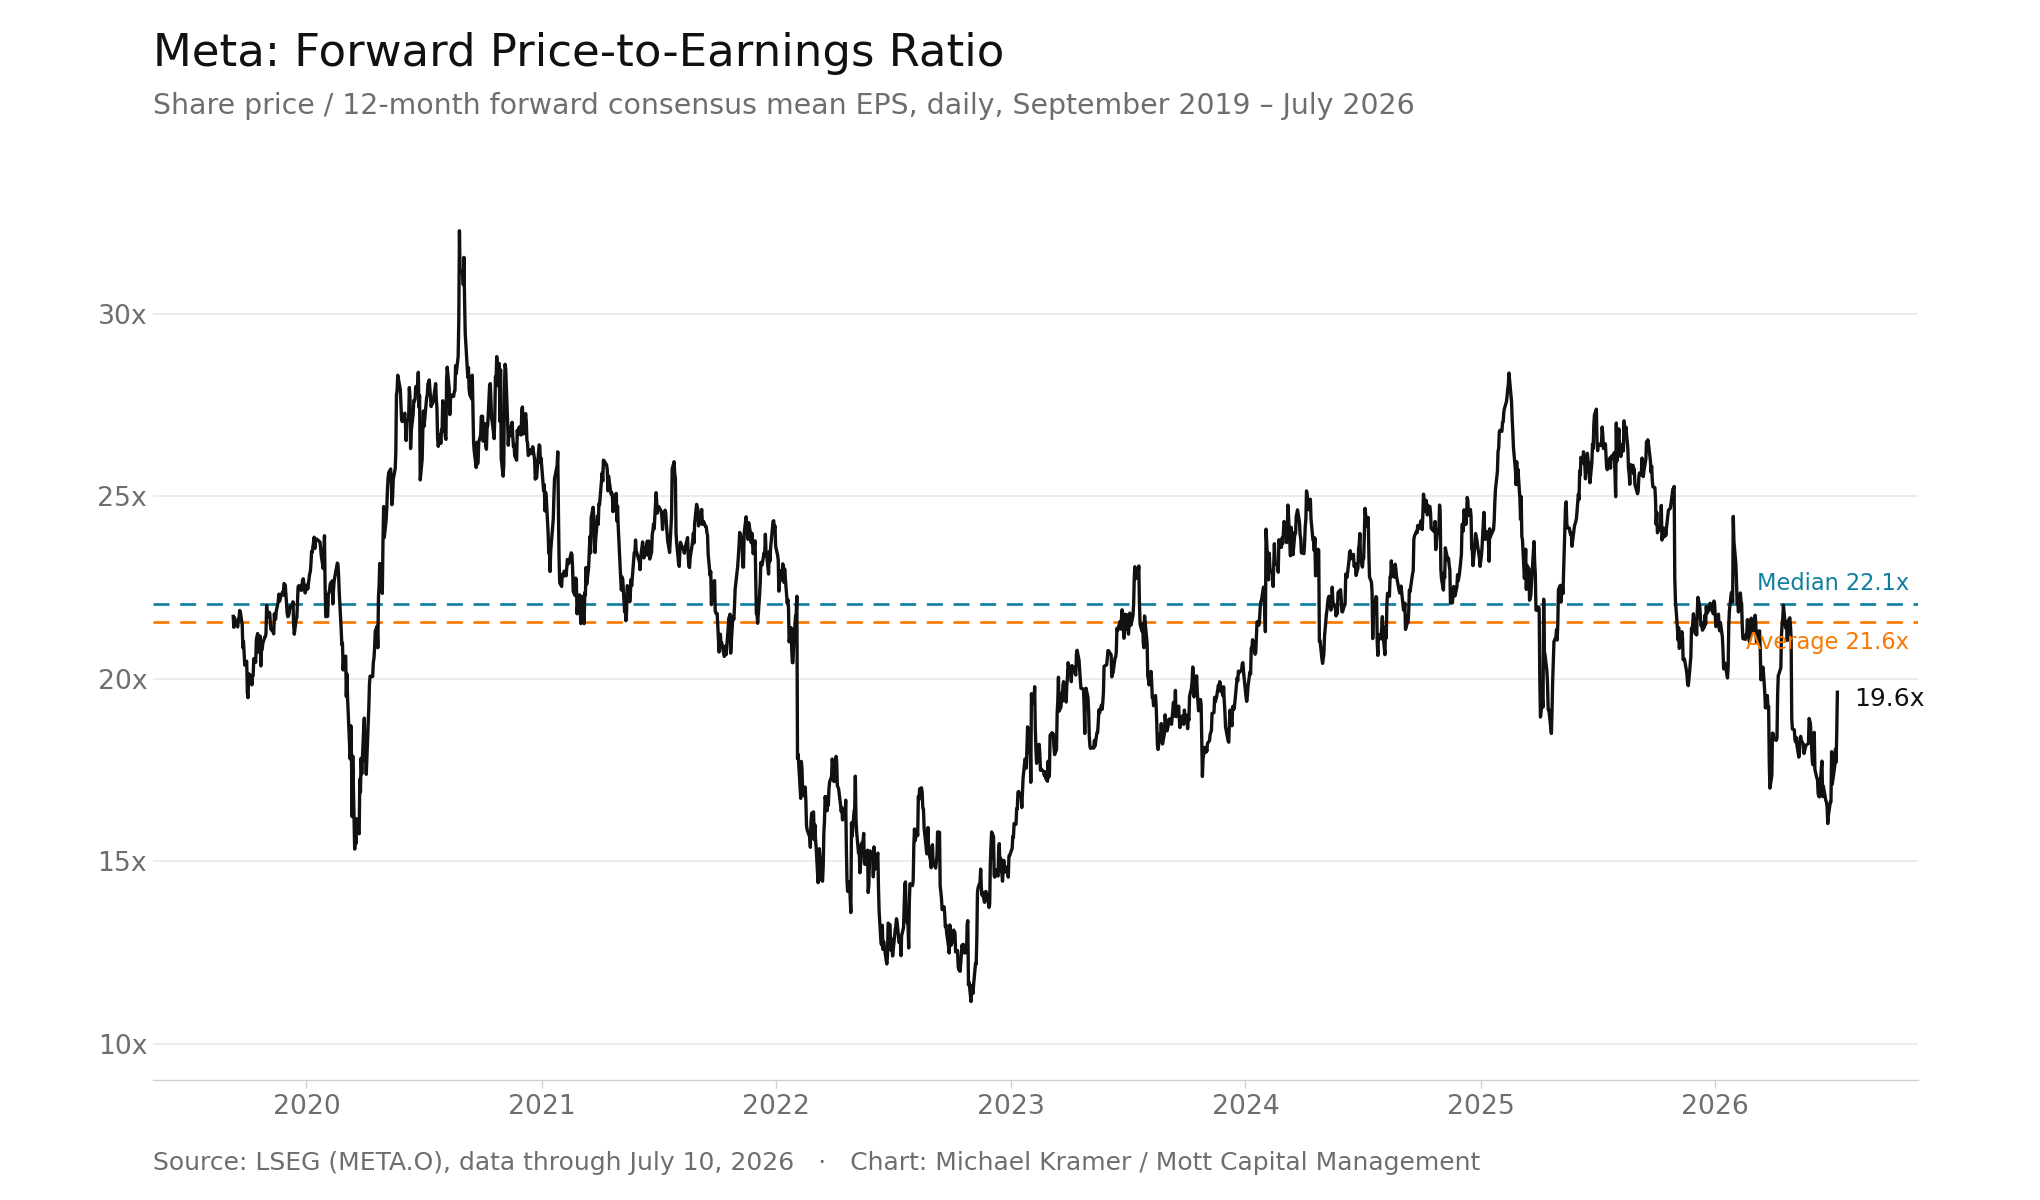
(Source: LSEG (META.O) data through July 10 2026. Chart: Michael Kramer / Mott Capital Management)
(Past performance is not a reliable indicator of future results)
As of 10 July 2026, Meta’s forward price-to-sales ratio, based on analysts’ consensus next-twelve-month revenue estimates, was 6.0. From September 2019 through July 2026, its average P/S ratio was 6.4, and its median was 6.8, so the ratio was below both its historical average and median over the period shown.
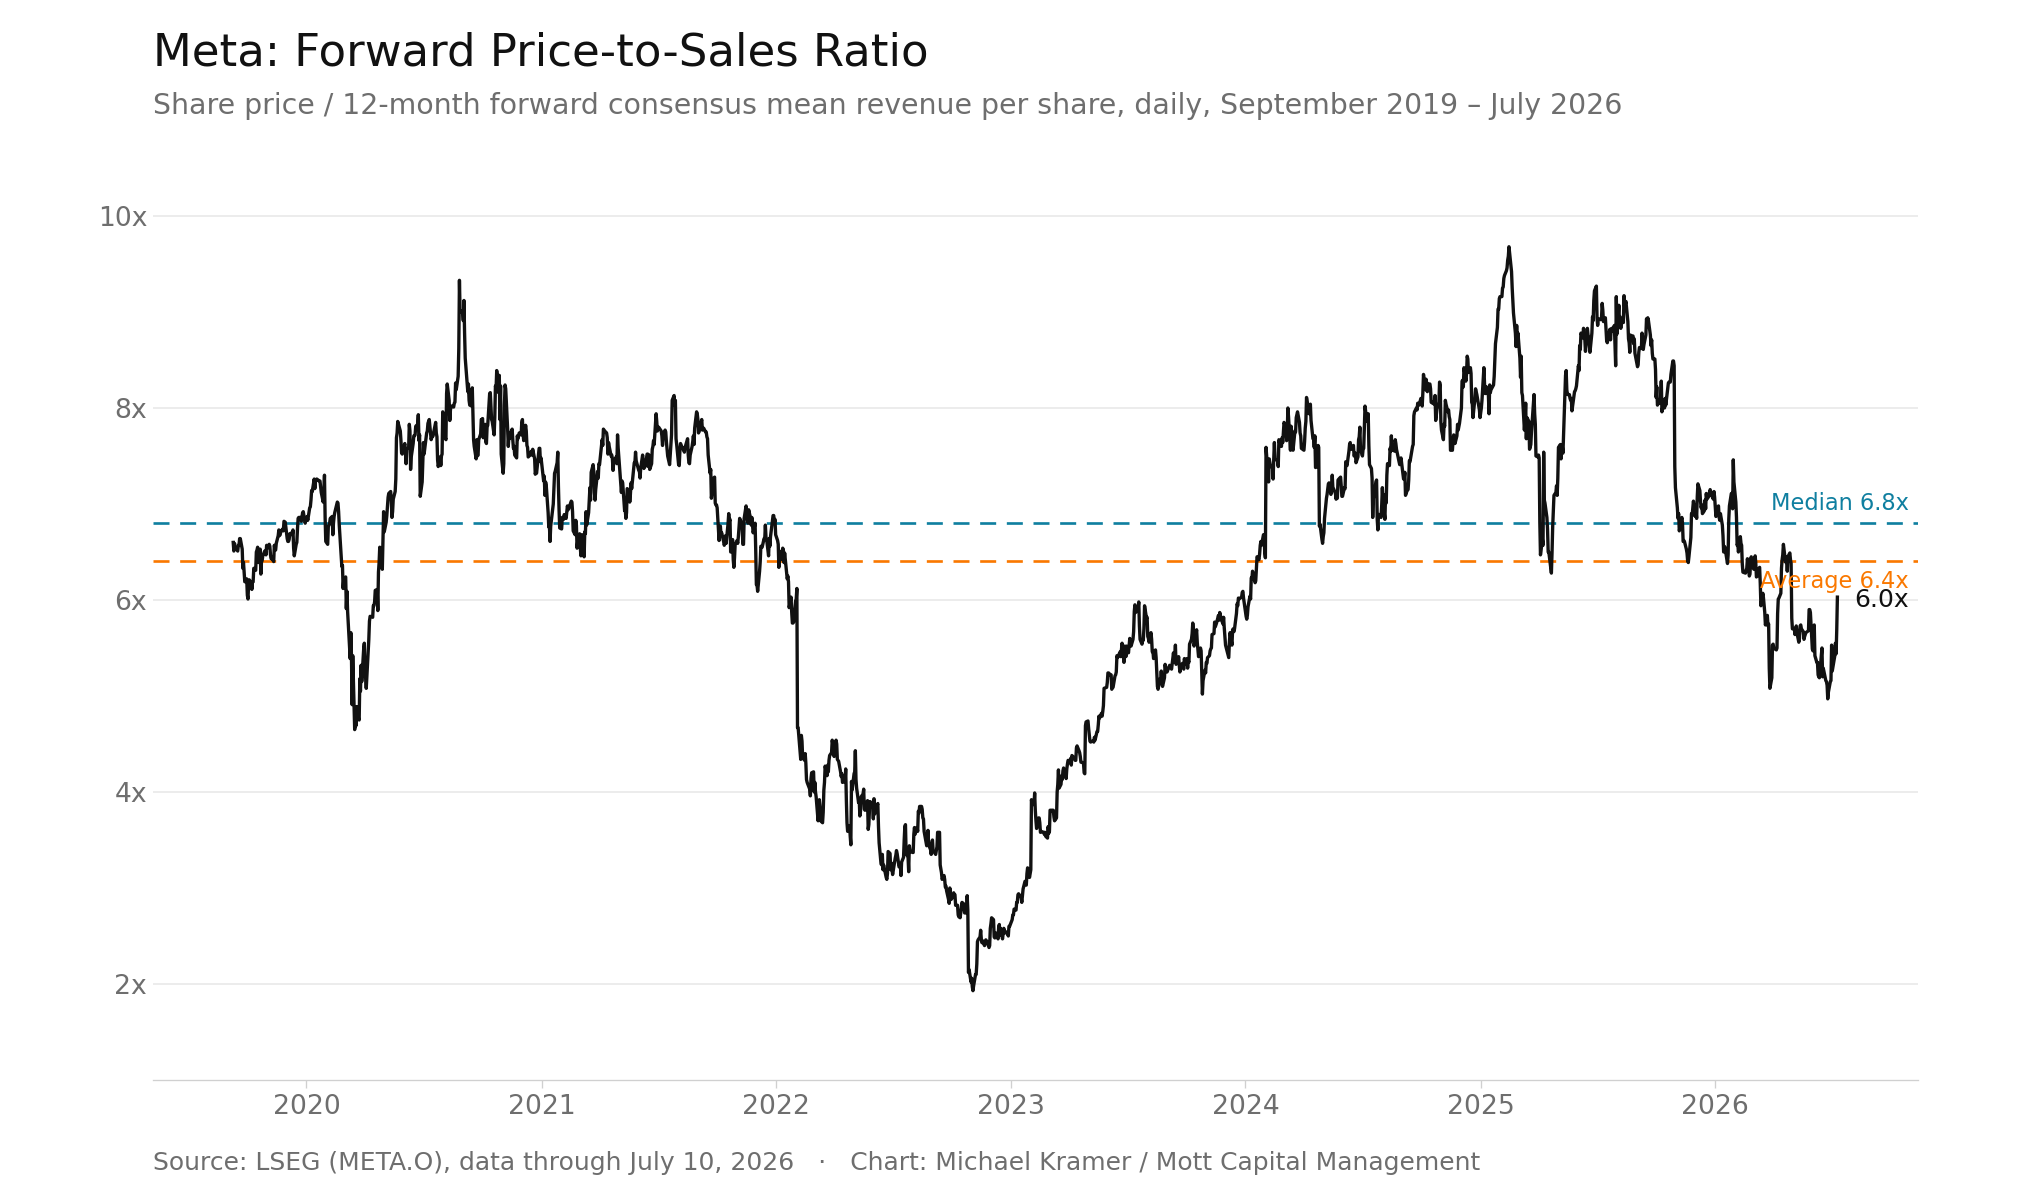
(Source: LSEG (META.O) data through July 10 2026. Chart: Michael Kramer / Mott Capital Management)
(Past performance is not a reliable indicator of future results)
Over the period shown, Meta’s trailing-twelve-month EPS recorded an average year-over-year growth rate of 28.6% across the quarterly observations, with a median of 19.3%. Revenue growth averaged 20.5%, with a median of 21.6%. In Q1 2026, revenue growth was above both its average and median, while EPS growth was below its average and in line with its median.
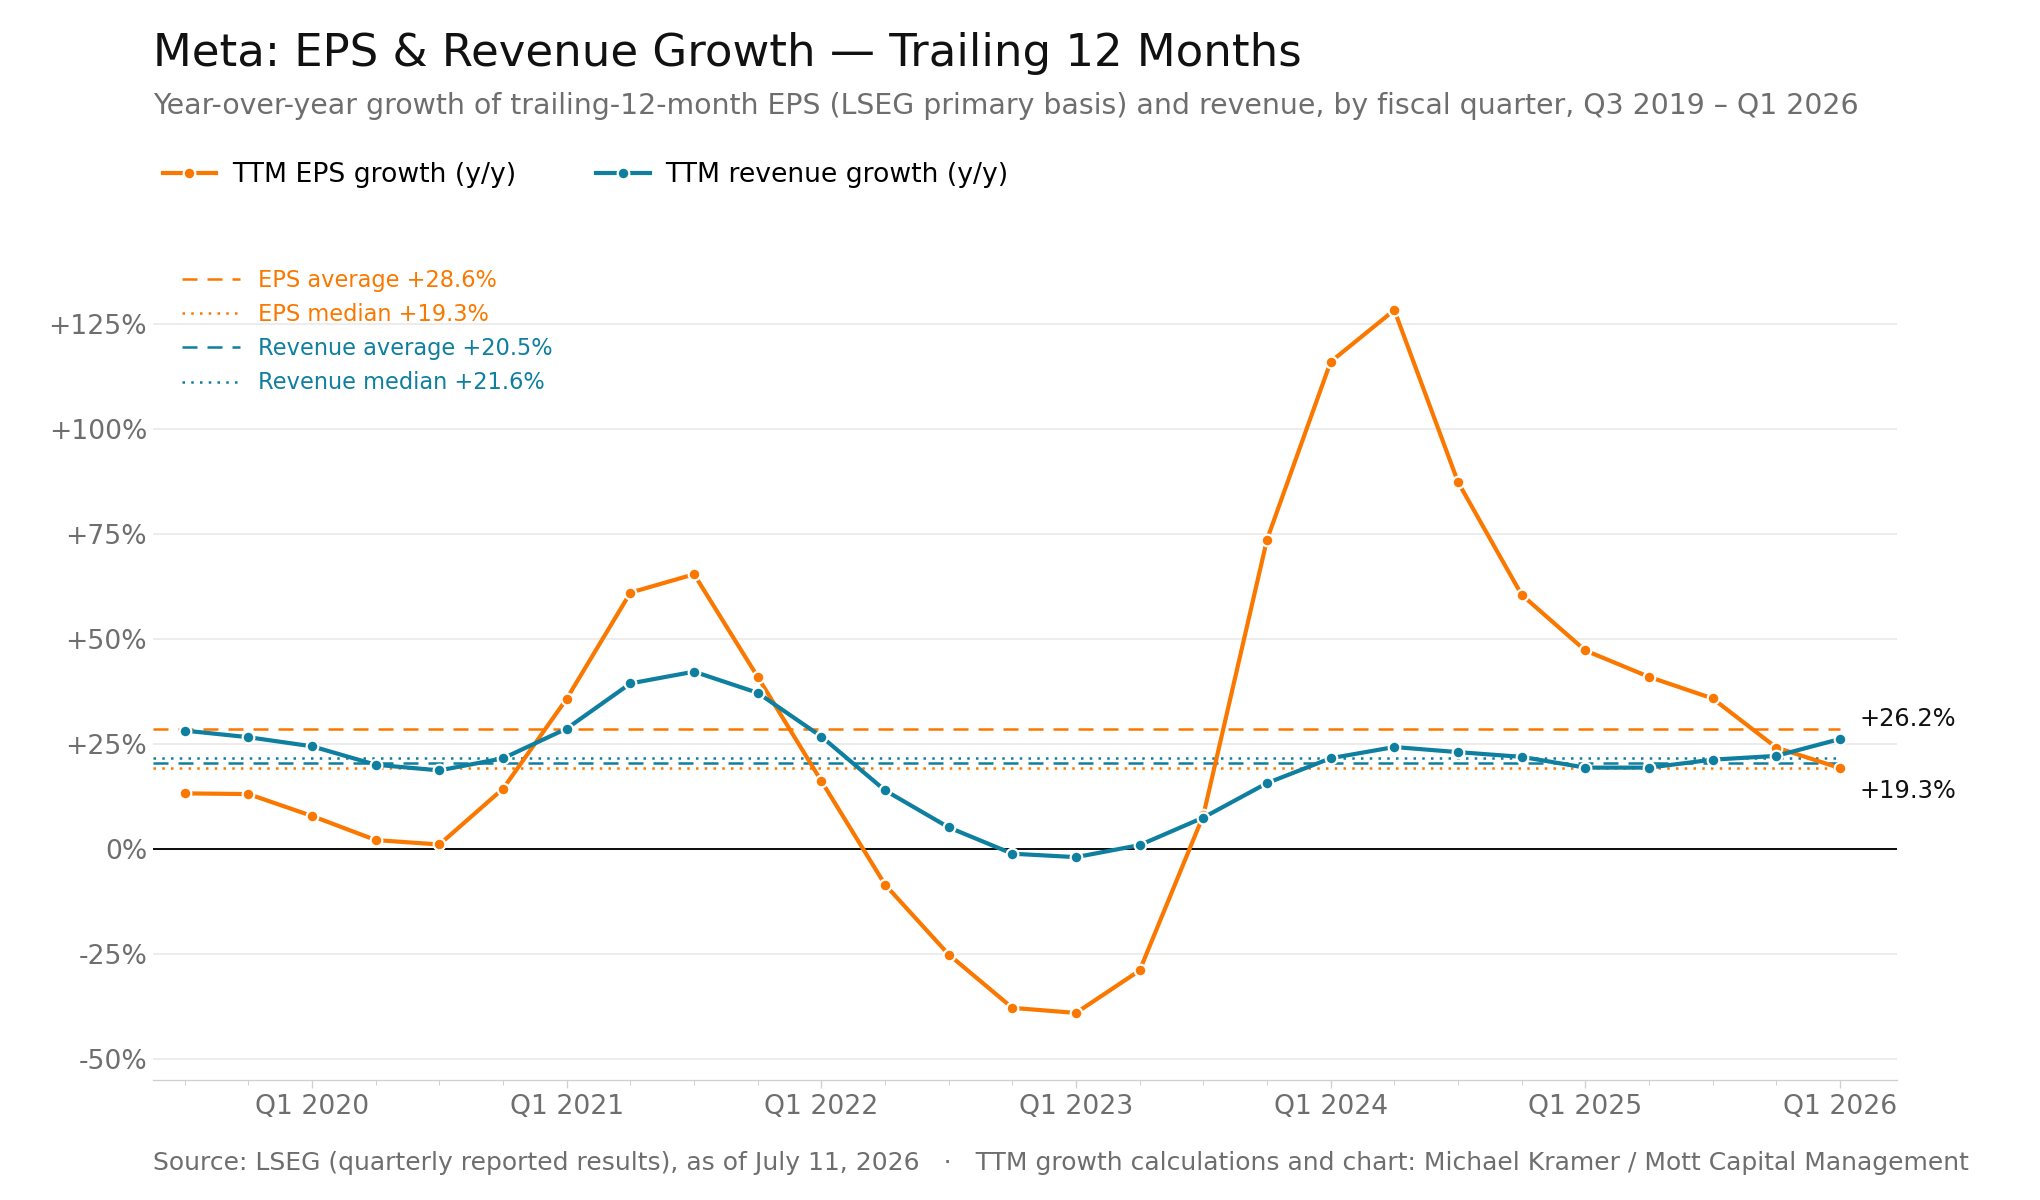
(Source: LSEG (quarterly reported results) as of July 11, 2026. TTM growth calculations and chart: Michael Kramer / Mott Capital Management)
(Past performance is not a reliable indicator of future results)
Taken together, these historical measures provide context for how Meta has performed around previous earnings announcements and fundamental valuations at that time. While past performance and historical option pricing cannot predict future outcomes, they may help investors understand how the company has been valued, how the options market has priced uncertainty, and how the shares have reacted following the results.