How to use the average true range (ATR) in day trading
Volatility is a feature of every market, influencing how prices move from one moment to the next. To interpret this movement more clearly, traders often rely on indicators that look beyond direction alone. One such tool is the average true range (ATR) – a straightforward and widely used measure that helps illustrate how active a market is.
Explore the average true range (ATR) – a simple yet widely used tool for assessing volatility. We’ll explain how ATR helps you view price movement through a more informed lens and outline three practical ways it can support short-term trading decisions.
What is average true range (ATR)?
Average true range (ATR) measures market volatility by calculating the average range between a period’s high and low prices, factoring in any price gaps.
Without going into the full calculation, the key takeaway is that ATR shows how much a market typically moves within a given timeframe. This can give traders a sense of expected volatility rather than price direction.
On TradingView, the ATR indicator appears as a line beneath your chart. While it can be applied to any timeframe, it’s most commonly used on the daily chart. In this context, ATR shows how far a market has typically moved – up or down – within a single day.
Daily ATR on Daily Candle Chart
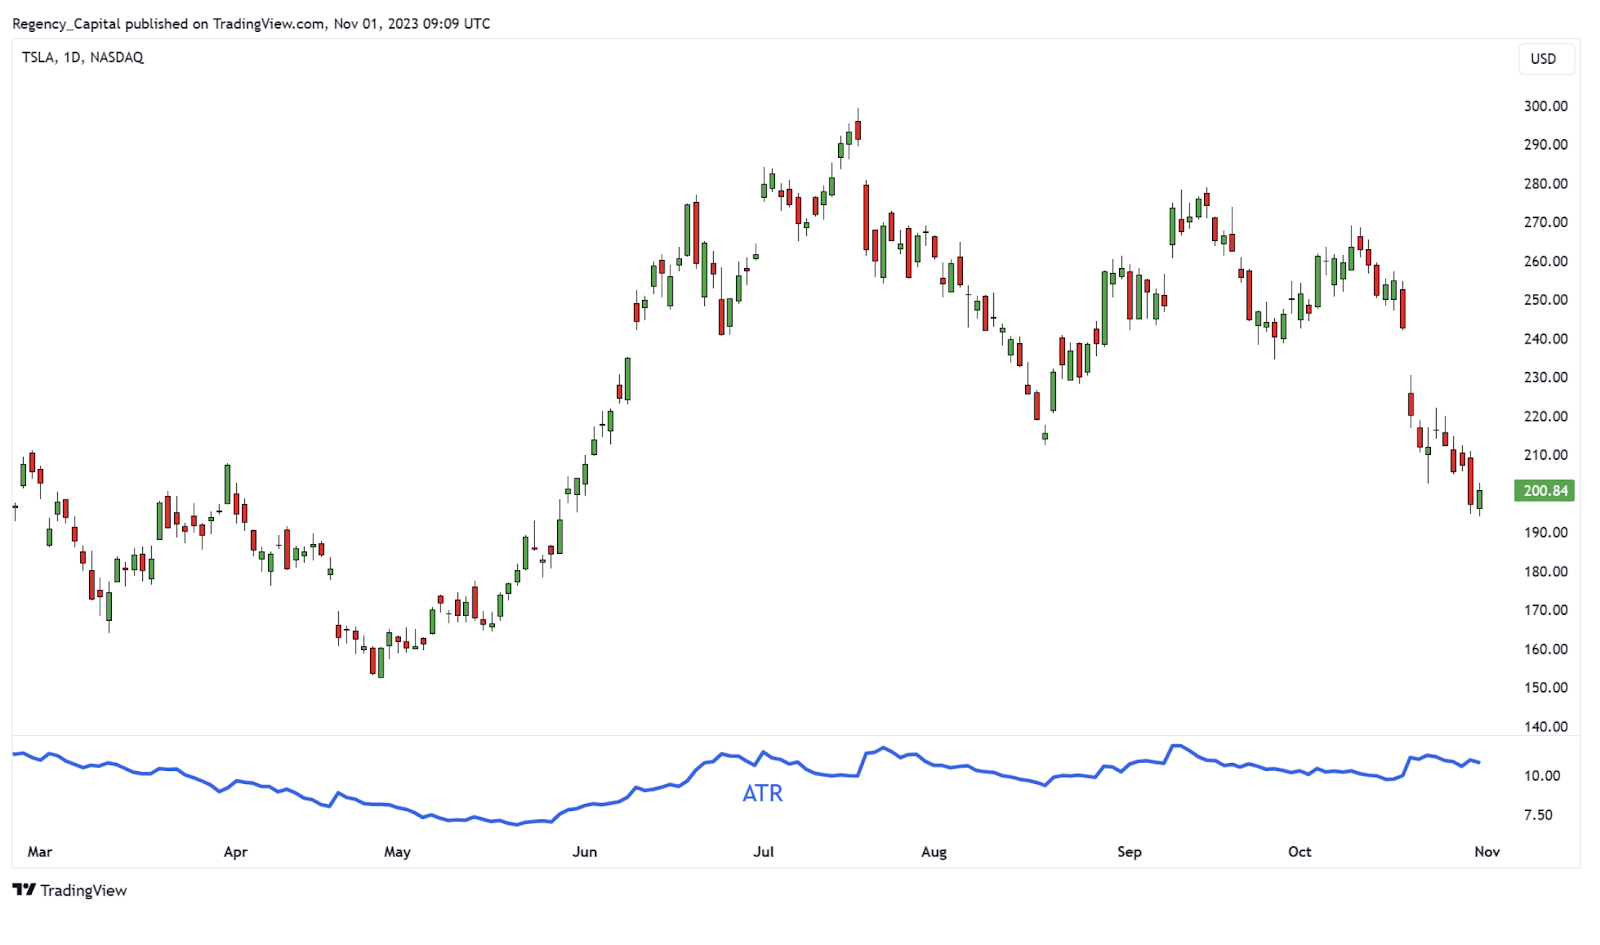
Past performance is not a reliable indicator of future results.
Using ATR to analyse price movements
It’s easy to be drawn to lists of top daily gainers and losers. These highlight which markets have moved most by percentage – but percentage change alone doesn’t always reflect true volatility.
This is where ATR comes in. It contextualises price movement, allowing traders to compare a market’s current range with its usual behaviour or that of similar assets. ATR doesn’t predict direction or signal entry points. It simply standardises volatility, helping traders interpret price activity more objectively.
Three ways to use ATR when day trading
While ATR doesn’t forecast price direction, it can serve as a useful reference point for assessing volatility and shaping short-term trading decisions. The examples below outline three common ways traders may use ATR in day trading to set expectations and interpret market movement more objectively.
1. Setting profit targets
Suppose a market breaks above its previous day’s high and remains above VWAP. You decide to enter a long trade based on your broader analysis. But where might a realistic profit target lie?
As a day trader, the goal is often to capture intraday movement and close before the session ends to avoid overnight exposure. Instead of relying solely on chart structure, you can use the current ATR reading to estimate a typical intraday range.
Remember, ATR is an average, not a prediction. It’s a guide to market rhythm, not a rule.
ATR based profit target
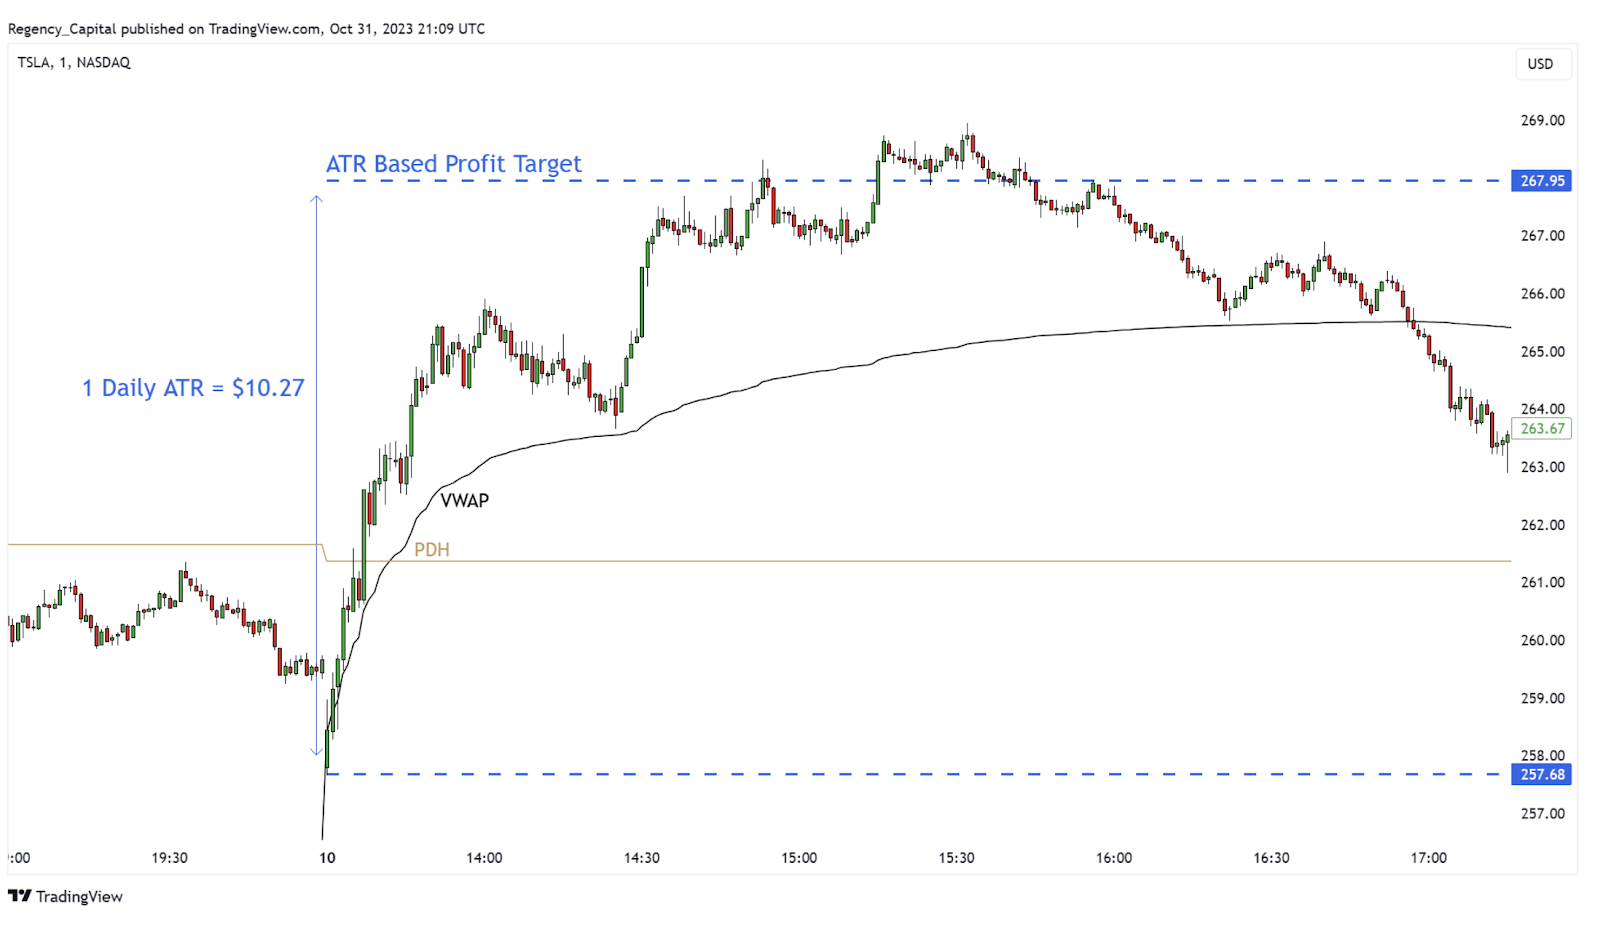
Past performance is not a reliable indicator of future results.
2. Stop placement
In swing trading, stops are often set using multiples of the ATR to avoid being triggered by short-term price noise. The same concept can be adapted for day trading, though on smaller scales.
Using a lower-timeframe ATR (for example, a 5-minute chart) helps position stops in line with current volatility. A stop that’s too tight may close a trade prematurely; too wide, and it may expose you to unnecessary risk.
As a starting point, some traders use a multiple of the ATR, such as 5–10×, depending on timeframe and volatility level. This provides a consistent, volatility-adjusted method rather than relying solely on chart structure.
For those who prefer to protect profits dynamically, an ATR-based trailing stop can adjust automatically as volatility shifts. TradingView and other platforms offer built-in tools under
ATR Trailing Stop Loss
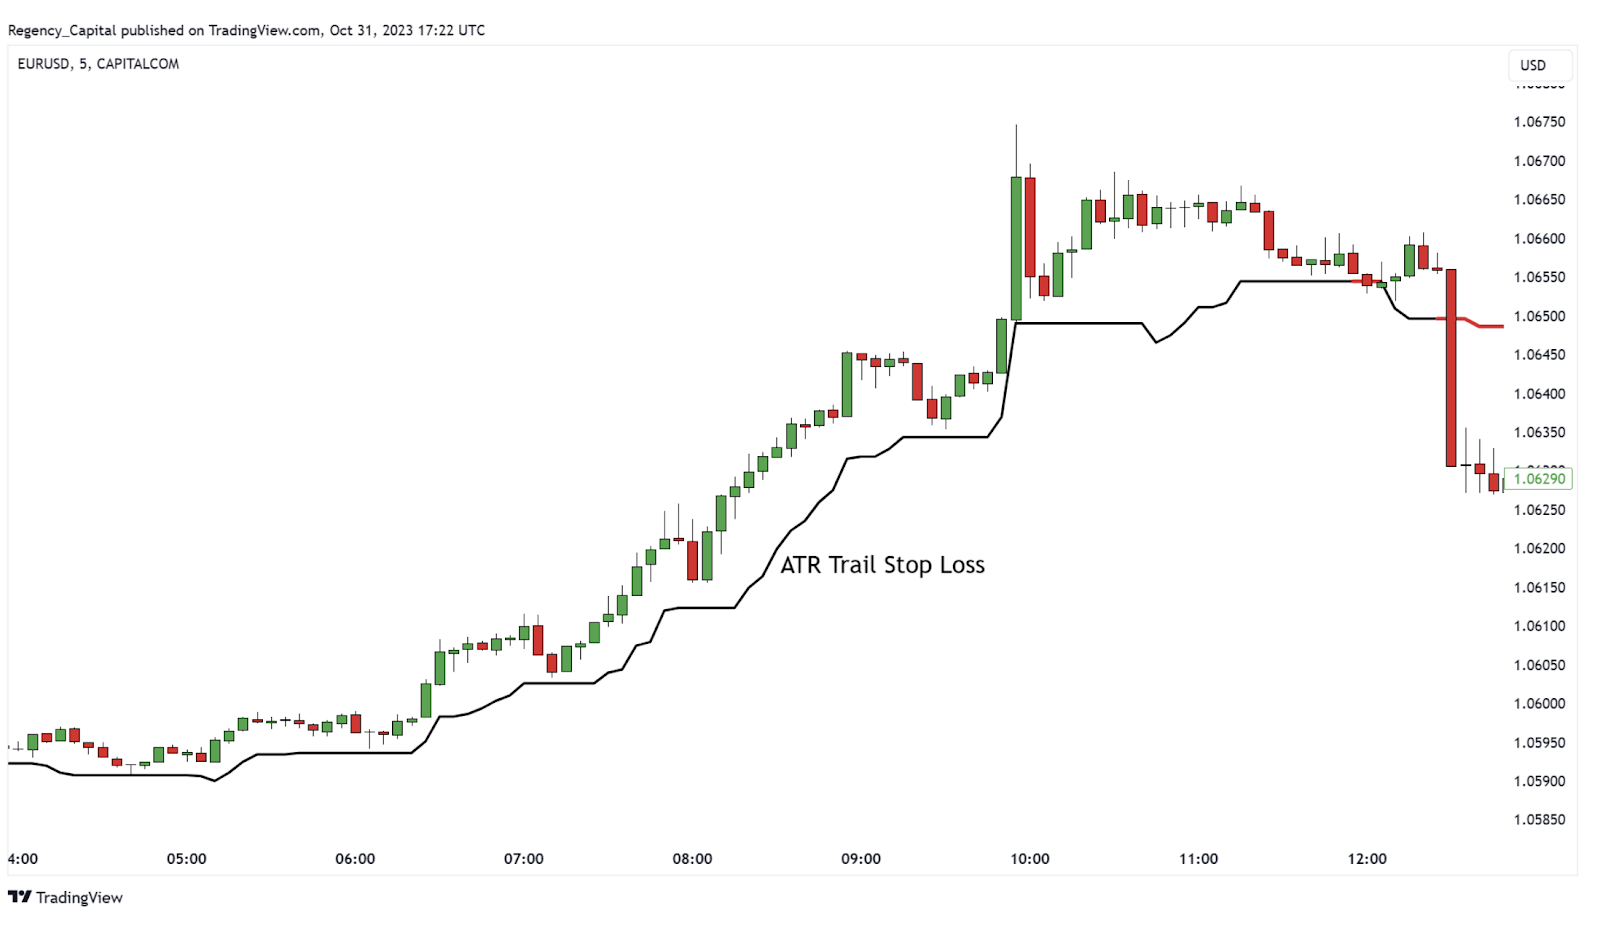
Past performance is not a reliable indicator of future results.
3. Measuring overextension
Just as ATR helps set realistic expectations for targets, it can also highlight when a market may be moving unusually far from its recent average.
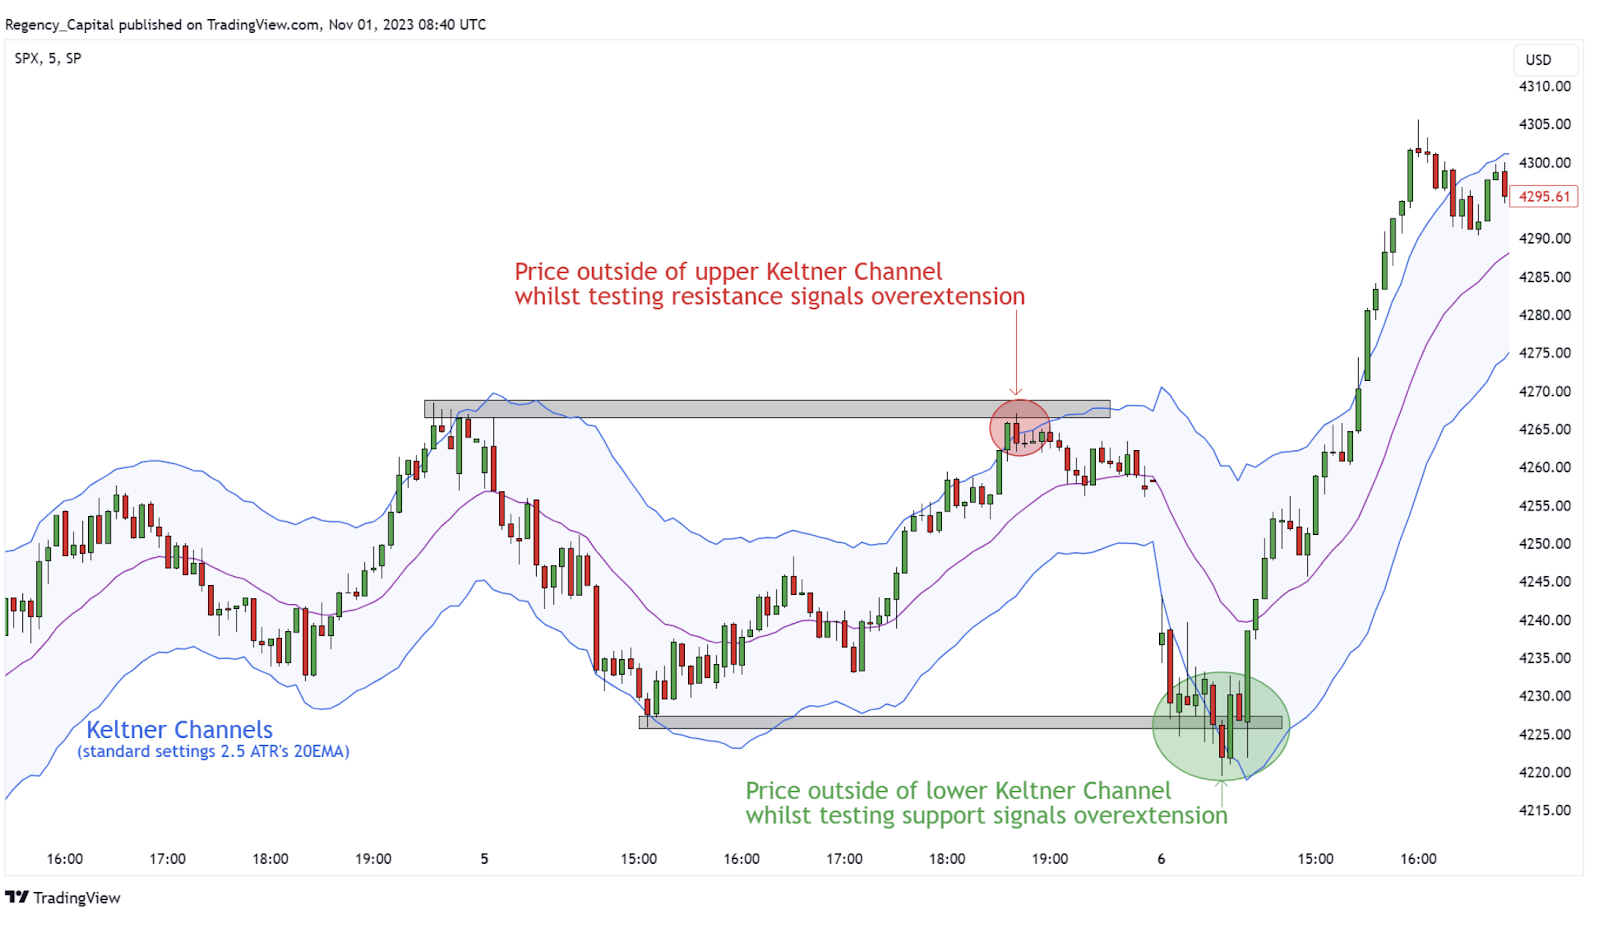
One method involves Keltner Channels, which plot an ATR-based envelope around an exponential moving average (EMA). When price moves beyond these boundaries, it may indicate that volatility has expanded relative to normal conditions.
The default Keltner Channel setting uses a 20-period EMA with bands at 2.5× ATR. Wider or narrower bands change how frequently potential overextension signals appear.
Combining ATR-based channels with support and resistance levels or other confirmation tools can provide a broader perspective on market activity, without implying a specific trading action.
Keltner Channels: S&P 500 5min Candle Chart
Past performance is not a reliable indicator of future results.
Key takeaways
ATR is a neutral, volatility-focused indicator that helps traders assess how active a market currently is. By incorporating it into your analysis, you can:
- Set more realistic profit expectations
- Position stops in line with current market conditions
- Identify when prices may be moving unusually far from their average range
ATR doesn’t forecast direction, but it can help you view market dynamics more objectively and manage trades with a clearer understanding of volatility.
Create an account Open a demo account
FAQ
What is the average true range (ATR) indicator?
The average true range (ATR) is a technical indicator that measures market volatility. It calculates the average difference between a period’s high and low prices, including any price gaps. ATR doesn’t indicate direction or trend strength – it simply shows how much an asset typically fluctuates over a set timeframe, helping traders understand current volatility levels.
How do traders use ATR in day trading?
Day traders often use ATR to set more informed price targets and adjust their stop-loss levels. Because ATR reflects a market’s average price movement over a chosen period, it helps traders gauge whether a move is unusually large or within typical volatility limits. This can make profit-taking and risk control more aligned with prevailing market conditions.
How can I trade CFDs using volatility indicators like ATR on Capital.com?
With Capital.com, you can trade CFDs on thousands of markets using a range of built-in technical indicators, including the average true range. The platform’s customisable charts, multiple timeframes, and TradingView integration make it straightforward to analyse volatility and apply risk-management tools. Remember, CFDs are traded on margin, and leverage amplifies both profits and losses.