Trade Copper Spot
Copper is a unique commodity that has a distinctive value in the global market due to its industrial worth. Today, it is the world’s third-most-used metal, after iron and aluminium, and plays a pivotal role in all major economies and the developing world. Trading copper offers substantial asset-class diversification, which can be an effective way to lower the overall volatility of a portfolio.
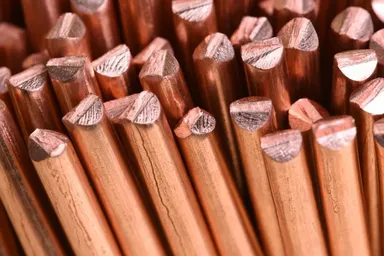
Copper is one of the most versatile metals available today. It has a high electrical conductivity, second only to silver, making it a very attractive material for various industrial applications, including wiring, plumbing, motors, generators, transformers, computers, cars, heating and cooling systems.
Due to its versatility and importance for many industries, the global demand for copper has been continuously growing over the past few decades. More than 60 per cent of overall copper consumption occurs in Asia. China, with its huge manufacturing sector, is by far the biggest consumer of the metal in the world.
With regard to supply, copper mining is mainly concentrated in Latin America. Chile is the world’s largest copper miner, producing more than 5.8 million tons of metal annually. The figure is more than double the amount of that of the second-highest producer, Peru, which supplies more than 2.4 million tons of copper per year.
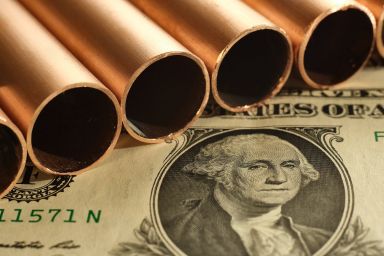
As the metal is a key material in the construction industry as well as for consumer goods such as electronics and cars, copper demand tends to be economically sensitive. As such, when the global economy slows down, the demand for the metal usually decreases, negatively weighing on its pricing. Therefore, when making investment decisions, it is important to consider that the price of copper significantly relies on the wider performance of the global economy.
Trade Copper Spot (Copper) CFDs
Copper Spot (ticker: Copper) is a commodity market instrument that reflects the price of a specific raw material or natural resource. On Capital.com, it can be traded as a contract for difference (CFD) which lets you speculate on price changes without taking ownership of the physical asset. This means you can go long or short depending on how you think the market will move.*
Many traders follow the Copper Spot price today to stay alert to short-term shifts in market sentiment.
*CFDs are traded on margin. Leverage amplifies both profits and losses.
Copper Spot price today
The instrument is quoted in $ and is currently trading around 6.28375.
Live price overview
Below is an overview of the current Copper Spot price and its recent trading ranges.
- Daily range: 6.25402 – 6.32502
- Daily movement: -0.031 (-0.4912%)
- Weekly range: 6.21803 – 6.46649
- Monthly range: 5.98269 – 6.60377
- Yearly range: 4.3746 – 6.73027
Why trade commodity CFDs on the price of Copper Spot with Capital.com?
Capital.com provides tools and features designed to support informed decision-making when analysing live market prices.
Advanced charting and analysis
Use interactive tools to study the Copper Spot price chart in detail.
- Access 100 technical indicators
- Choose from 12 chart types
- Analyse fast, interactive charting tools
Wide market offering
Join over 870,000 global traders and explore a wide range of markets:
- 4,500 stock CFDs
- 65 commodity CFDs
- 35 index CFDs
- 120 forex pairs
- 450 crypto CFDs
User-rated platforms
- TradingView rating: 4.6
- App Store rating: 4.7
- Google Play rating: 4.6
- Trustpilot score: 4.6
What influences the price of Copper Spot?
The Copper Spot (Copper) price may be influenced by several market factors, including:
- Supply and demand dynamics
- Global economic conditions
- Geopolitical events affecting production or transport
- Seasonal trends
- Market sentiment and risk appetite
- Currency fluctuations
These factors can interact in complex ways, contributing to both short-term movements and longer-term trends.
Copper Spot price forecasts
Copper Spot price forecasts commonly reference recent news, company updates, and broader economic factors rather than fixed price targets. You can use a combination of technical analysis and fundamental insights to form a view of potential future price movements. However, analyst forecasts are often inaccurate and past performance is not a reliable indicator of future results.
Instead of relying on a single outlook, some traders monitor ongoing analysis and real-time data to respond to changing market conditions.
How to trade Copper Spot commodity CFDs
With CFDs, you can trade without owning the underlying physical commodity:
- Go long (buy) if you expect prices to rise
- Go short (sell) if you expect prices to fall
Leverage allows increased exposure but also magnifies losses.
Risks of trading commodity CFDs
Key risks include:
- High market volatility
- Leverage amplifying both losses and gains
- Funding costs for holding positions overnight
- No ownership of the underlying commodity
Latest commodities articles