Silver price forecast: Third-party outlook
Silver plays a unique role in global markets, sitting at the intersection of industrial demand and speculative interest. Explore third-party XAG/USD forecasts and Capital.com analyst outlook.
The move comes amid ongoing interest in precious metals following the Federal Reserve’s 2025 shift from a ‘higher for longer’ stance to a rate-cutting cycle (Reuters, 2 January 2026). This shift has coincided with heightened volatility and broad gains across both gold and silver prices (KITCO, 6 January 2026). Silver is also drawing support from its dual role as an industrial and monetary metal, with commentary pointing to solid demand linked to solar and other industrial applications, alongside continued safe-haven interest (Reuters, 27 December 2025).
Silver price forecast 2026-2030: Analyst price target view
Analyst silver price predictions for 2026 span a wide range, reflecting differing assumptions around industrial demand, supply dynamics, and the broader precious-metals cycle. The forecasts below focus on published targets and averages from late 2025 to early 2026, with varying emphasis on macroeconomic policy, geopolitics, and longer-term structural demand.
World Bank (commodity outlook)
The World Bank’s commodity projections indicate that precious-metals prices, including silver, are expected on average to ease modestly from 2025 into 2026 after sharp gains. Silver, however, is still described as being supported by its industrial applications. Commentary summarised in a November 2025 precious-metals note adds that silver remains ‘driven by industry’, while flagging weaker global growth and policy uncertainty as potential constraints on further upside (GOLDINVEST, 3 November 2025).
Capital Economics (commodities outlook)
Capital Economics’ report, ‘Record-high metals prices to fall back in 2026’, states that record levels across several metals in 2025 are expected to give way to lower average prices in 2026, including for silver. The consultancy points to softer global activity, easing supply bottlenecks, and a partial normalisation in investor positioning following the 2025 surge as factors behind its more cautious outlook (Capital Economics, 15 December 2025).
Goldman Sachs (commodities research)
Goldman Sachs’ 2026 commodities outlook maintains a constructive view on precious metals and highlights silver as a potential beneficiary of what it describes as ‘power race and supply waves’, although no specific public silver price target is disclosed in the summary material. The bank references ongoing energy-transition demand, constrained mine supply, and a still-supportive real-rate environment as factors it expects to continue underpinning precious-metals prices into 2026 (Goldman Sachs, 18 December 2025).
Bank of America / UBS (investment bank updates)
Sector round-ups report that Bank of America lifted its 2026 silver price outlook to a peak around $65 per ounce, with an average near $56.25, citing structural market deficits and strong industrial offtake. Separate commentary from November 2025 attributes to UBS a mid-2026 silver projection around $55 per ounce, following upward revisions to earlier estimates amid references to ETF inflows and fiscal-balance concerns supporting investor demand (deVere Group, 14 October 2025).
Predictions and third-party forecasts are inherently uncertain, as they cannot fully account for unexpected market developments. Past performance is not a reliable indicator of future results.
Silver price: Technical overview
On the daily chart (6 January 2026), XAG/USD is trading well above its key moving-average cluster, with the 20-, 50-, 100- and 200-day SMAs around 68.7, 58.3, 51.2 and 43.1 respectively, while spot trades near 80.87 as of 5:24pm UTC on 6 January 2026. This preserves a 20-over-50 alignment and leaves price extended above the moving-average band. The 20-day EMA near 69.45 sits just above the 20-day SMA, acting as an additional dynamic reference point. The 14-day RSI is around 70.6, placing it in a stretched zone, while the ADX near 62 points to a strong established trend, provided price remains above the clustered averages.
On the upside, the nearest classic resistance sits at R1 around 84.84. A sustained daily close above this level would bring R2 near 98.08 into focus as the next reference area. On pullbacks, the classic pivot at 70.52 forms initial support, followed by the 100-day SMA around 51.22 as a key underlying moving-average shelf. A clear break below that area could open the way toward S1 near 57.28 (TradingView, 6 January 2026).
This technical analysis is for informational purposes only and does not constitute financial advice or a recommendation to buy or sell any instrument.
Silver price history
Silver’s spot price on Capital.com has shifted sharply over the past two years, moving from the high-$20s per ounce in early 2024 to above $80 by early January 2026. The metal spent much of 2024 trading within a relatively contained $25–$32 range, with brief moves toward the low-$30s in October before ending the year just under $29 on 31 December 2024.
Momentum built through 2025, with XAG/USD gradually rising from around $29 at the start of January to the mid-$30s by mid-year, before accelerating from late summer. Closes moved from roughly $40 at the start of September to above $70 by late December, finishing the year at $71.65 on 31 December 2025. Into 2026, that upward move extended further, with silver closing at $72.70 on 1 January and reaching $80.90 on 6 January 2026, marking a steep advance over the two-year period shown.
Past performance is not a reliable indicator of future results. Share prices are indicative and may differ from live market prices.
Capital.com analyst: Silver price outlook in 2026
Capital.com senior market analyst Kyle Rodda highlights that recent moves in silver have taken place against a backdrop of heightened volatility and relatively thin liquidity. Commenting on late-December price action, Rodda noted that ‘precious metal prices can swing in holiday-thin liquidity after hitting fresh record highs’, with silver briefly pushing to around $83 per ounce alongside record levels in gold.
According to Rodda, the broader precious-metals backdrop reflects several overlapping drivers. ‘Demand for precious metals remains influenced by multiple fundamental factors,’ he said, pointing to a more dovish US Federal Reserve stance, ongoing geopolitical tensions, and concerns around fiscal sustainability as elements supporting investor interest.
Silver’s relative performance has also been shaped by market-specific dynamics. Rodda explained that ‘silver’s outperformance comes with the additional influence of industrial demand and a growing supply deficit’, highlighting its use in electric vehicles, solar panels and emerging technologies. He added that supply remains constrained, as silver is largely produced as a by-product of other metals, describing it as having a ‘very inelastic supply’ profile.
From a technical perspective, Rodda cautioned that conditions appear stretched in some areas. He observed that ‘extremes in the gold-to-silver ratio imply that recent moves in silver could be approaching overstretched territory’, while also noting that, despite overbought readings, ‘momentum remains skewed to the upside’. As with all markets, price behaviour may remain sensitive to shifts in liquidity, macroeconomic developments and broader risk sentiment.
Past performance is not a reliable indicator of future results.
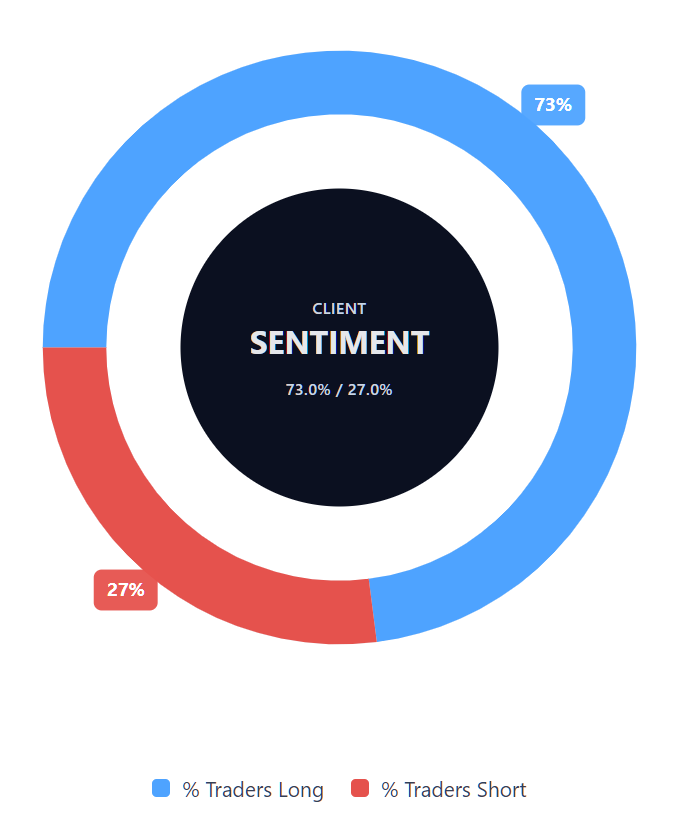
Capital.com’s client sentiment for silver CFDs
As of 6 January 2026, Capital.com client positioning in silver CFDs currently shows 73.0% buyers versus 27.0% sellers, a heavy‑buy skew that puts buyers ahead by about 46 percentage points. This one‑sided tilt toward longs highlights a strong bullish bias among current account holders, while still leaving room for shifts if market conditions or news flow change. This snapshot reflects open CFD positions on Capital.com and can change over time as clients add, reduce, or reverse trades.
Summary – silver price 2026
- Silver (XAG/USD) on Capital.com climbed from around $29 per ounce in early January to above $70 by late December 2025, marking a strong year of gains on this feed.
- The price advance accelerated from late summer 2025, with closes moving from roughly $40 at the start of September to over $80 in early January 2026, highlighting a steep late‑year upswing.
- Technical readings show spot trading well above its 20/50/100/200‑day moving‑average cluster, with a strong 20‑over‑50 alignment and a stretched 14‑day RSI around 70.6 alongside a high ADX near 62, indicating a powerful established trend during the period.
- Analyst forecasts for silver into 2025–2026 span from low‑$30s average projections in survey data to bank scenarios in the mid‑$50s–mid‑$60s range, with themes around industrial demand, monetary policy, and supply tightness but notable dispersion in views.
Past performance is not a reliable indicator of future results.
FAQ
What is the silver price forecast?
Silver price forecasts vary widely and depend on assumptions around industrial demand, supply conditions, and macroeconomic factors such as interest rates and currency trends. As outlined in recent third-party research, projections for 2025–2026 range from low-$30s annual averages in survey data to bank scenarios in the mid-$50s to mid-$60s per ounce. These differences reflect uncertainty around how quickly supply can respond to demand from sectors such as solar power and electrification, as well as how monetary policy and geopolitical developments evolve. It’s also important to note that forecasts are estimates rather than guarantees and may change as new data emerges or market conditions shift.
Could silver’s price go up or down?
Silver prices can move in either direction and are often more volatile than those of other precious metals. Its price is influenced by a combination of factors, including industrial demand, investment flows, interest-rate expectations, and broader risk sentiment. Periods of strong demand or supply constraints can coincide with sharp price increases, while changes in economic growth expectations, shifts in policy, or easing supply pressures may weigh on prices. Technical factors, such as momentum indicators and key support or resistance levels, can also influence shorter-term moves. As with all markets, unexpected events may lead to sudden price fluctuations.
Should I invest in silver?
Whether to gain exposure to silver depends on individual circumstances, objectives, and risk tolerance. Silver is often viewed as both an industrial metal and a store of value, meaning its price can respond to economic growth trends as well as shifts in investor sentiment. At the same time, silver prices can be volatile, and gains are not guaranteed. This information is not investment advice and does not take into account personal financial situations. Anyone considering exposure to silver should carefully assess the risks involved and consider seeking independent advice where appropriate.
How can I trade silver CFDs on Capital.com?
On Capital.com, you can trade silver CFDs, which allow you to speculate on price movements without owning the underlying metal. Contracts for difference (CFDs) let traders take positions on both rising and falling prices, but they are traded on margin, Leverage amplifies both profits and losses, so it’s important to understand how CFDs work before trading.