
Trade with a trusted global broker
Join a community of 740,000+ traders from around the world. Our customers love us so much, they’ve traded over $1tn in volume with us.
Authorised and regulated by the Securities Commission of The Bahamas (the SCB)
Join a community of 740,000+ traders from around the world. Our customers love us so much, they’ve traded over $1tn in volume with us.
Authorised and regulated by the Securities Commission of The Bahamas (the SCB)

I'm learning the basics of stock inv
Great customer service I got to say that. They helped get my account back very fast, after i logged myself out by losing my old email, it was so fast you wouldn’t believe it thank you once again.
Everything worked as expected from the 1 day. I didn’t have to search how to use the platform, it’s intuitive. The support chat was there when I had a tiny issue.
Capital.com has been great for both learning and trading. The app is clean, fast, and packed with useful tools. Customer support has been solid too. Definitely recommended for beginners and active traders alike.
I trade every day and Capital is my beloved home. I also create music and you can always feel when something has been created from the heart. Capital has soul!
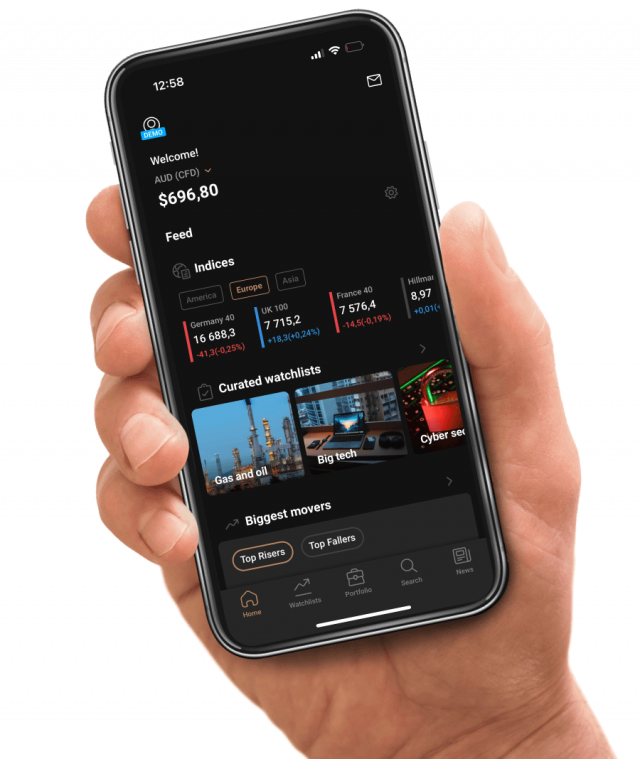
The app is built to make op
Deposits and withdrawals work with
I would like to express a huge thank you to Evgeniya Logvinovich, customer service manager. For your attention and heartfelt attitude to your clients.❤️
I am extremely happy with this broker. Great spreads, good selection of instruments, well coded toolbox.
Love the TV integration. Makes traders life smooth and comfortable.
I trade every day and Capital is my beloved home. I also create music and you can always feel when something has been created from the heart. Capital has soul!
I’d been paper trading for 2yrs now, went live and this platform is easy for beginners to understand and navigate all important tools to execute all that I learned. Earning now!
This application is perfect.. simple, easy to use, run smoothly and fast and it has an accurate graphics.. be careful to use only one credit card and one bank account to prevent any withdrawal problem.. overnight fees and spread variation will be repaid for you by the next month.. I used many application but this is the best one
User friendly app & interface and good support team. Funds transfer ease & Leverage is an advantage but crypto is highly risky be responsible of your loss limits and risks appetite.
Capital is really great to be used on start, also beginner friendly broker! Great costumer support and it is quick!
Showing our 4 & 5 star reviews. The specific details of the user have been intentionally anonymised to safeguard their privacy pursuant to GDPR requirements.
The ideal service, tools and resources to further advance your skills.
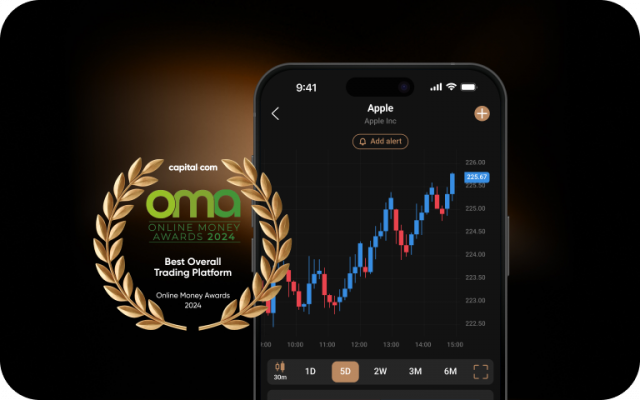
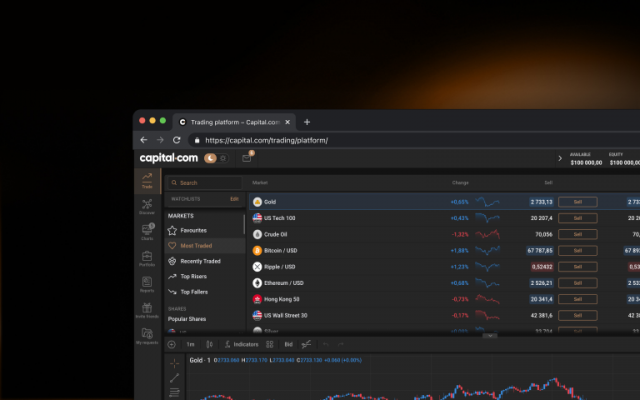
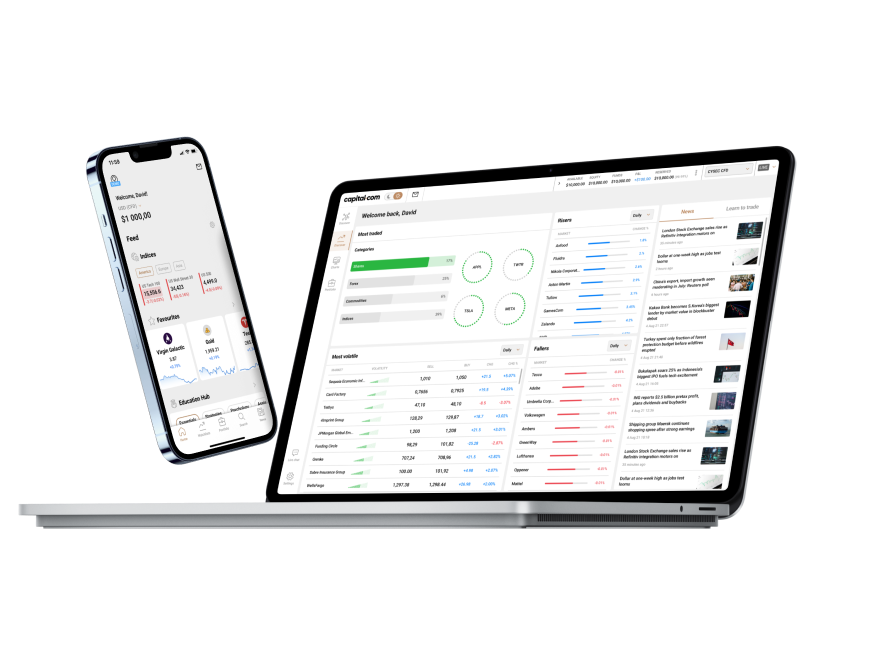
Sharpen your analysis with an array of intuitive charts, drawing tools and 100+ indicators.
Control larger positions with low margins on selected markets. Leverage magnifies both profits and losses. Limits may apply.
Our knowledgeable team is available 24/7 to assist you.
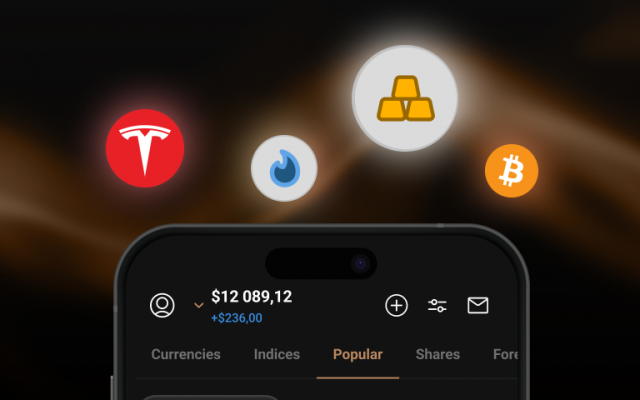
Monitor the price movements of your favourite assets and stay on top of your strategy.
99% of withdrawals are processed within 24 hours, according to our internal server data from 2024.
Start your trading journey with Capital.com.
Build your trading experience with ease, risk-free.
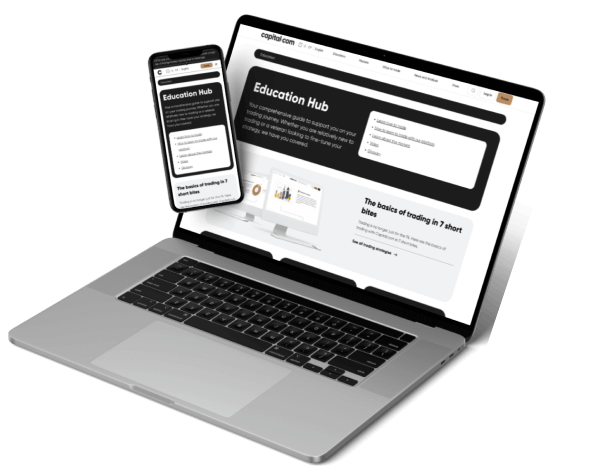
Learn key concepts via accessible courses, webinars, quizzes and videos.
Enjoy knowledgeable and friendly support, around the clock.
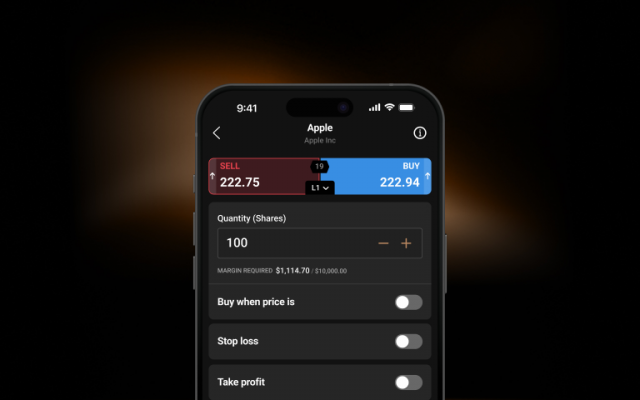
Stay comfortable with your exposure and trade using flexible sizings.
Use stop-losses1 to limit your downside when the market goes against you.
1Stop-losses may not be guaranteed