
Trade with a trusted global broker
Join a community of 720,000+ traders from around the world. Our customers love us so much, they’ve traded over $1tn in volume with us.
Authorised and regulated by the Securities Commission of The Bahamas (the SCB)
Join a community of 720,000+ traders from around the world. Our customers love us so much, they’ve traded over $1tn in volume with us.
Authorised and regulated by the Securities Commission of The Bahamas (the SCB)

Very trustworthy and affordable for any size trades
It is very easy to connect with TradingView but the web interface is also great.
Easy to use and great support. Been using it for 2 years already and still happy
Capital.com is one of the best stock trading platforms I’ve used. The UX and UI on both the mobile app and web platform are outstanding, making it incredibly easy to navigate. They’ve built a vibrant community of traders and investors, and their UAE team really stands out for delivering an exceptional trading experience.
Best broker!! they call you to see if you need any help. The app is good and nice better than the rest
Great app! I requested some features to be added, such as analysis tools, and they delivered. Amazing job! The agents are always helpful and reply quickly. It’s not 5 stars because, at times, some less experienced agents may say it’s impossible to fulfill the request or fix the problem while another agent, like Angel, quickly escalated the issue to the necessary team/person/department and resolved it
This is an excellent platform. The stop loss and take profit work very well; however, when the changes are very fast like at the beginning of the session, the stop loss does not work. If this defect is corrected it will be the perfect platform.
-Nice -Easy to use - Beautiful Interface
I think I'm new in this trading platform, but I find it affordable and most reliable. To be honest I'm not fully experienced trader, but with very limited knowledge of trading I try learn as much as I can by trying out different platforms see if can make money. My interests growing in you platform, l like news updates you also short videos on YouTube, other propaganda, poster and many more. I will see what happens in the coming months. Thanks capital team.
Gives you options to start learning how too do it as it gives you a demo option to learn from your mistakes
Efficiency. When creating the account, it was smooth, efficient from start to finish. Verification of documents also was done the same day, unlike other platforms where you have to wait a day or two.
From what I'm seeing it's cool Mixing it with trading view it's perfect... I didn't give it 5 star yet cos I still need to use it for some time
Showing our 4 & 5 star reviews. The specific details of the user have been intentionally anonymised to safeguard their privacy pursuant to GDPR requirements
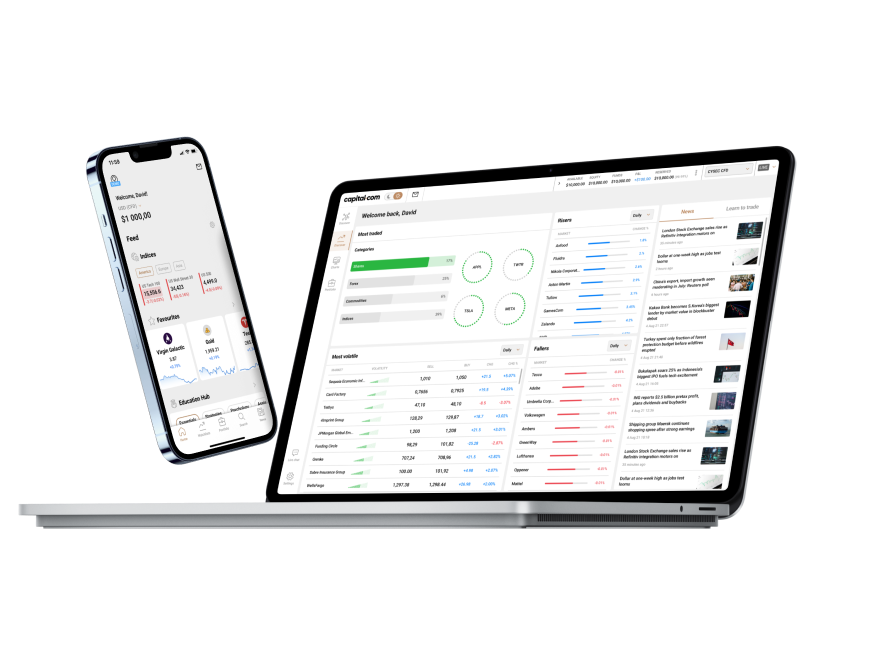
The ideal service, tools and resources to further advance your skills.
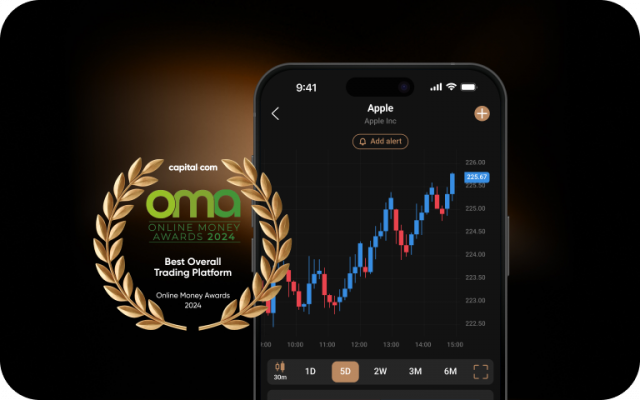
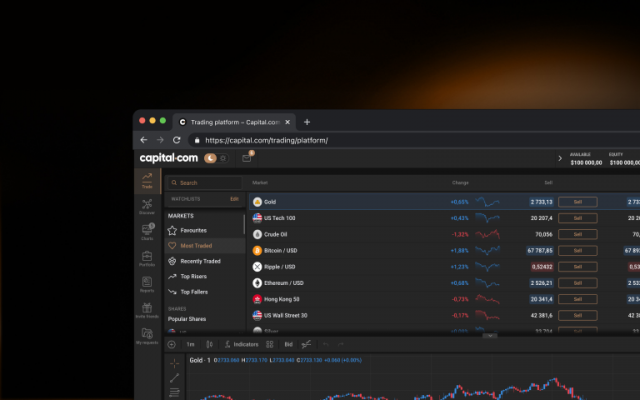
Sharpen your analysis with an array of intuitive charts, drawing tools and 100+ indicators.
Control larger positions with low margins on selected markets. Leverage magnifies both profits and losses. Limits may apply.
Our knowledgeable team is available 24/7 to assist you.
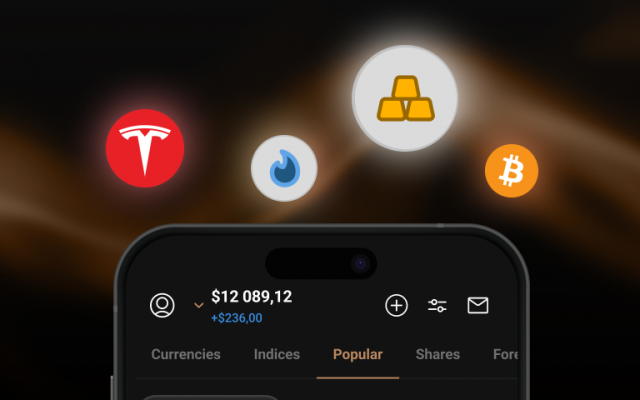
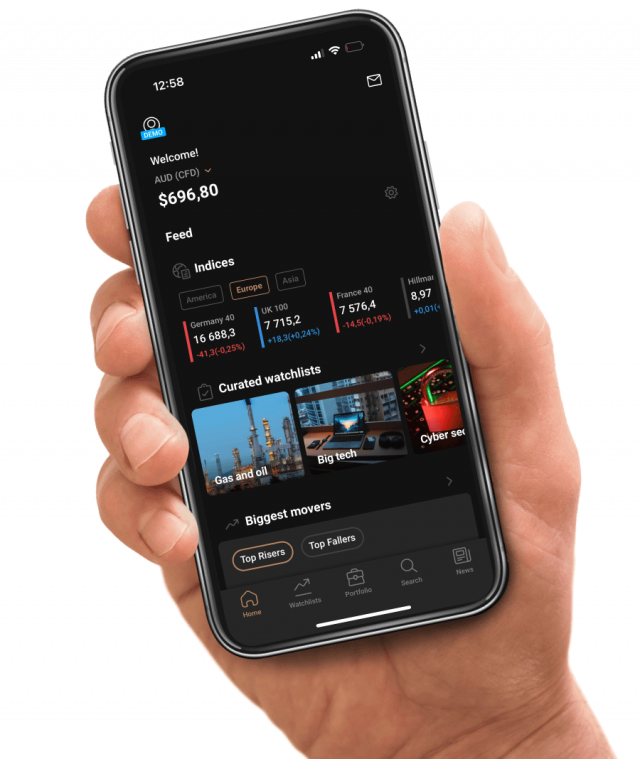
Monitor the price movements of your favourite assets and stay on top of your strategy.
99% of withdrawals are processed within 24 hours, according to our internal server data from 2024.
Start your trading journey with Capital.com.
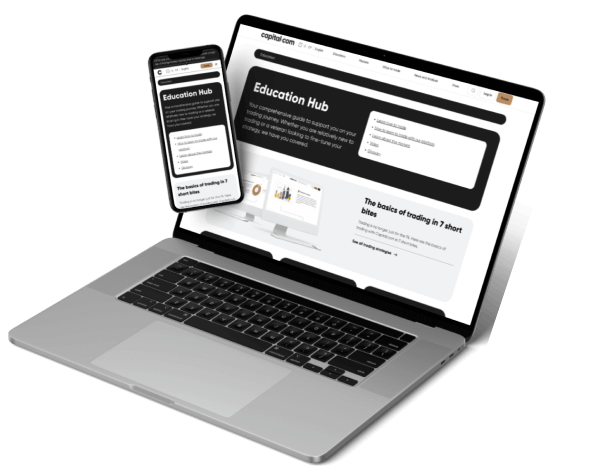
Build your trading experience with ease, risk-free.
Learn key concepts via accessible courses, webinars, quizzes and videos.
Enjoy knowledgeable and friendly support, around the clock.
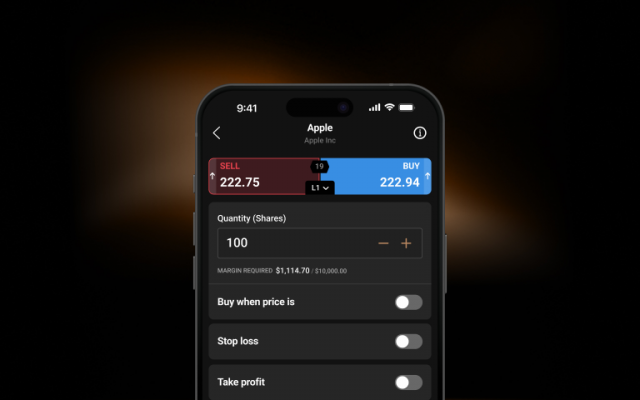
Stay comfortable with your exposure and trade using flexible sizings.
Use stop-losses1 to limit your downside when the market goes against you.
1Stop-losses may not be guaranteed