Price action trading: a comprehensive guide to strategies and patterns
Professional traders often talk about price action trading. They favour it because it focuses on market behaviour, using price movements and chart patterns to make decisions without relying on lagging indicators. That gives them a clear, real time and adaptable view of the markets. This comprehensive guide delves deep into the world of price action trading, exploring its core principles, benefits, limitations and popular strategies.
Remember, while chart patterns may give clues on potential price action to come, past performance is not a reliable indicator of future results.
Open a demo account to understand price action chart patterns and strengthen your trading strategy.
What is price action trading?
Price action trading is a method of analysing the markets based purely on the historical and current price movements of an asset, as displayed on a chart. Unlike traditional technical analysis, which relies heavily on indicators derived from price data (like moving averages, RSI or MACD), price action trading focuses instead on the ‘naked chart.’
The key principle behind this approach is that all relevant information about supply and demand, market psychology and future price moves is already reflected in the price itself. Every tick, candle, swing high and low tells a story. Price action traders believe that indicators often lag price action, sometimes creating false signals or unnecessary complexity. By focusing on the raw price, they aim to gain a real-time, unfiltered understanding of potential future direction.
The lag inherent in indicators means they reflect what has already happened, rather than predicting the future. This delay can lead to missed opportunities in terms of delayed market entries. Secondly, indicators can sometimes contradict each other, leading to confusion and analysis paralysis.
By removing indicators, price action traders simplify their charts, reduce clutter and train their eyes to spot recurring patterns and signals directly from the price bars.
Benefits and limitations of price action trading
Like any strategy, price action trading comes with its own set of pros and cons.
Benefits
- Clarity and simplicity: by stripping away indicators, charts can become clean and easy to read. This reduces cognitive overload and allows traders to focus on the most important information.
- Real-time market reading: price action is real-time. Every new candle or tick provides immediate information, allowing traders to react quickly to emerging opportunities.
- Universal application: the principles of supply and demand, human psychology and price patterns are universal. This means price action strategies can be applied to any asset class and any timeframe.
- Improved discipline: relying on clear price signals rather than subjective indicator readings can foster greater trading discipline and reduce emotional decision-making.
Limitations
- Subjectivity in pattern recognition: while patterns exist, their interpretation can sometimes be subjective. What one trader sees as a valid pin bar, another might dismiss. You need practice and experience to develop a consistent eye.
- Requires discipline and market context awareness: trading naked charts demands significant discipline to stick to the rules and avoid impulsive trades. However, understanding the broader market context (economic news, fundamental shifts) is still crucial, as price action doesn’t occur in a vacuum.
- Not always clear: sometimes, price action can be choppy or indecisive, making it difficult to identify clear signals. In such conditions, patience is key.
How to read price action
Reading price action chart patterns involves understanding the nuances of candlesticks, the structure of trends and the significance of key price levels.
Interpreting candlesticks
Each candlestick tells a story about price movement over a specific period. The body indicates the opening and closing prices, while the wicks (or shadows) show the high and low. A long body suggests strong buying or selling pressure, while short bodies indicate indecision. Long wicks can signify price rejection.
Structure of trends
In candlestick charts, uptrends are characterised by higher highs (HH) and higher lows (HL), indicating that buyers are pushing the price up. On the other hand, candlesticks making lower highs (LH) and lower lows (LL) indicate a downtrend, where sellers are in control, pushing prices down.
Ranging markets are represented by sideways price moves, without clear HH/HL or LH/LL, indicating a balance between buyers and sellers.
Support and resistance levels
Candlesticks can be used to see how the price is reacting to support and resistance levels, indicating potential reversals or continuations. Support is the price level where buying interest is strong enough to prevent the price from falling further, while resistance is the price level where selling interest is strong enough to prevent the price from rising further. These levels are dynamic and can be identified by looking for areas where the price has repeatedly reversed or consolidated.
Past performance is not a reliable indicator of future results.
Price rejection and volatility clues
Long wicks on candles often indicate price rejection. For example, a long lower wick on a bullish candle suggests that sellers tried to push the price down, but buyers quickly stepped in to push it back up. This can be a strong signal of support. Similarly, long upper wicks indicate resistance. The size of the candle bodies and wicks also provides cues on volatility, with larger candles meaning higher volatility.
Sequence of highs and lows
Beyond just identifying HH/HL or LH/LL, observing the sequence provides deeper insights. For instance, if an uptrend starts failing to make a new HH or if an HL is broken, it signals a potential trend reversal.
Common price action signals and patterns
Past performance is not a reliable indicator of future results.
Price action traders identify specific candlestick formations and chart patterns that signal potential market reversals or continuations. Here are some popular price action chart patterns:
Pin bar
A candlestick with a very small body and a long wick extending significantly in one direction, indicating a strong rejection of price at that level. A bullish pin bar has a long lower wick, suggesting rejection of lower prices, while a bearish pin bar has a long upper wick, suggesting rejection of higher prices.
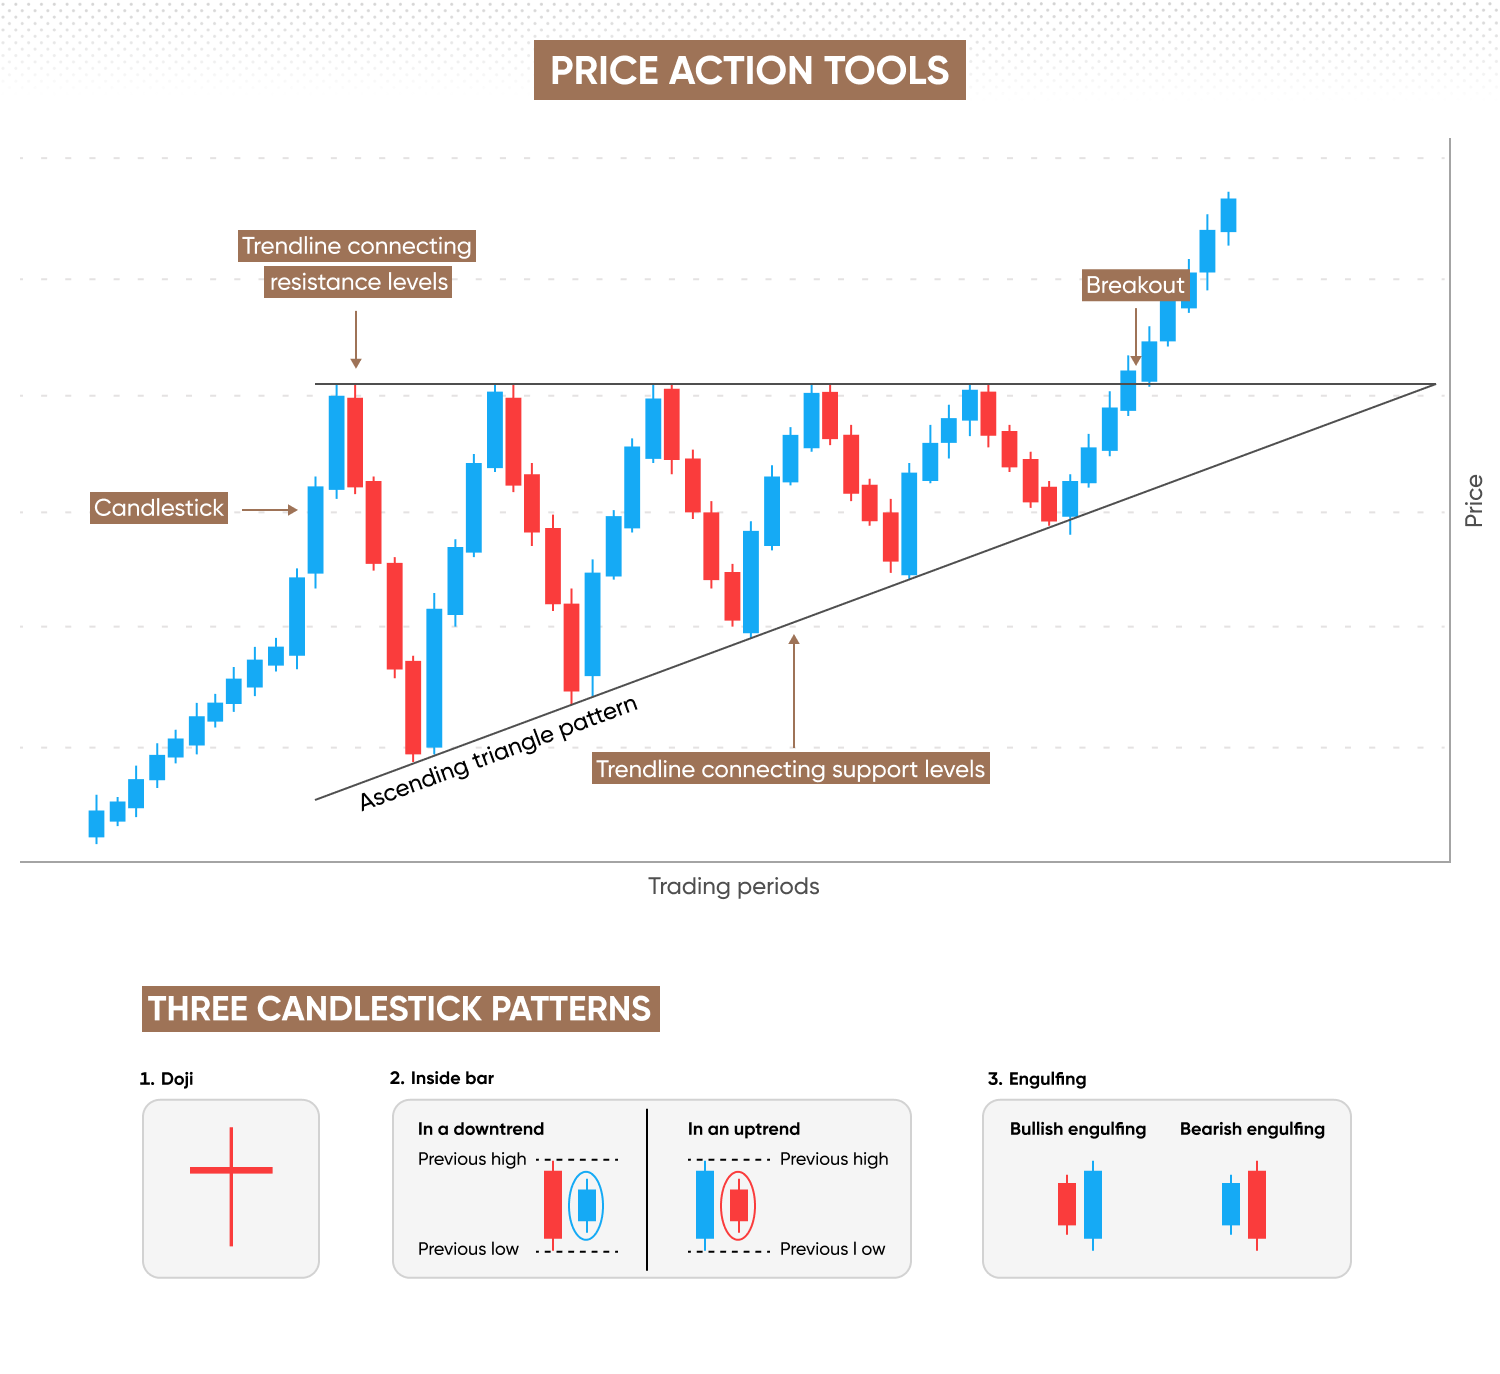
Inside bar
A candlestick that is completely contained within the range (high to low) of the previous candle indicates indecision or consolidation in the market, often preceding a breakout.
Engulfing patterns
A two-candle pattern where the second candle’s body completely engulfs the first candle’s body, indicating a strong shift in momentum. A bullish engulfing pattern occurs when a large bullish candle completely covers a smaller bearish candle, often at support, and vice versa for a bearish engulfing pattern.
Fakey (false breakout)
The price temporarily moves beyond a support or resistance level, but then quickly reverses and closes back within the previous range. This deceptive movement can trick traders into entering positions that are soon invalidated by the price reversal.
Head and shoulders
The head and shoulders is a classic reversal pattern, typically seen at the top of an uptrend, resembling a baseline with three peaks, the middle (head) being the highest, and the two outer peaks (shoulders) being roughly equal in height. A break below the ‘neckline’ (connecting the lows of the shoulders) confirms the pattern.
Double tops and bottoms
Reversal patterns indicating a failed attempt to break out of resistance (double top) or support (double bottom) twice.
Trendline breaks
When the price breaks decisively through an established trendline, it signals a potential change in the trend’s direction or a shift in momentum.
Learn more about reading candlestick patterns.
Top price action trading strategies
Price action strategies combine individual signals with market context to offer actionable trading insights.
Trend continuation strategy
This price action trading strategy focuses on entering trades in the direction of an established trend after a temporary pullback. For this:
- Identify a clear uptrend (HH, HL) or downtrend (LH, LL).
- Wait for the price to retrace to a key support (in an uptrend) or resistance (in a downtrend) level, often to a previous HL or LH.
- Look for a strong bullish (in uptrend) or bearish (in downtrend) price action signal to confirm the continuation.
- Enter after the confirmation candle closes.
- Place the Stop Loss (SL) just beyond the support/resistance level or the confirmation candle’s extreme.
- Take Profit (TP) can be placed at the next significant resistance/support level or a multiple of your risk (such as 1:2 risk-reward).
For example, consider a strong uptrend in which the price pulls back to a previous swing high (now acting as support). A large bullish engulfing candle forms at this level. You could enter a long position at the close of the engulfing candle, with the SL below that candle’s low and TP at the next major resistance.
Breakout entry strategy
Here, traders enter a trade when the price breaks out of a consolidation pattern or key support/resistance level.
- Identify a clear consolidation range or a strong support/resistance level.
- Wait for a strong, decisive candle to break and close beyond the boundary.
- Enter in the direction of the breakout after the breakout candle closes. Some traders wait for a retest of the broken level for a lower-risk entry.
- SL can be placed just inside the broken level or behind the breakout candle.
- TP can be a logical extension of the breakout or a measured move of the consolidation pattern.
For example, say the price consolidates in a tight range for several hours. A large bullish candle breaks above the resistance of this range and closes strongly. Traders can enter a long position at this point, with SL below the range’s resistance (now support) and TP at the measured height of the range projected upwards.
Retracement entry strategy
Like trend continuation, traders target entries on pullbacks to indicators like moving averages or Fibonacci retracements, confirmed by price action.
- Identify a trend.
- Wait for the price to retrace to a dynamic support/resistance (such as 21 EMA or 50% Fibonacci retracement).
- Look for a price action signal (like pin bar, inside bar breakout) confirming the end of the retracement and continuation of the trend.
- Enter after the confirmation signal.
- SL can be below the retracement low/high.
- TP can be at the previous swing high/low or a Fibonacci extension.
For example, the price retraces to the 21-period exponential moving average during a downtrend and a bearish pin bar forms at the EMA, rejecting higher prices. Traders can enter a short position, with SL above the pin bar’s high and TP at the previous swing low.
Rejection candle strategy
This price action trading strategy focuses on trading strong rejection candles (like pin bars) at significant support or resistance levels.
- Identify a strong support or resistance level.
- Wait for the price to test this level and form a clear pin bar or a similar rejection candle.
- Enter in the opposite direction of the wick’s rejection after the candle closes.
- SL can be placed just beyond the rejection candle’s wick.
- TP can be at the next significant support/resistance level.
For example, let’s suppose the price approaches a strong resistance level and forms a large bearish pin bar, indicating rejection of higher prices. A short position can be opened with SL above the pin bar’s high and TP at the next support.
Confluence zone strategy
This strategy involves identifying areas on the chart where multiple technical elements (support/resistance, trendline, moving average, etc.) converge, creating a ‘confluence zone.’
- Identify a zone where at least two or three significant technical levels align.
- Wait for price to interact with this zone and produce a strong price action signal.
- Enter after the confirmation signal from the confluence zone.
- SL can be placed just beyond the confluence zone.
- TP can be at the next major opposing level.
For example, say the price pulls back to a level where a horizontal support, a rising trendline and the 50% Fibonacci retracement level all meet in an uptrend. A bullish pin bar forms at this confluence zone. Traders can enter a long position, with SL below the pin bar’s low and the confluence zone, and TP at the previous swing high.
Multi-timeframe price action strategy
This involves analysing price action across multiple timeframes to gain a broader perspective and confirm signals.
- Start with a higher timeframe (daily or 4-hour) to identify the dominant trend and key support/resistance levels.
- Drop to a lower timeframe (1-hour or 15-minute) to look for specific price action entry signals that align with the higher timeframe’s direction and levels.
- Enter on the lower timeframe signal, with the higher timeframe trend as confirmation.
- SL and TP can be set based on the lower timeframe’s immediate structure, but with consideration for the higher timeframe’s potential move.
For example, suppose you identify a strong uptrend on the daily chart. On the 4-hour chart, the price pulls back to a daily support level. On the 1-hour chart, a bullish engulfing pattern forms at this support. You could enter long on the 1-hour signal, with SL based on the 1-hour structure, aiming for a move consistent with the daily trend.
Learn more about different trading strategies before entering live markets.
Advanced price action techniques
Advanced price action traders employ nuanced techniques to refine their entries and manage trades.
Trading price action near key levels
The most powerful price action signals occur at significant levels, such as support or resistance. Advanced traders don’t just look for a signal, but for how the price interacts with these levels. Is there a strong rejection? A weak bounce? A false break? Understanding the context of the level increases the signal’s reliability.
Trapping setups and how to avoid them
False breakouts are common. Advanced traders learn to identify these fakes and avoid them by waiting for clear confirmation of a breakout, such as a strong close outside the level or a retest and bounce.
Using price action in range-bound markets
Learning how to trade with price action in ranging markets requires looking for rejection candles at the boundaries of the range (support and resistance) to open a short position at resistance or a long at support.
Price action vs indicators vs technical analysis
The debate between pure price action and indicator-based trading is ongoing. Price action traders avoid indicators since they believe that indicators lag price. Indicators are derived from price and volume, meaning they can only reflect what has already occurred. This delay can cause late entries or missed opportunities.
However, you can combine price action with indicators to confirm signals or filter out false signals, rather than determining the entry level. For instance, the relative strength index (RSI) can be used to identify overbought/oversold conditions in conjunction with a price action signal at a key level. Moving averages (MA) can act as dynamic support/resistance. A price action signal forming at an MA can be a strong entry point. Plus, moving average convergence divergence (MACD) can be used to confirm momentum or divergence, but the entry would still be triggered by a price action signal.
Entry and exit tactics with price action
Precise entry and exit points are critical and price action provides clear guidelines for both.
Past performance is not a reliable indicator of future results.
Entry after confirmation vs anticipation
Placing the entry only after confirmation is the safer approach. Wait for the price action signal candle to fully close and then enter on the open of the next candle. Anticipating future price action to determine entry means opening the position before the signal candle closes or with a smaller confirmation timeframe. While you might get a better entry price if the prediction pans out, it carries the risk of the signal failing before the candle closes.
Risk-reward ratio
Experienced traders prefer to define their risk-reward ratio before entering a trade. A common minimum is 1:2, meaning you aim to make at least twice as much as you risk. Price action helps define clear SL and TP levels, making this calculation straightforward.
Setting SL and TP using structure
Place the stop loss at a logical structural point that invalidates the trade idea. For a long trade, this is typically just below the recent swing low or below the support level. For a short trade, it is just above the recent swing high or above the resistance level. For pattern-based entries, it is often just beyond the pattern’s extreme, such as below a pin bar’s tail.
The take profit level is set at the next significant opposing structural level (resistance for a long trade, support for a short trade). Alternatively, you could use a fixed risk-reward multiple.
Using multiple timeframes for optimal entries
As mentioned above, a higher timeframe provides the overall direction and key levels, while a lower timeframe allows for precise, lower-risk entries when price action confirms the higher timeframe’s signal at those key levels.
Best timeframes and markets for price action trading
The beauty of price action is its adaptability. Price action is popularly used for forex trading due to the higher liquidity and clear trends of this market. Cryptocurrencies, while more volatile, also exhibit clear price action patterns. Price action strategies can also be used for stock, index and commodities trading.
Plus, it can be used for very short timeframes, such as those in scalping, to identify quick entry and exit points, often around support/resistance or micro-trends. For longer timeframes, such as day trading, you could focus on intraday trends and patterns, aiming to close all trades by the end of the trading day. Swing traders focus on capturing larger swings in price over days or weeks, using 4-hour, daily or weekly price action chart patterns.
However, you will need to adapt your price action trading strategy to different market conditions. For instance, in trending markets, focus on trend continuation and breakout strategies while focusing on trading reversals at range boundaries in range-bound markets. In volatile markets, prioritise strong rejection signals at key levels. Understanding the current market conditions is the key to choosing the best price action strategy.
Creating your own price action trading system
Developing a robust trading system is crucial for long-term success. This is why it is important to thoroughly backtest your chosen strategy on historical data before risking real capital. Look for a sufficient number of trades to get statistically significant results.
Maintaining a detailed trading journal can help strengthen your price action trading strategy. Record every trade in the journal, including the setup, entry/exit, SL/TP, rationale, emotions and outcome. Regularly review your journal to identify recurring patterns. Doing so can help you improve your strategy and keep emotions at bay.
Finally, based on your backtesting and journaling, create a clear, unambiguous set of rules for your trading system, such as:
- What market conditions to trade (e.g., trending, ranging).
- Which price action patterns to look for.
- Precise entry criteria.
- Strict stop-loss placement rules.
- Clear take-profit objectives.
- Position sizing.
Learn more about risk management to bolster your strategy.
Real market examples of price action trades
Forex example (EUR/USD - 4-hour chart - trend continuation):
- Market Context: EUR/USD is in a clear uptrend with higher highs and higher lows.
- Signal: price pulls back to a previous resistance level (now acting as support). A large bullish pin bar forms, rejecting lower prices at this support.
- Entry: enter long on the open of the candle following the pin bar.
- SL: placed just below the tail of the pin bar.
- TP: set at the previous swing high.
- Result: price rallies, hitting TP.
BTC/USD example (daily chart - double bottom reversal):
- Market Context: USD/BTC has been in a downtrend and has found support twice around $98,000.
- Signal: after the second test of $98,000, a strong bullish engulfing pattern forms, confirming the double bottom.
- Entry: enter long on the open of the candle following the engulfing pattern.
- SL: Placed just below the low of the double bottom, at $97,500.
- TP: set at the neckline of the double bottom (the high between the two lows) around $1,02,000.
- Result: price rallies to the neckline, confirming the reversal.
S&P 500 example (1-Hour chart - failed trade/lessons learned):
- Market Context: US500 is ranging between 6500 and 6550.
- Signal: price forms a small bearish pin bar at the 6550 resistance.
- Entry: enter short on the open of the next candle, anticipating a move back to support.
- SL: placed just above the pin bar’s high.
- TP: placed at the last swing high
- Result: instead of falling, price pushes slightly higher, hitting the SL.
- Lessons: The pin bar was small, indicating weak rejection. The overall range was tight, suggesting indecision. In retrospect, waiting for a stronger signal or a breakout from the range would have been better. This highlights the importance of context and not trading every signal.
Past performance isn’t a reliable indicator of future results.
Learning how to trade with price action can broaden your trading skills. However, make sure you practice and backtest on a demo account before risking real money. Once you gain confidence in your trading strategy, create an account to trade the live CFD markets.