What is technical analysis and how does it work?

Discover the key principles of technical analysis, including candlestick patterns, chart formations, and essential technical indicators. Learn how to interpret market trends and make informed trading decisions.
What is technical analysis?
Technical analysis in CFD trading is the study of historical price movements, trading volume, and chart patterns to try and predict future market trends. Instead of focusing on macroeconomic (also known as fundamental) factors, technical analysis relies on indicators and previous price patterns to help you make informed decisions.
But why do historical patterns matter? The idea is that market behaviour tends to be repetitive because traders often react to price movements in similar ways over time. Patterns like trends, support and resistance levels, and candlestick formations emerge repeatedly, giving traders signals about potential future price movements. By recognising these patterns, you can aim to improve your decisionmaking and identify high-probability opportunities.
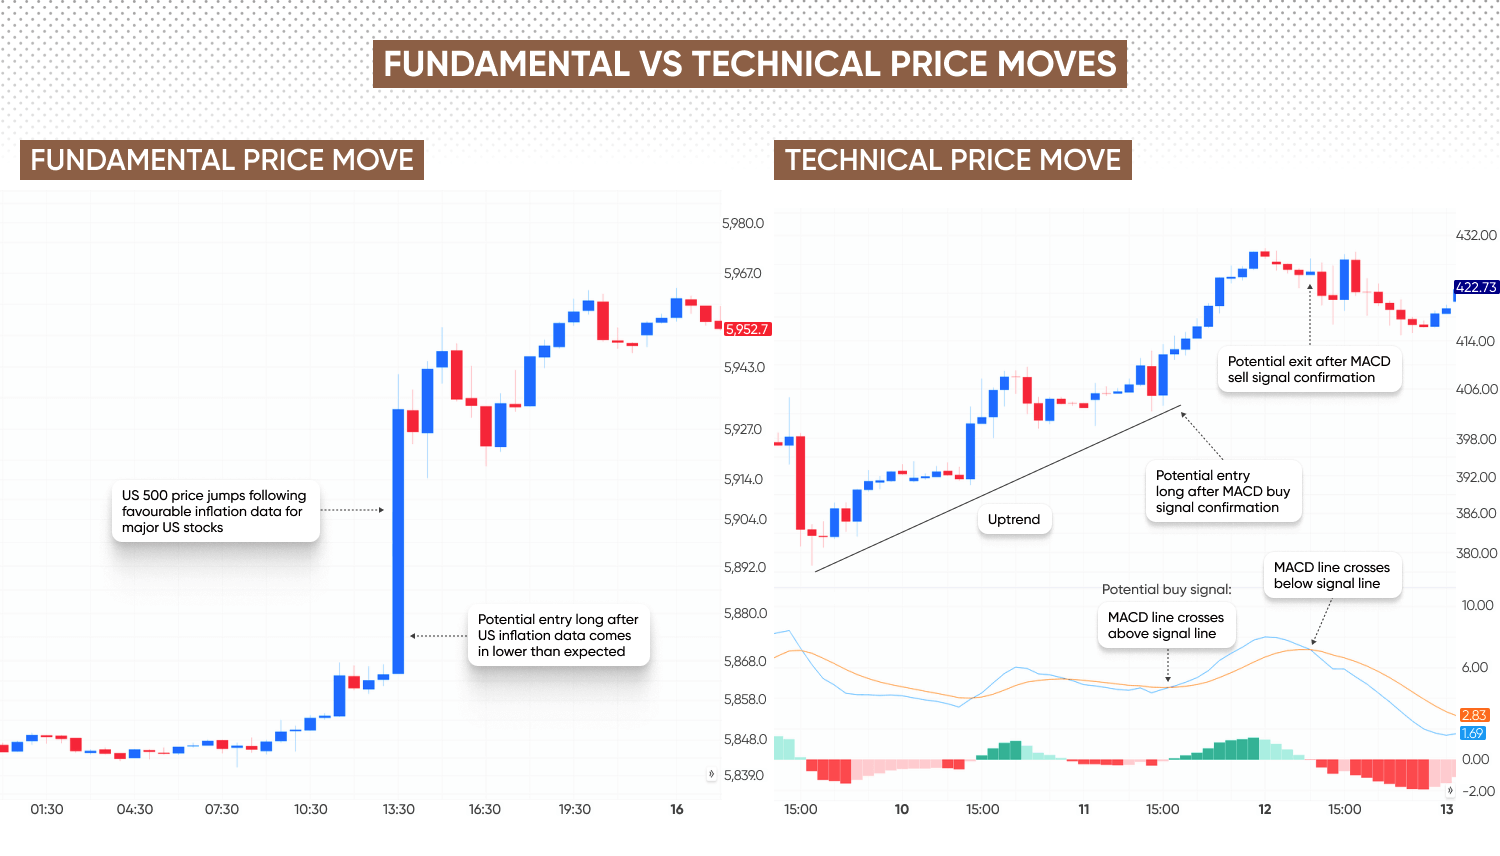
Fundamental drivers
Of course, some price movements are driven by major market events. An example might be a Federal Reserve interest-rate decision, which could have implications for the US dollar, particularly across major forex pairs like GBP/USD and USD/JPY, or key indices such as the US 500.
But in quieter market conditions, when macroeconomic events take a back seat, traders often turn to historical data for insights – analysing past price action to spot trends that could be relevant to future moves.
We have a wide range of resources to help you better navigate the technical side of trading. Find out more with our technical analysis section.
Past performance is not a reliable indicator of future results.
Why do traders use technical analysis?
Traders use technical analysis when they believe past price movements and chart patterns can provide insight into future market direction. If no significant economic data releases, earnings reports, or central bank decisions are expected, you might instead refer to historical price action, support and resistance levels, and technical indicators to identify potential opportunities.
For example, if a stock or currency pair has been trading within a clear price range, you may choose to look for signs of an imminent breakout, or in other words, a new trend. If the price approaches support or resistance with increasing momentum, forming a bullish candlestick pattern, or shows a key moving average crossover, you may anticipate a move higher. In this case, technical analysis might help you make decisions based on price action alone, without needing a fundamental trigger.
By analysing trends, momentum, and historical patterns, technical traders seek to identify setups that align with their strategies, regardless of broader economic conditions. However, it’s important to remember that technical analysis has its limitations, as price patterns and indicators are not always reliable predictors of future movements. Market conditions, sudden news events, and shifts in investor sentiment can all disrupt expected trends, making comprehensive risk management essential.
How does technical analysis work?
Technical analysis works by studying historical price data to identify trends, patterns, and key levels that might indicate future price movements. You can use charts, indicators, and price action analysis to make informed decisions based on market behaviour, rather than economic data or company fundamentals.
At its core, technical analysis is built on three key principles:
1. Price moves in trends: markets don’t move randomly. There are uptrends (higher highs and higher lows), downtrends (lower highs and lower lows), or sideways trends (range-bound movement). Recognising a trend can help you align your strategies with market momentum rather than fighting against it. Learn more about trends.
2. History often repeats itself: patterns seen in the past often reappear because market behaviour is influenced by human psychology. Look for repeating formations, such as head and shoulders, double tops/bottoms, or candlestick patterns, to anticipate potential price movements.
3. Support and resistance levels matter: certain price levels act as psychological barriers where buying or selling pressure increases.
Technical analysis in action
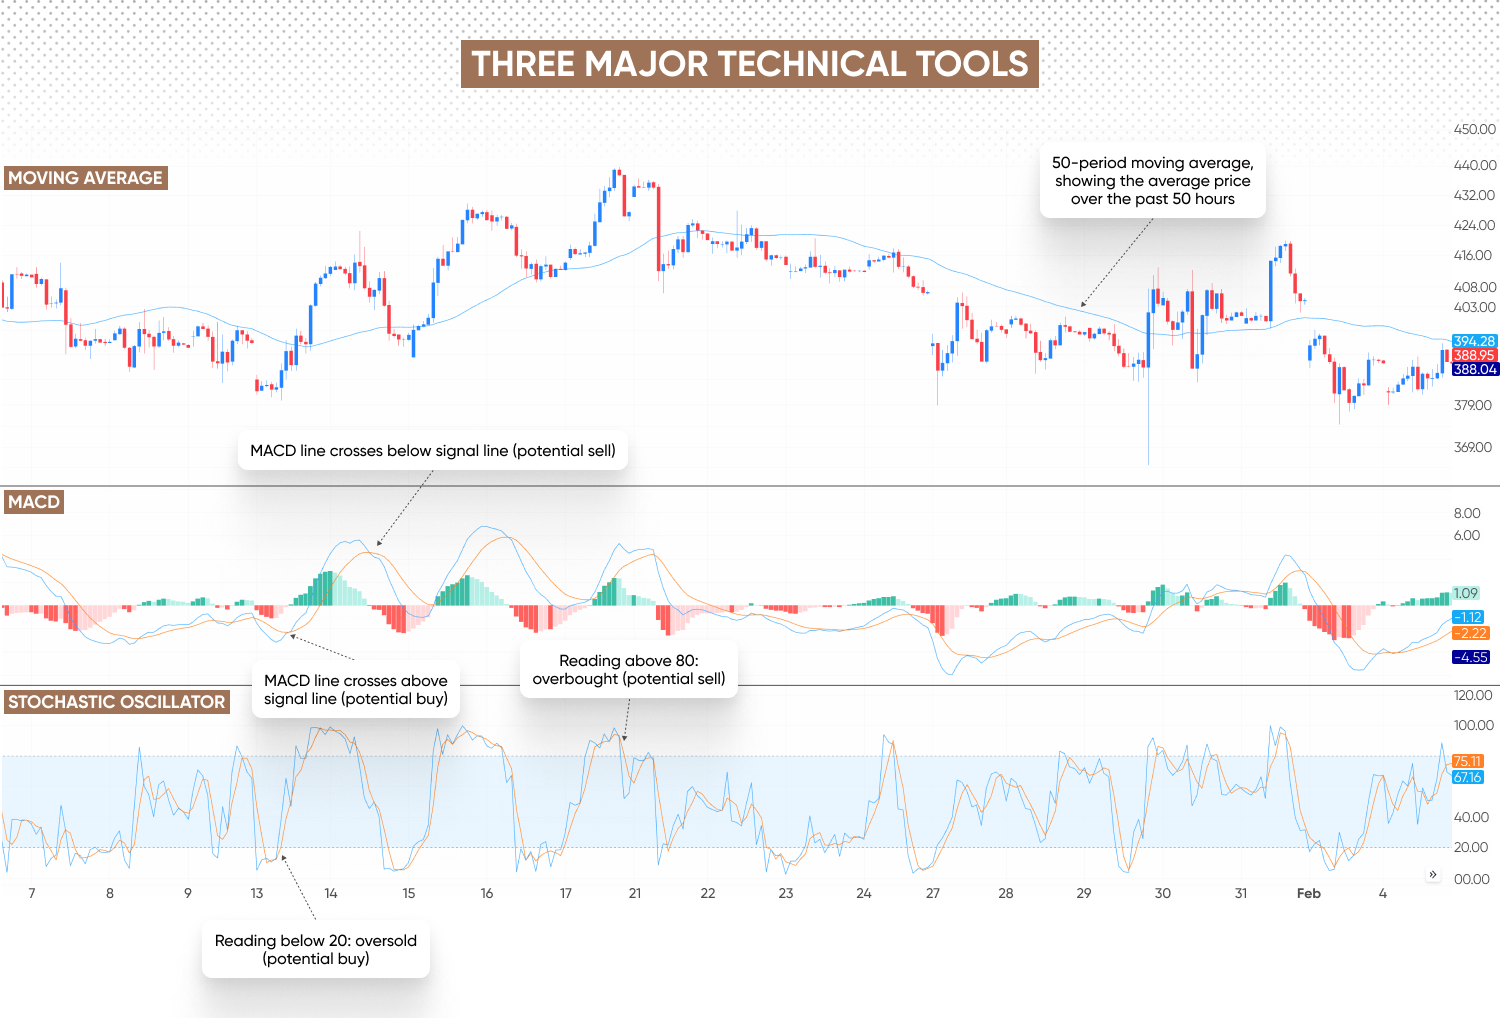
By combining trend analysis, historical patterns, and support/resistance levels, you can predict where the market is headed. This often involves technical indicators (like moving averages, RSI, and MACD) to confirm signals before making a trade.
While technical analysis doesn’t guarantee success, it can help you stack the odds in your favour by focusing on probabilities rather than predictions.
Technical analysis tools
Technical indicators and tools help traders analyse price trends, momentum, and potential reversals. While there are many available, here are some of the most widely used:
- Moving averages (MA) smooth out price fluctuations to help traders.
How you can use it: if the price is above the moving average, it signals an uptrend; if below, a downtrend. The Golden Cross (short-term MA crossing above long-term MA) suggests bullish momentum, while the Death Cross (short-term MA crossing below long-term MA) signals bearish momentum. - Relative strength index (RSI): a momentum indicator that measures the speed and change of price movements on a scale from 0 to 100. When it moves above 70, the market may be overbought (a potential sell signal). Moving below 30, it may be oversold (a potential buy signal).
How you can use it: RSI helps spot potential reversals or confirm trend strength. - Moving average convergence divergence (MACD): a trend-following momentum indicator that consists of two lines: MACD line (difference between two moving averages), and signal line (a moving average of the MACD line), as well as a histogram, which visualises the difference between them.
How traders use it: when the MACD line crosses above the signal line, it suggests bullish momentum. When the MACD line crosses below the signal line, it signals bearish momentum. - Bollinger Bands®: a volatility indicator with three lines – middle band (a moving average), and upper and lower bands – plotted above and below the middle band based on price volatility.
How you can use it: when the price touches the upper band, the asset may be overbought. When the price touches the lower band, the asset may be oversold. The ‘squeeze’ effect (bands contracting) suggests low volatility and a potential breakout. - Fibonacci retracement: a tool based on key Fibonacci ratios (23.6%, 38.2%, 50%, 61.8%) used to identify potential support and resistance levels.
How you can use it: traders look for price pullbacks to these levels as potential entry points in the direction of the main trend.
How to use these tools together
Traders often don’t rely on just one indicator – you might want to combine multiple tools for confirmation. For example:
- Identifying a trend with moving averages, or even a simple trendline
- Confirming momentum with RSI or MACD
- Spotting entry/exit levels with Bollinger Bands® or Fibonacci retracements
- By using these tools strategically, you can improve your ability to analyse price action and make informed decisions.
Below, you’ll get a feel for how three key tools can be applied to your price chart. Notice how the buy signal on the MACD indicator corresponds to an oversold signal on the Stochastic indicator, meaning you might choose to go long.
Past performance is not a reliable indicator of future results.
Getting started with technical analysis
- 1. Choose a platformCapital.com’s platform combines user-friendly navigation with intuitive tools. Find out more about the ways to trade with us.
- 2. Learn key indicatorsFocus on fundamental tools like moving averages, MACD, and the stochastic oscillator to understand trends, momentum, and potential entry points.
- 3. Practice in real market conditionsUse our demo account to test strategies and refine your approach without financial risk.
- 4. Define your approachDevelop a structured plan that includes entry and exit criteria, risk management rules, and a clear decision-making process.
- 5. Review and adaptMarkets evolve, and so should your strategy. Analyze past trades, adjust based on experience, and stay informed about new techniques.
Technical analysis is a valuable tool, but no method is foolproof. A disciplined approach and ongoing learning will help you apply it effectively in different market conditions.
FAQs
What’s the difference between fundamental and technical analysis?
Fundamental analysis evaluates assets based on economic data, company earnings, interest rates, and news to determine intrinsic value. Technical analysis, on the other hand, focuses on price movements, chart patterns, and indicators to identify trends and trading opportunities.
How can I learn technical analysis?
When learning technical analysis, start with the basics: learn about support and resistance levels, trendlines, moving averages, and indicators like RSI and MACD. Study historical charts to recognise patterns and price movements. Use demo accounts to practice strategies without risk, and follow experienced traders or educational content to deepen your understanding. Consistent practice and reviewing past trades will help refine your skills.
What is technical analysis in simple terms?
Technical analysis is a way of predicting future price movements based on past market data. Instead of looking at company earnings or economic reports, it relies on charts, patterns, and indicators to identify trends and potential trade setups. The idea is that history often repeats itself, and traders use this concept to make informed decisions.
Does technical analysis really work in trading?
Technical analysis can be effective for identifying trends, entry and exit points, and managing risk, but it's not foolproof. Market conditions, news events, and trader psychology can impact outcomes. Many traders combine technical analysis with risk management and fundamental insights to improve decisionmaking. Success depends on strategy, discipline, and adapting to market changes.
What is forex technical analysis?
Forex technical analysis is the study of price charts, trends, and indicators to forecast currency pair movements. Traders use tools like moving averages, Fibonacci retracements, and candlestick patterns to find potential entry and exit points. Since forex markets are highly liquid and react quickly to global events, technical analysis is widely used by short-term and day traders.