Pulse: Q4 2022 retail investor trading trends
Analysis of Q4, 2022 trading data from Capital.com.
In a year of turmoil, retail investors have once again shown they are prepared to adapt their trading strategies in the light of disruptive market events – whether that is in response to the impact of central bank interest-rate meetings on trading the GBP/USD currency pair, Russia’s invasion of Ukraine on oil and natural gas prices, or the fallout sparked by the collapse of Sam Bankman-Fried’s cryptocurrency exchange FTX.
Throughout all of this, digital platforms such as Capital.com, have played an important role in helping level up the access to the financial markets so that people can act on their own insights and analysis, and trade more easily.
What have retail investors chosen to do with their capital in the fourth quarter of 2022? An answer to that can be found in the exclusive data contained in Capital.com’s sector-leading trading platform – which has been ranked among the top five brokers in the UK and globally, by online broker comparison site BrokerChooser. Analysts, financial professionals and journalists can once again obtain a valuable glimpse into the trends exhibited by our global community of retail investors, thanks to our latest Capital Pulse quarterly report.
The main themes that have emerged from the data during the fourth quarter have been the increased adoption of short trading positions among our traders (up from 26% in 2021 to 37% in 2022) and the continued resurgence of stop-loss orders, which reached a new platform record of 12.9% of Q4 transactions.
In addition, our traders also demonstrated their resilience when it came to modifying positions during moments of elevated volatility, as was seen during GBP/USD trades in response to the tax-cutting mini-budget proposed by the former UK chancellor Kwasi Kwarteng.
For more information about Capital.com and our global community of traders, visit our website’s Media Centre.

Peter Hetherington
CEO, Capital.com
Across the markets
The Capital.com platform provides traders with access to more than 3,700 different instruments across numerous markets: shares, exchange-traded funds, currencies, commodities and indices.
As of the fourth quarter, the Capital.com group reported trading volumes in excess of $1trn for 2022. We have group entities located in the UK, Cyprus and Australia that are respectively authorised and regulated by the UK Financial Conduct Authority, the Cyprus Securities and Exchange Commission and the Australian Securities and Investments Commission.
Highlights from this report
Selected key insights drawn from the trading data in Q4 2022:
- In the light of bearish market moves in the fourth quarter of 2022, trader behaviour evolved to include an increased adoption of short trading positions. The index market witnessed the greatest rise in short trades (43%).
- As asset volatility became an increasing feature of the markets in Q4, our traders’ use of stop-loss orders increased to around 12% of the platform’s trades.
- US tech stocks (US100) – along with oil, natural gas and gold – topped the list of most-traded assets on the Capital.com platform.
- Our clients actively traded risk events to take advantage of volatile market conditions, as evidenced by spikes in the total number of GBP/USD trades following US Federal Reserve and Bank of England meetings.
- Capital.com traders demonstrated their engagement with major risk events when they tripled the number of GBP/USD trades, reduced their net-long holdings in the pound for net-short positions, and increased the number of stop-loss orders on cable trades following the UK’s disastrous mini-budget that pushed sterling to a record low.
- When it came to trades relating to the wider US stock market (US500), our clients became more involved when stock markets declined rather than rallied within that bear market. They appeared to follow the path of least resistance lower.
- After Japan’s currency intervention in September to support the yen, traders tried to ‘catch the falling knife’ and buy the dip in USD/JPY following Japan’s second intervention in October.
- In contrast to large non-commercial traders, Capital.com retail investors preferred short positions on EUR/USD in Q4 2022. They switched from long positions in the summer when the euro slipped below parity with the US dollar.
- The strategy of buying the dip also came to light when our traders tried to chase cheap buys in the tech-heavy US100, after tech stocks achieved their lowest values since the Covid-19 pandemic began.
- A divided bearish and bullish attitude in long and short positions developed in Q4, after China decided to loosen the zero-Covid policy which had been plaguing productivity since the pandemic began.
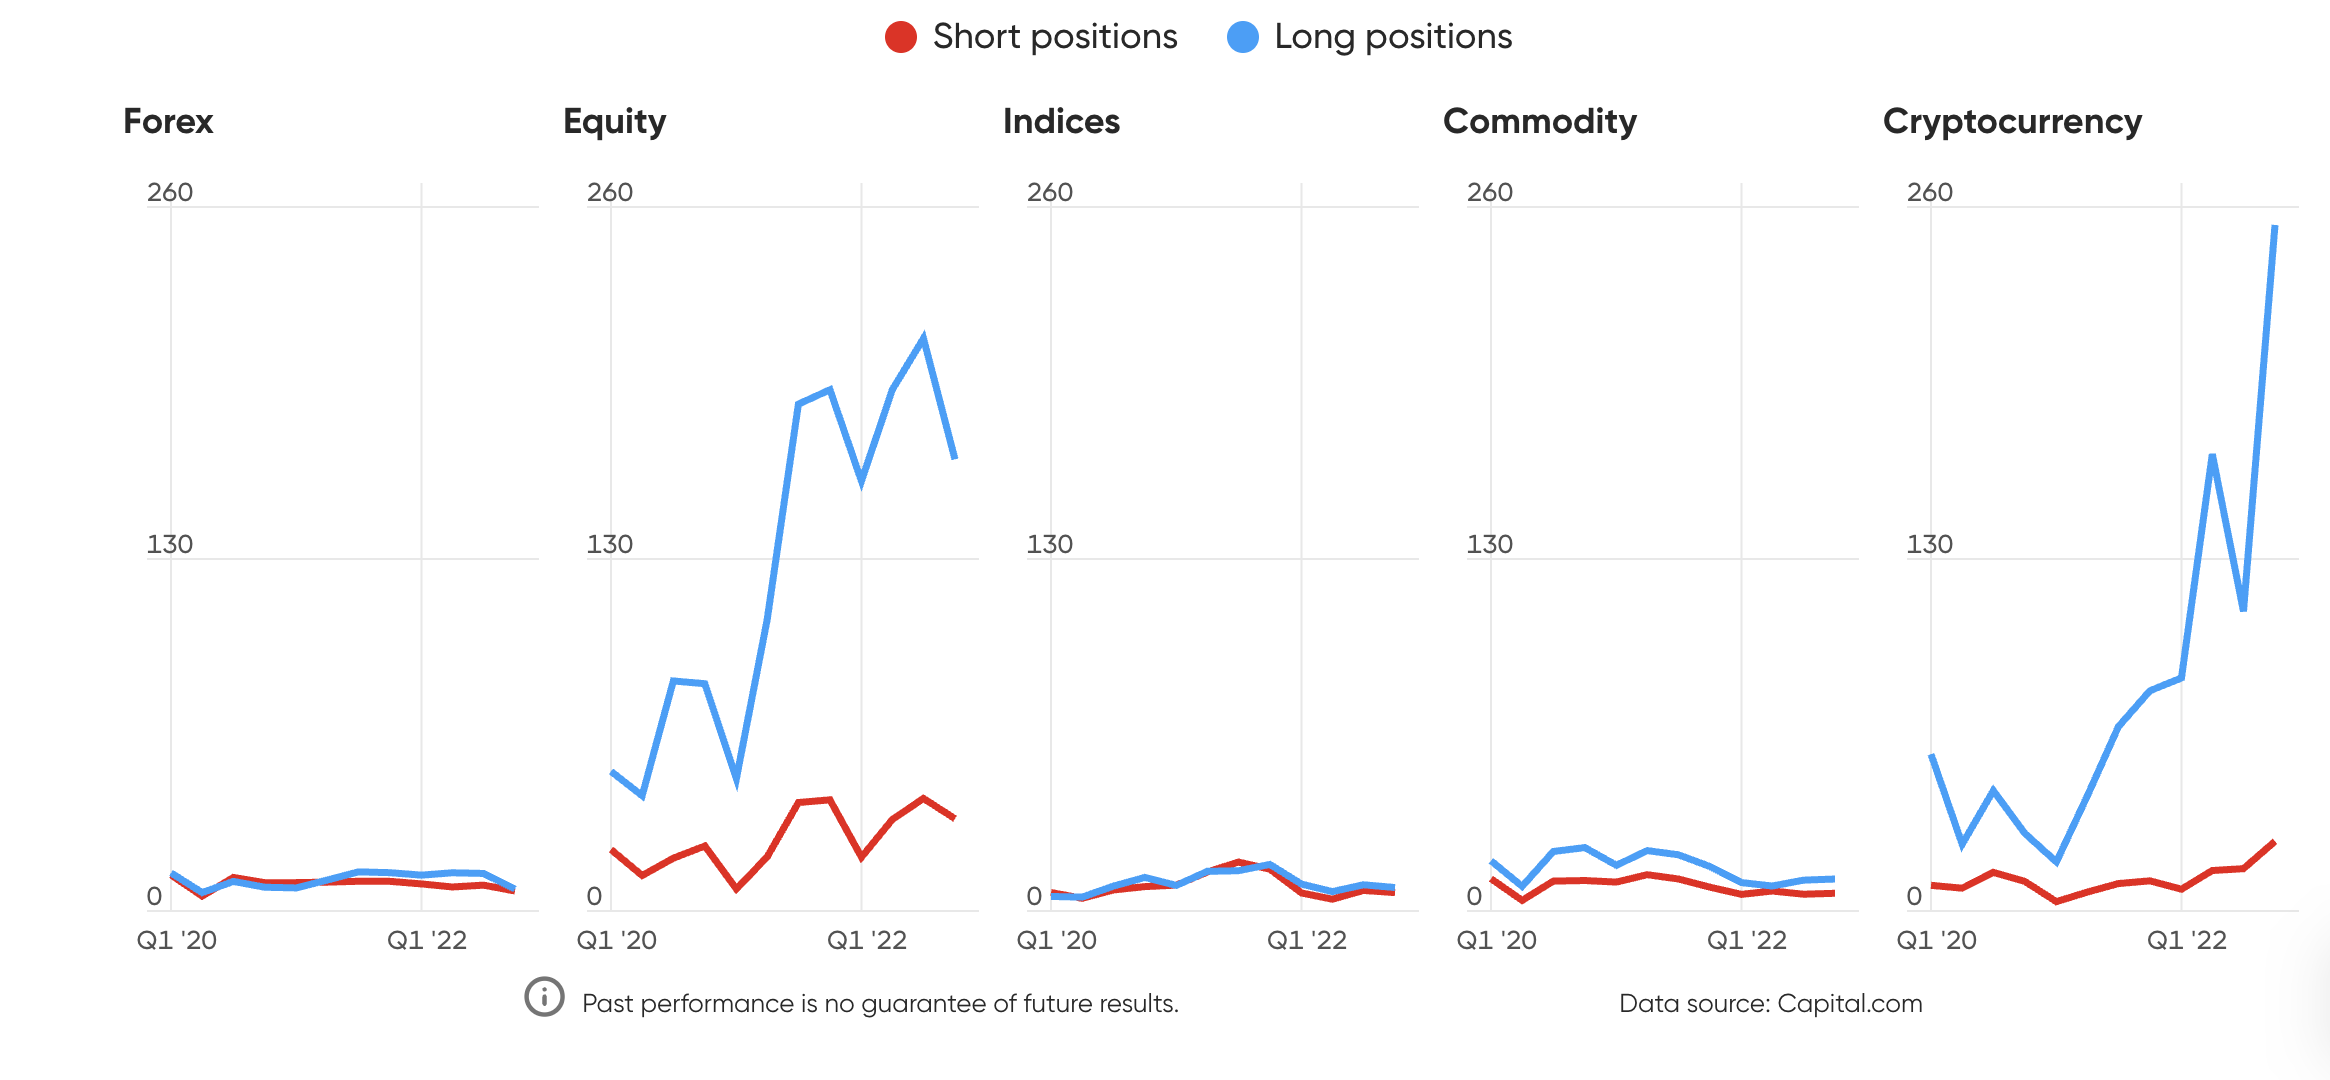
- Only the equity and cryptocurrency markets saw an increase in the length of trades, while the total number of trades across all asset classes dropped off as traders battled with the most difficult trading conditions in a generation.
- Turmoil in the cryptocurrency market induced by the collapse of the FTX exchange resulted in increased interest in the cryptos solana (SOL) and cronos (CRO). Dogecoin also saw increased interest following entrepreneur Elon Musk’s takeover of the social media platform Twitter.
Risk-management summary
Capital.com has seen record use of an important risk-management tool in Q4 2022 that lets our traders automatically exit a trade before losses mount up: stop-loss orders.
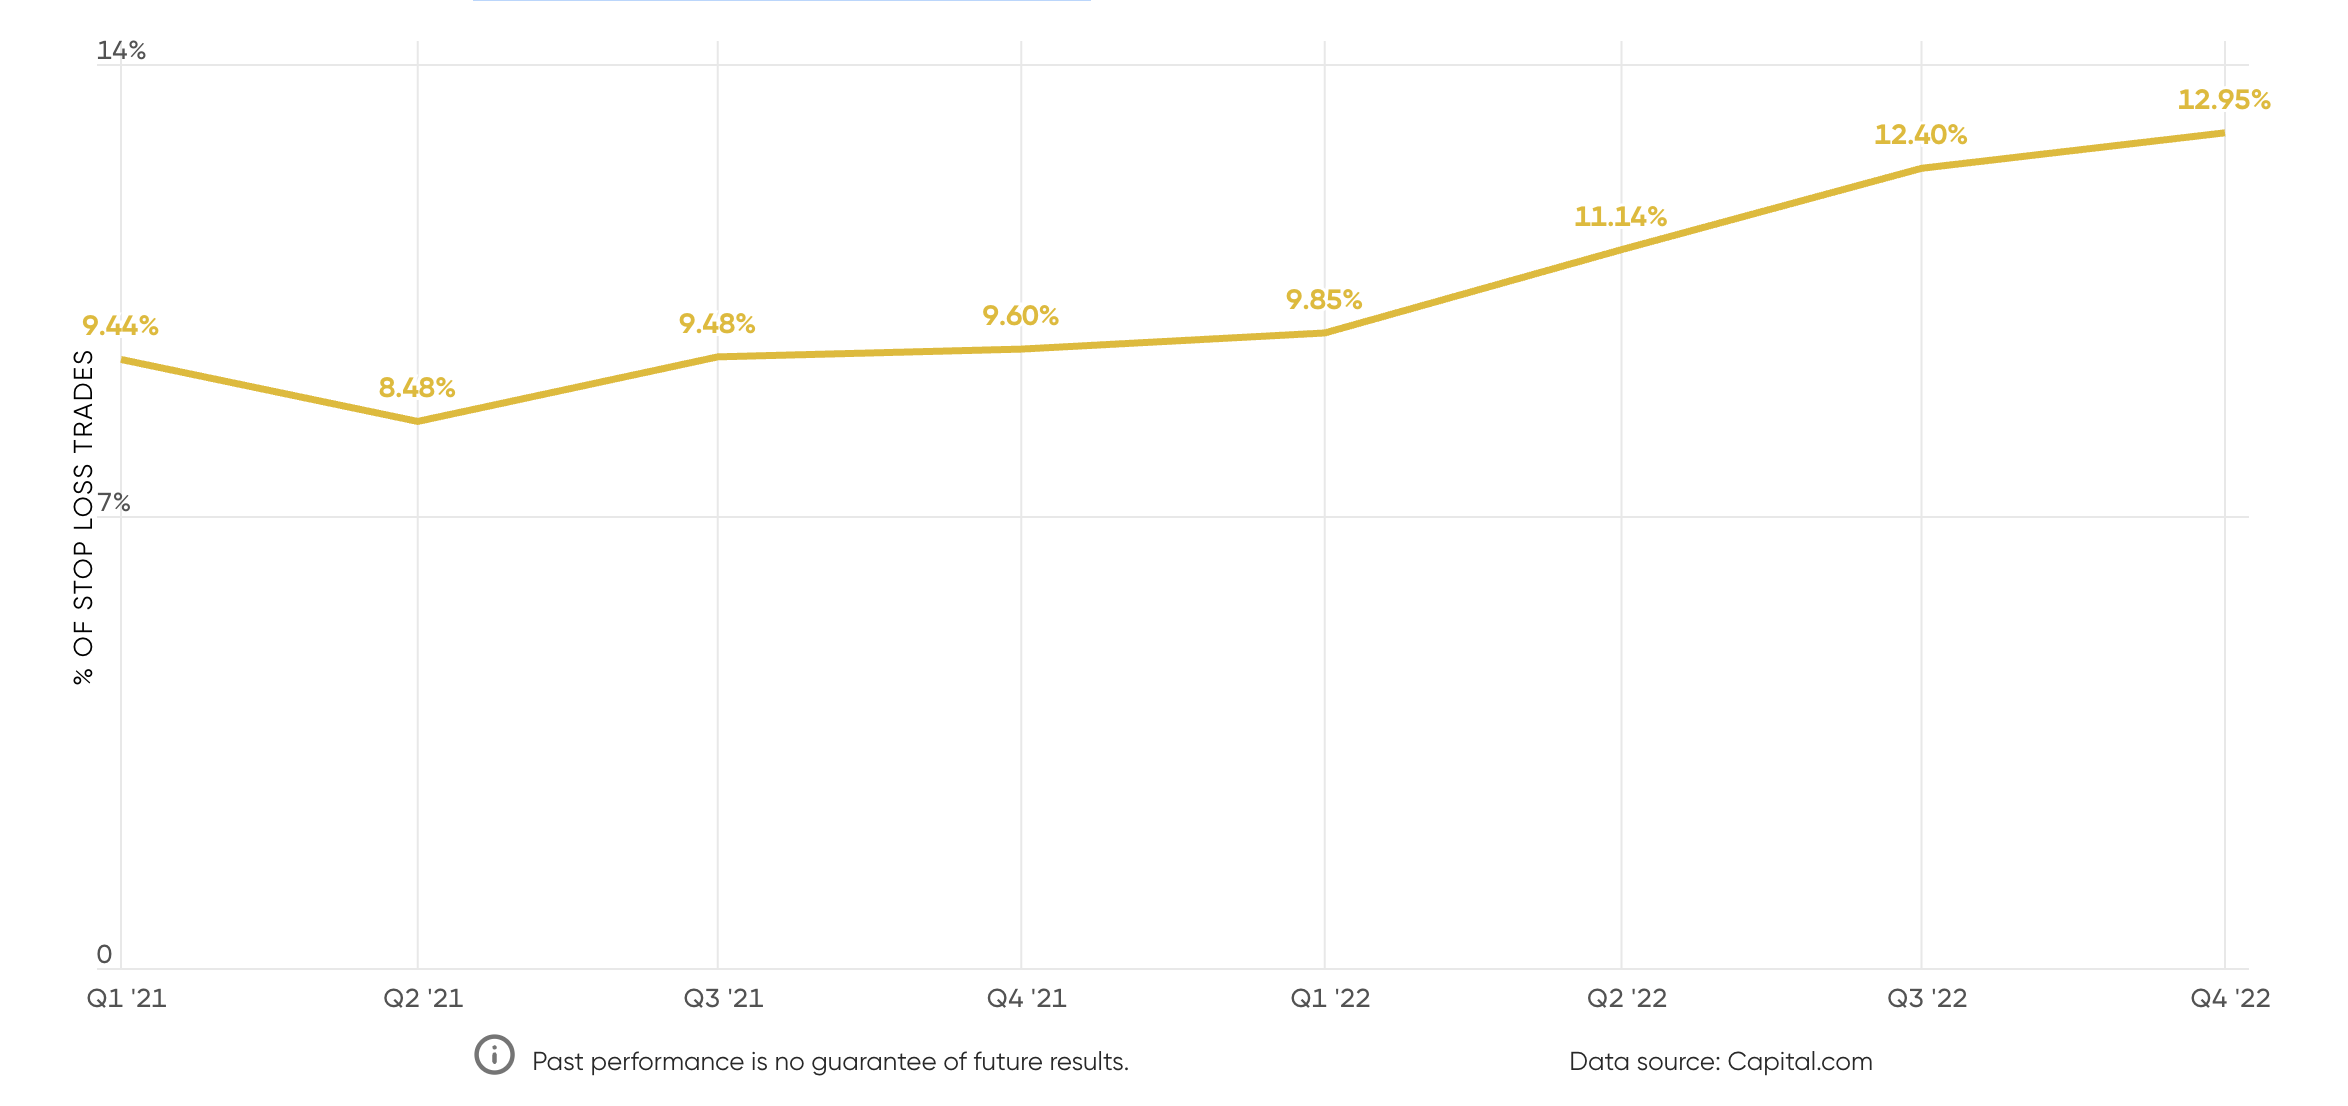
After a determined effort to educate our traders with guides and videos, the use of stop-loss orders on the Capital.com platform rose to 12.9% for the fourth quarter of 2022. For more about this, see below for Risk management: Stop-loss orders at record high.
Regular stop-loss orders are triggered automatically at the specified price level. However, they are not foolproof during times of heightened market volatility: if the asset price moves significantly past the stop-loss level in a matter of seconds, the order may be executed lower (or higher in the case of short trading) than the specified price, which effectively means that the loss will be greater than expected.
That’s why there’s also an option to set a guaranteed stop-loss (GSL) that guarantees to exit the position at the exact price set, despite the volatility. A guaranteed stop-loss typically comes at a cost as it involves the broker taking on extra risk. At Capital.com a guaranteed stop-loss is charged as a percentage on the opening volume for the client.
A look back on the trading trends of 2022
Following the pandemic’s two years of bullish moves in risky assets, 2022 has served as a reminder to Capital.com traders that markets may also fall and reverse their major trends.
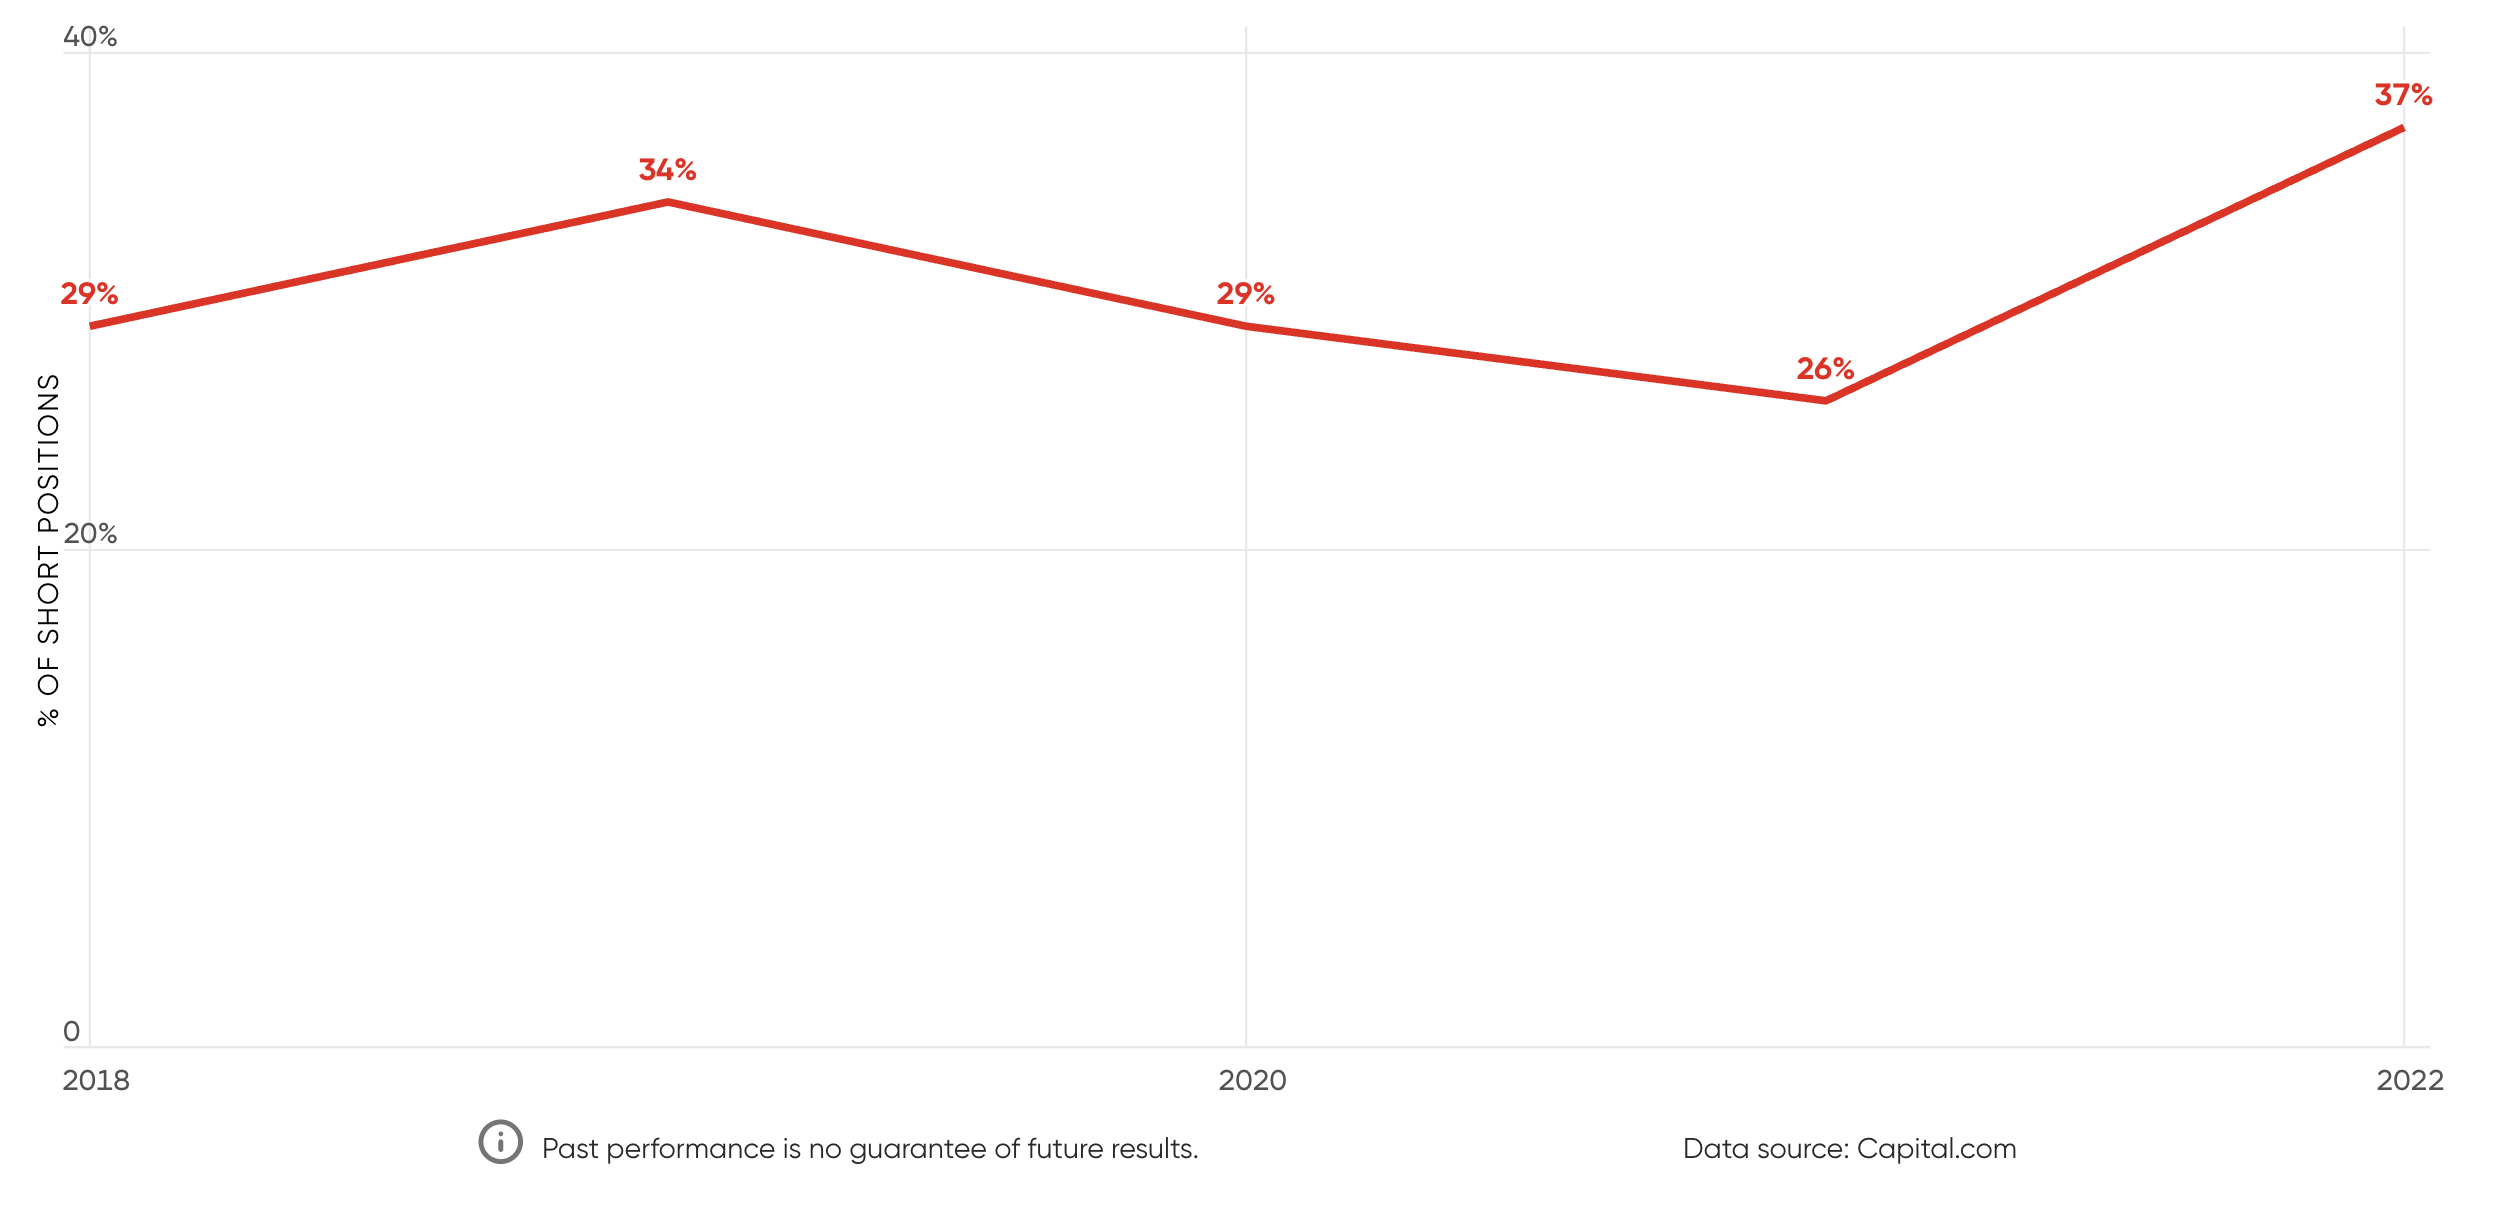
The percentage of short trades on our platform grew from 26% in 2021 to 37% in 2022, indicating that our traders’ behaviour evolved in response to new market conditions. Market volatility increased the proportion of traders looking to profit during phases of market downside.
Short sentiment climbs +11% in 2022 from 2021
Yearly percentage of long and short positions
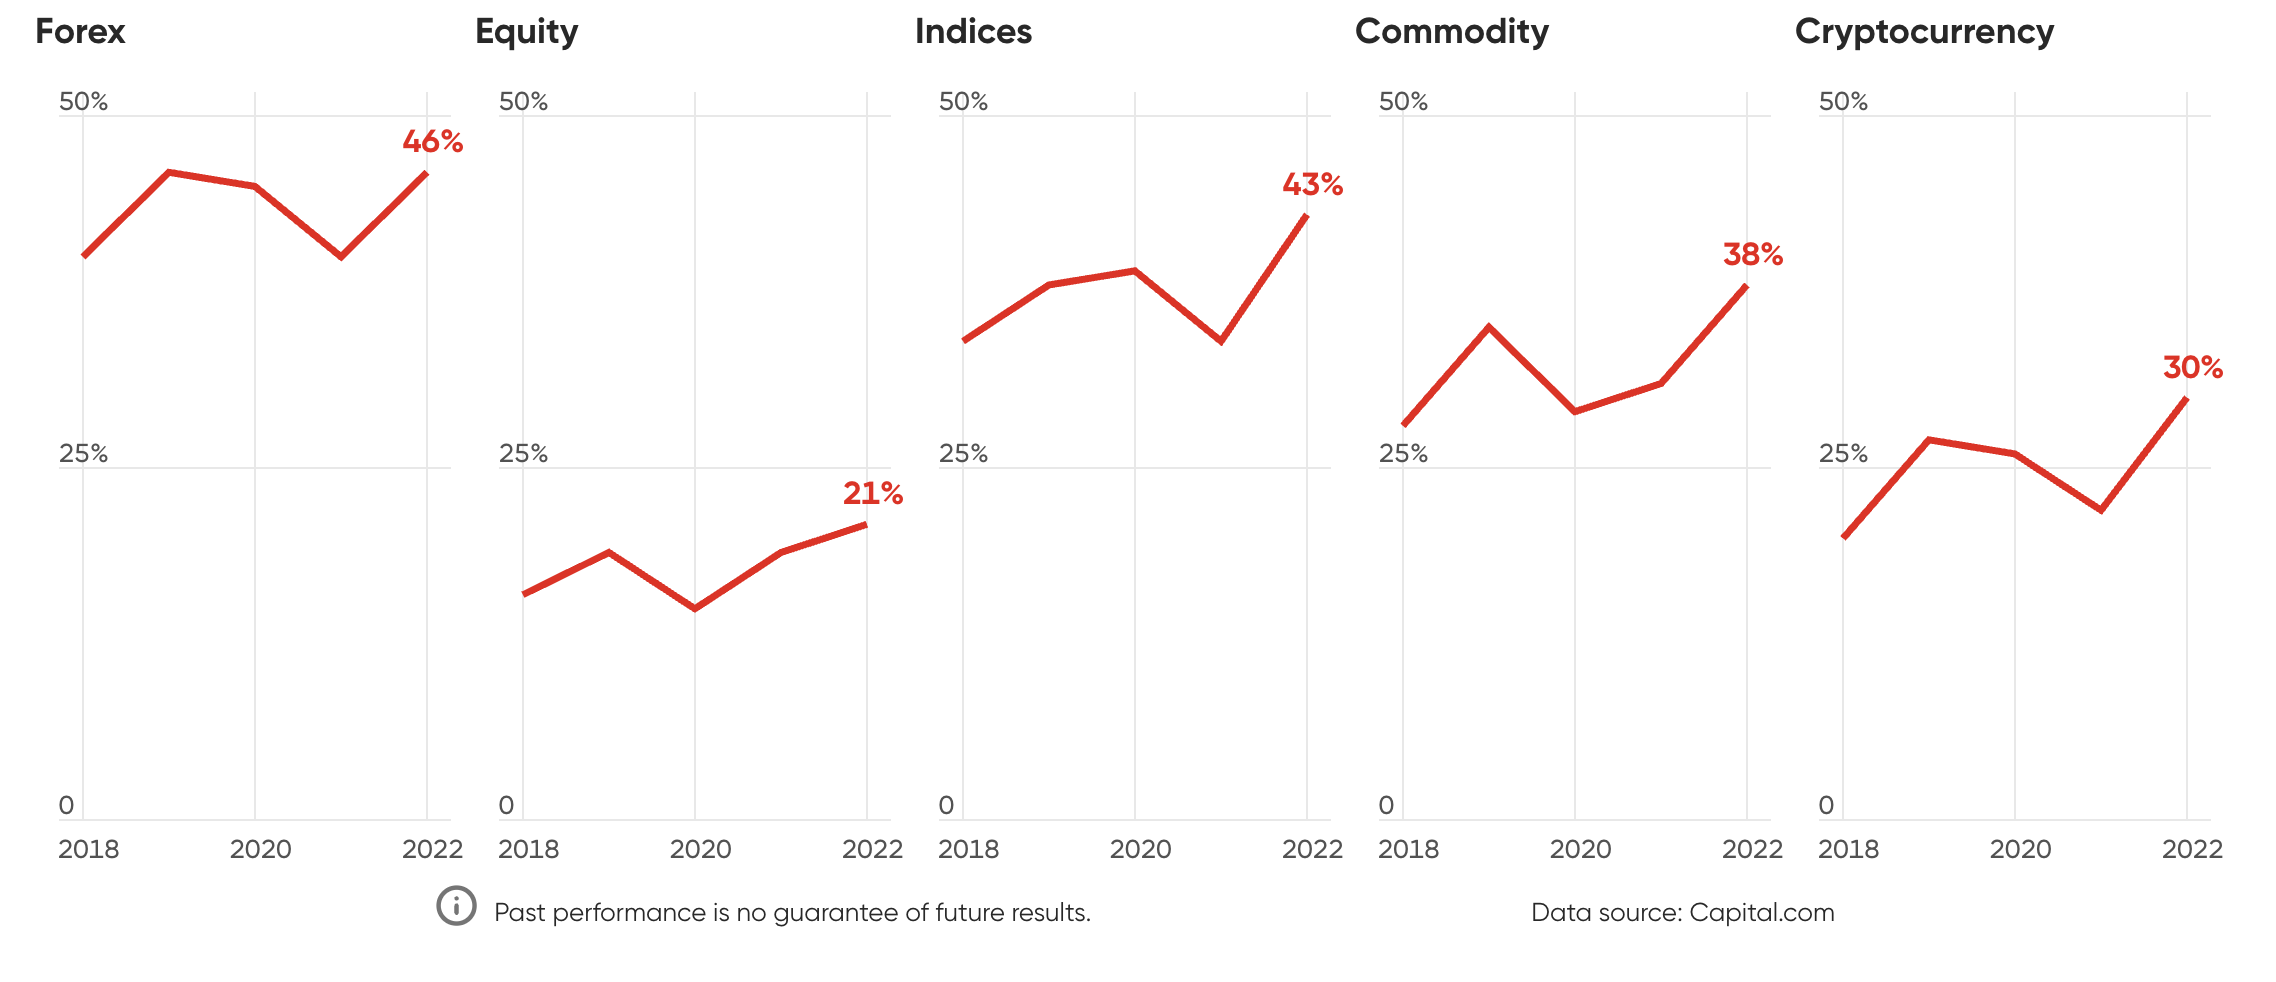
The index market had the greatest rise in the number of short trades, which reflects the year’s dismal equity performance. Since the beginning of 2022, the S&P 500 (US500) has lost about 20% of its value, and the tech-heavy Nasdaq 100 (US100) has lost even more (-32%). As a result, our traders were “chasing the momentum” by making more short trades on asset classes that were doing poorly.
Traders chased momentum in the index market
Short positions percentage change from previous year
Stop-loss orders increased in 2022
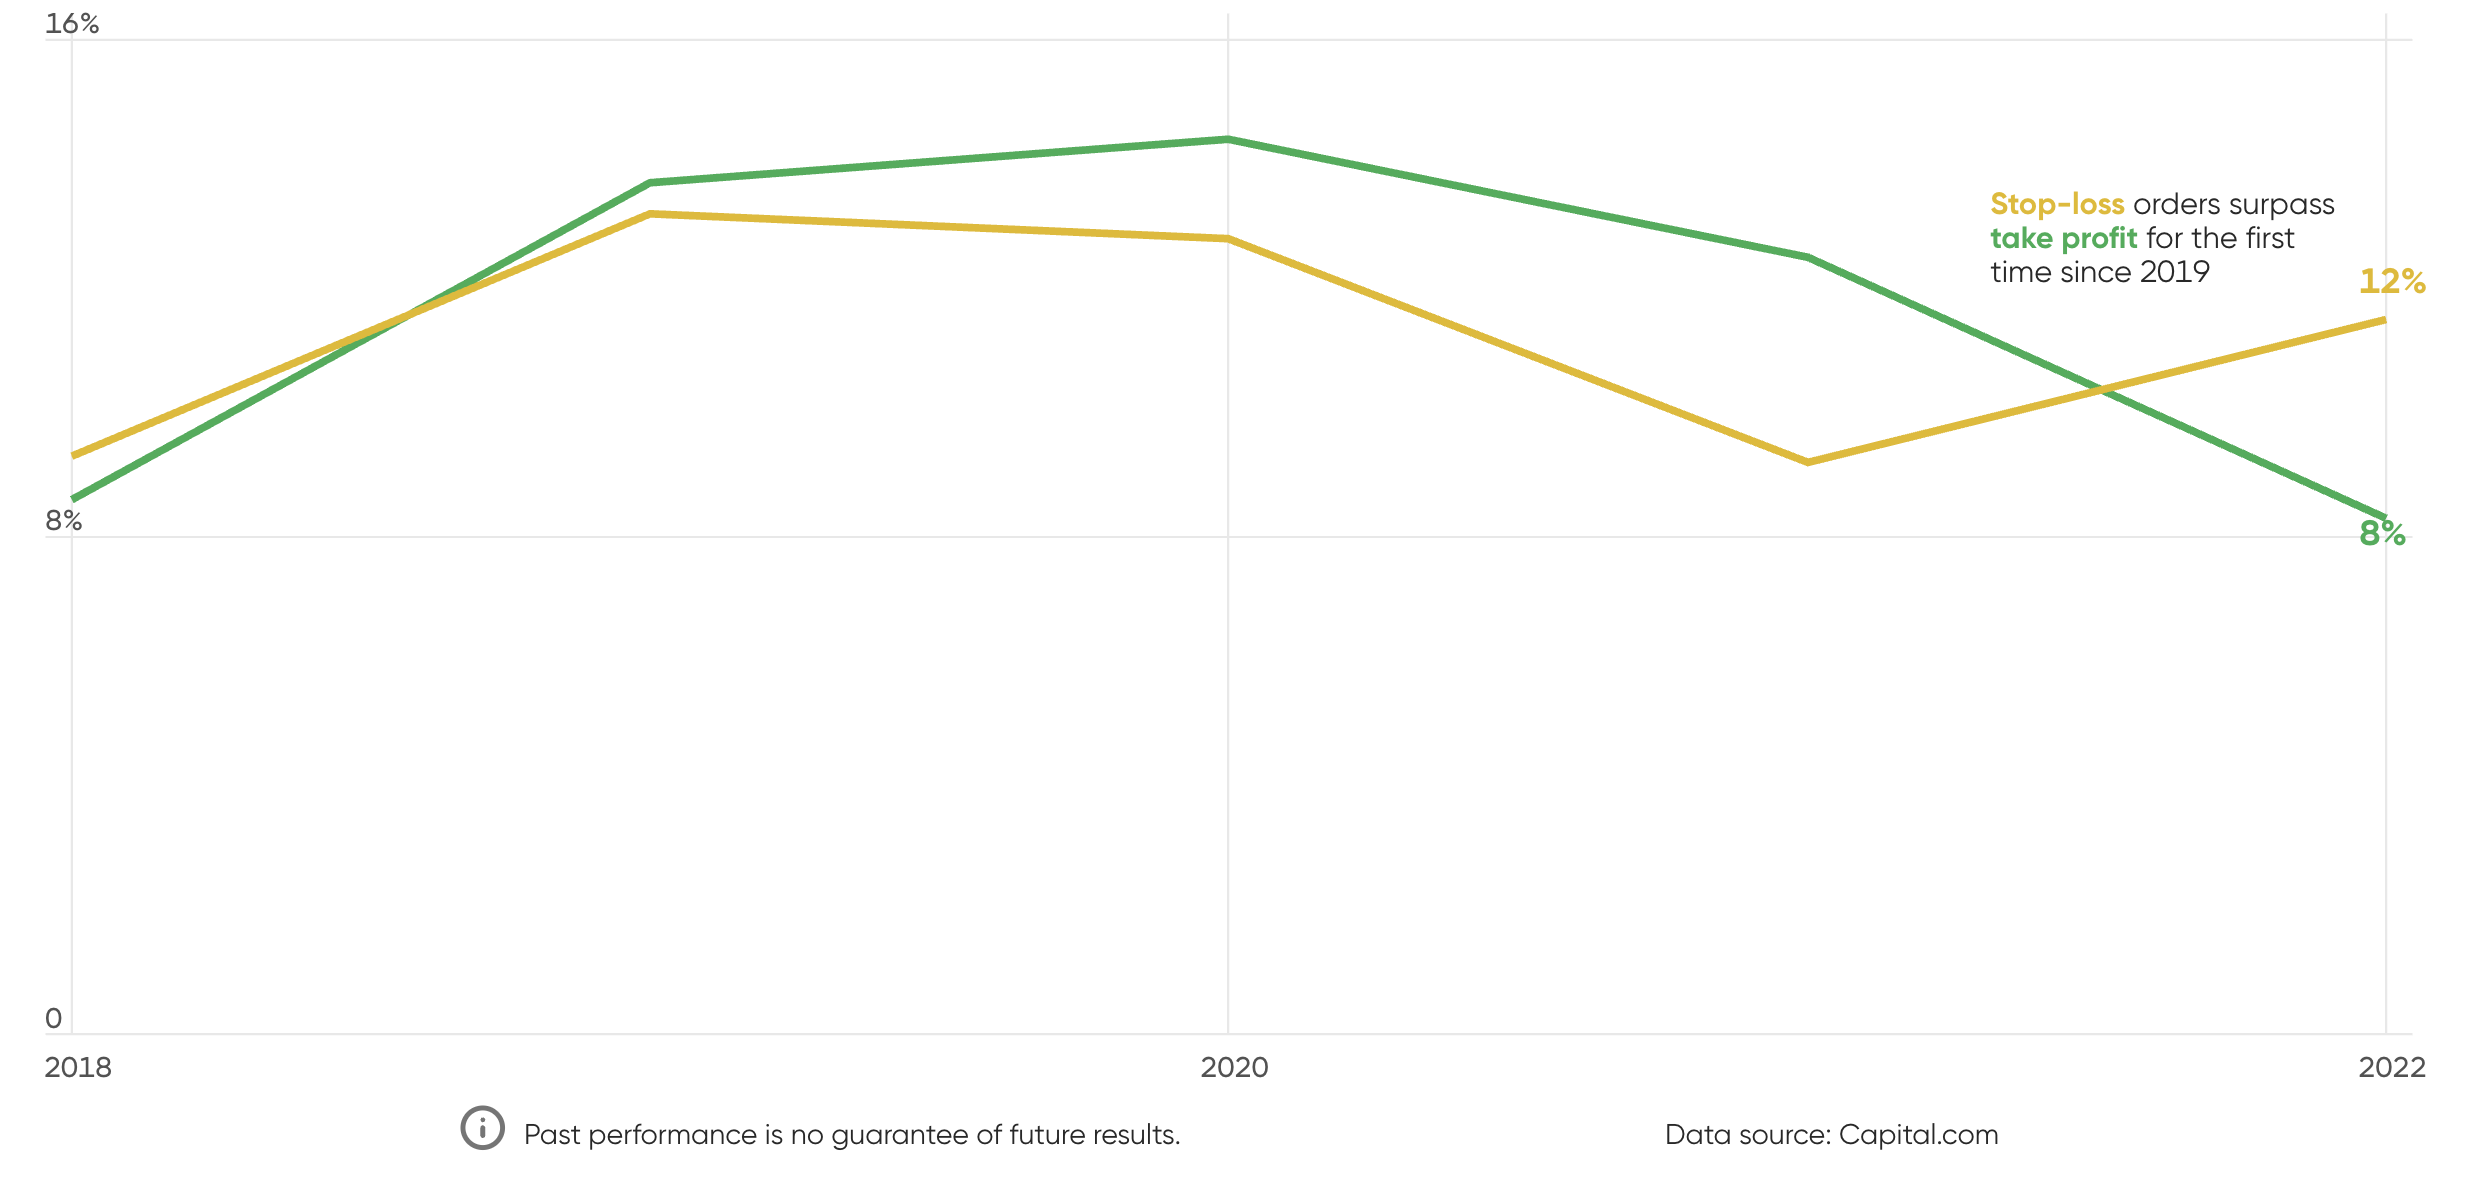
Persistent asset volatility in 2022 has prompted our traders to become more cautious, by increasing the number of transactions using stop-loss orders (see chart below). Concurrently, we saw a decline in the number of trades that had a take-profit order linked to them.
The proportion of trades including a stop loss increased from 9% in 2021 to approximately 13% in 2022. Simultaneously, the proportion of transactions with a take-profit fell from little more than 12% to 8%. This may indicate retail traders had a strong belief in riding out the ferocity of the bear market, and were reluctant to limit their potential returns while instead capping the downside from losses.
This is a common overconfidence bias that can influence trading behaviour. Investors may have believed they were entering a new major trend, and thus kept the door open to a potentially limitless upside. However, short-term market reversals within major trends operate against this strategy. We saw an example of such a bear market rally in July/August, and in the fourth quarter of 2022.
Stop-loss orders bounce back
Yearly percentage of trades using stop-losses vs take-profits
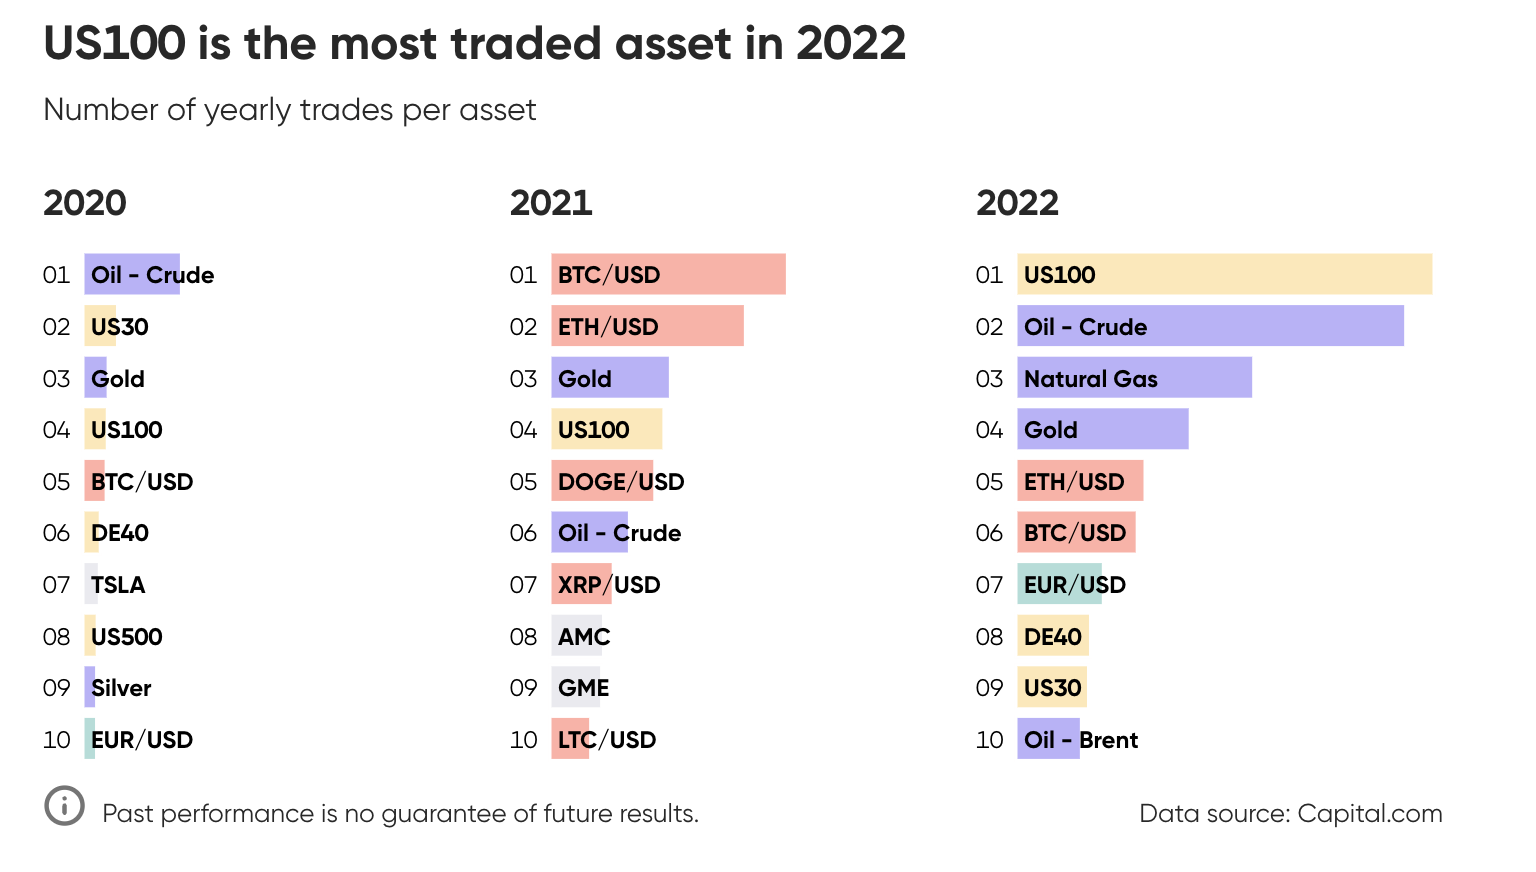
US100 and commodities dominated 2022’s most-traded assets
Aside from the US dollar, the Nasdaq and gold were perhaps two of the most closely tied assets to the trajectory in US Federal Reserve real interest rates.
Tighter monetary conditions diminished the valuation of risky assets such as technology stocks, and also reduced the incentive to purchase a non-yielding asset, such as gold.
After a big trend reversal from a decade-long bull market, our traders raised their trading interest in the US100 index. The tech-heavy index underperformed the wider US stock market (US500) and equity indices from other advanced countries.
Oil and natural gas were the two assets most tied to the escalating geopolitical risks following Russia’s invasion of the Ukraine in February 2022.
Key themes of Q4
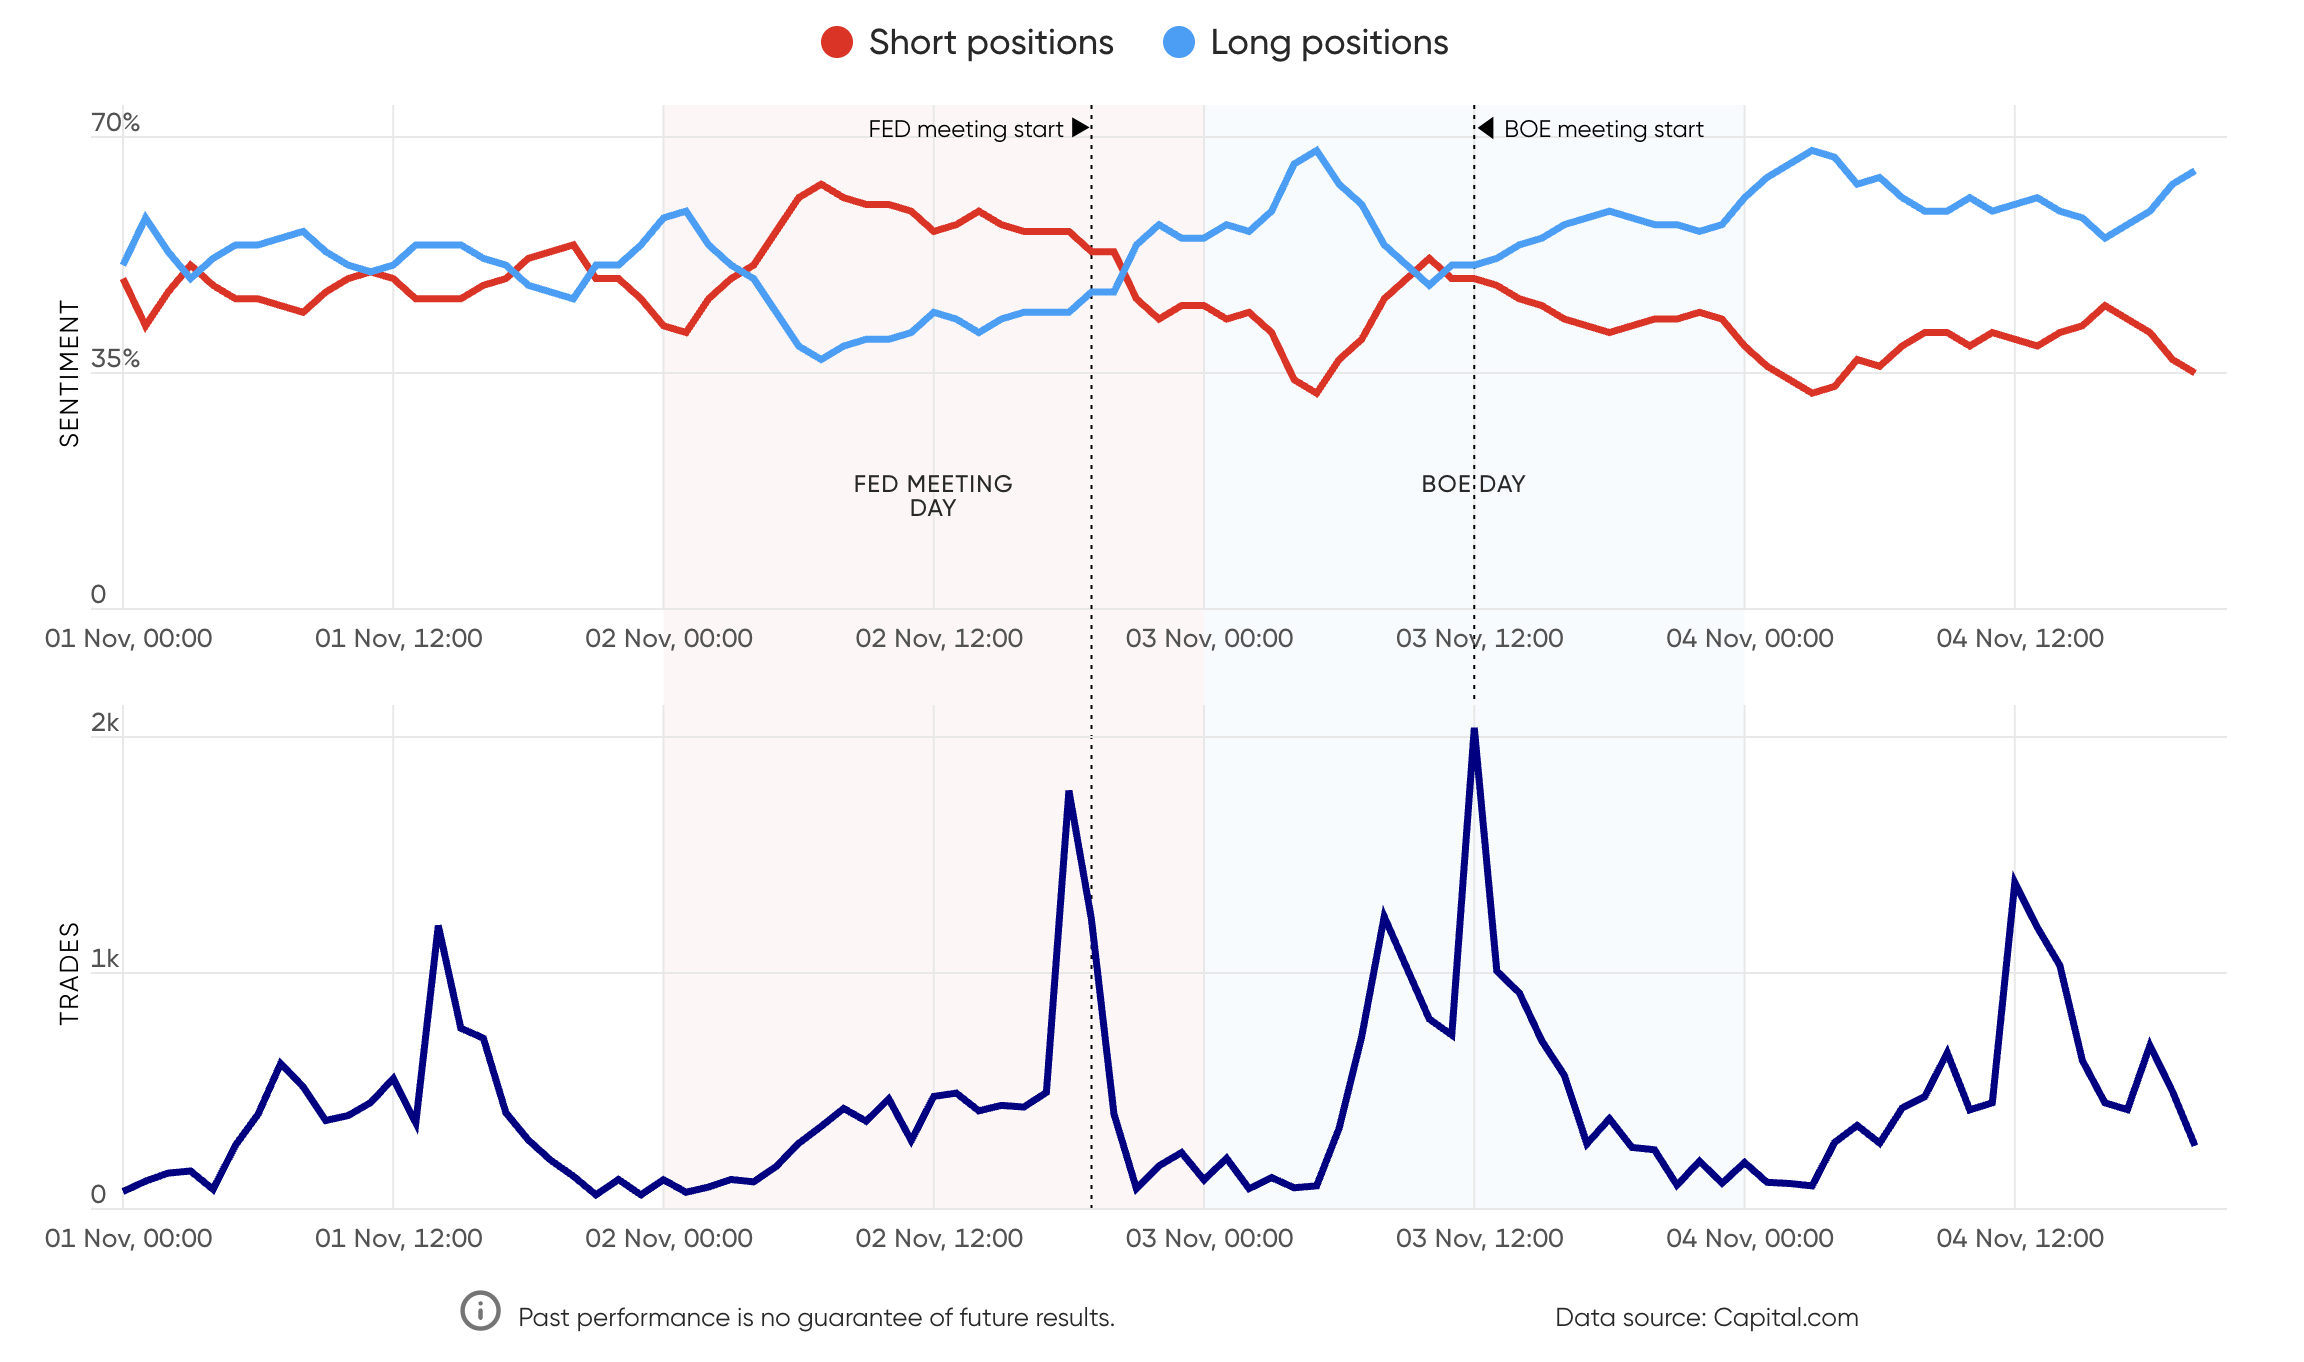
Fed and BoE divergence trend ends: Traders rise to risk events
Central-bank meetings often produce market swings in many asset classes – particularly if speculative traders establish positions ahead of time, and then quickly buy or sell if caught on the wrong side of a trade. This was evident in the fourth quarter of 2022, with an interesting twist in sentiment at the November Federal Reserve and Bank of England meetings. The total number of cable trades spiked during both the Fed and BoE meetings, as would be expected.
Daniela Hathorn, senior analyst at Capital.com, said:
Prior to the meetings, the market was predominantly dollar-bullish. Between the start of the year and 26 September (when the pound hit a record low of $1.04), GBP/USD was down 23% as the dollar made strong ground against most rivals.
But, sentiment was already starting to turn. Headline US inflation, peaking at 9.1% in June, began to dip. While the Fed remained hawkish in August, economists were increasingly expecting a dovish pivot down the line.
This sentiment caught the attention of Capital.com traders. While markets had been pricing in the 0.75% rate hike that the Fed delivered in the November meeting – its third-consecutive hike at that level – traders were speculating that the central bank’s statement would reveal an increase in dovish sentiment from some of the Fed’s members.
The figures below show long GBP/USD trades fell in value going into the Fed meeting, while the value of short trades increased. These trends reversed, however, when the dovish pivot failed to materialise. Over the Fed’s two-day meeting, the pound lost nearly 3% against the dollar. But sentiment flipped again on 3 November, as the BoE made its own 0.75% hike – the bank’s biggest rate increase in three decades. GBP/USD longs re-emerged and short trades fell in value.
Hathorn said:
Such has broadly been the pattern during the remaining weeks of 2022, as the dovish pivot by the Fed was increasingly speculated upon while the headline annual US inflation rate continued to dip. Indeed, that dovish pivot was finally seen during the Fed’s December meeting.
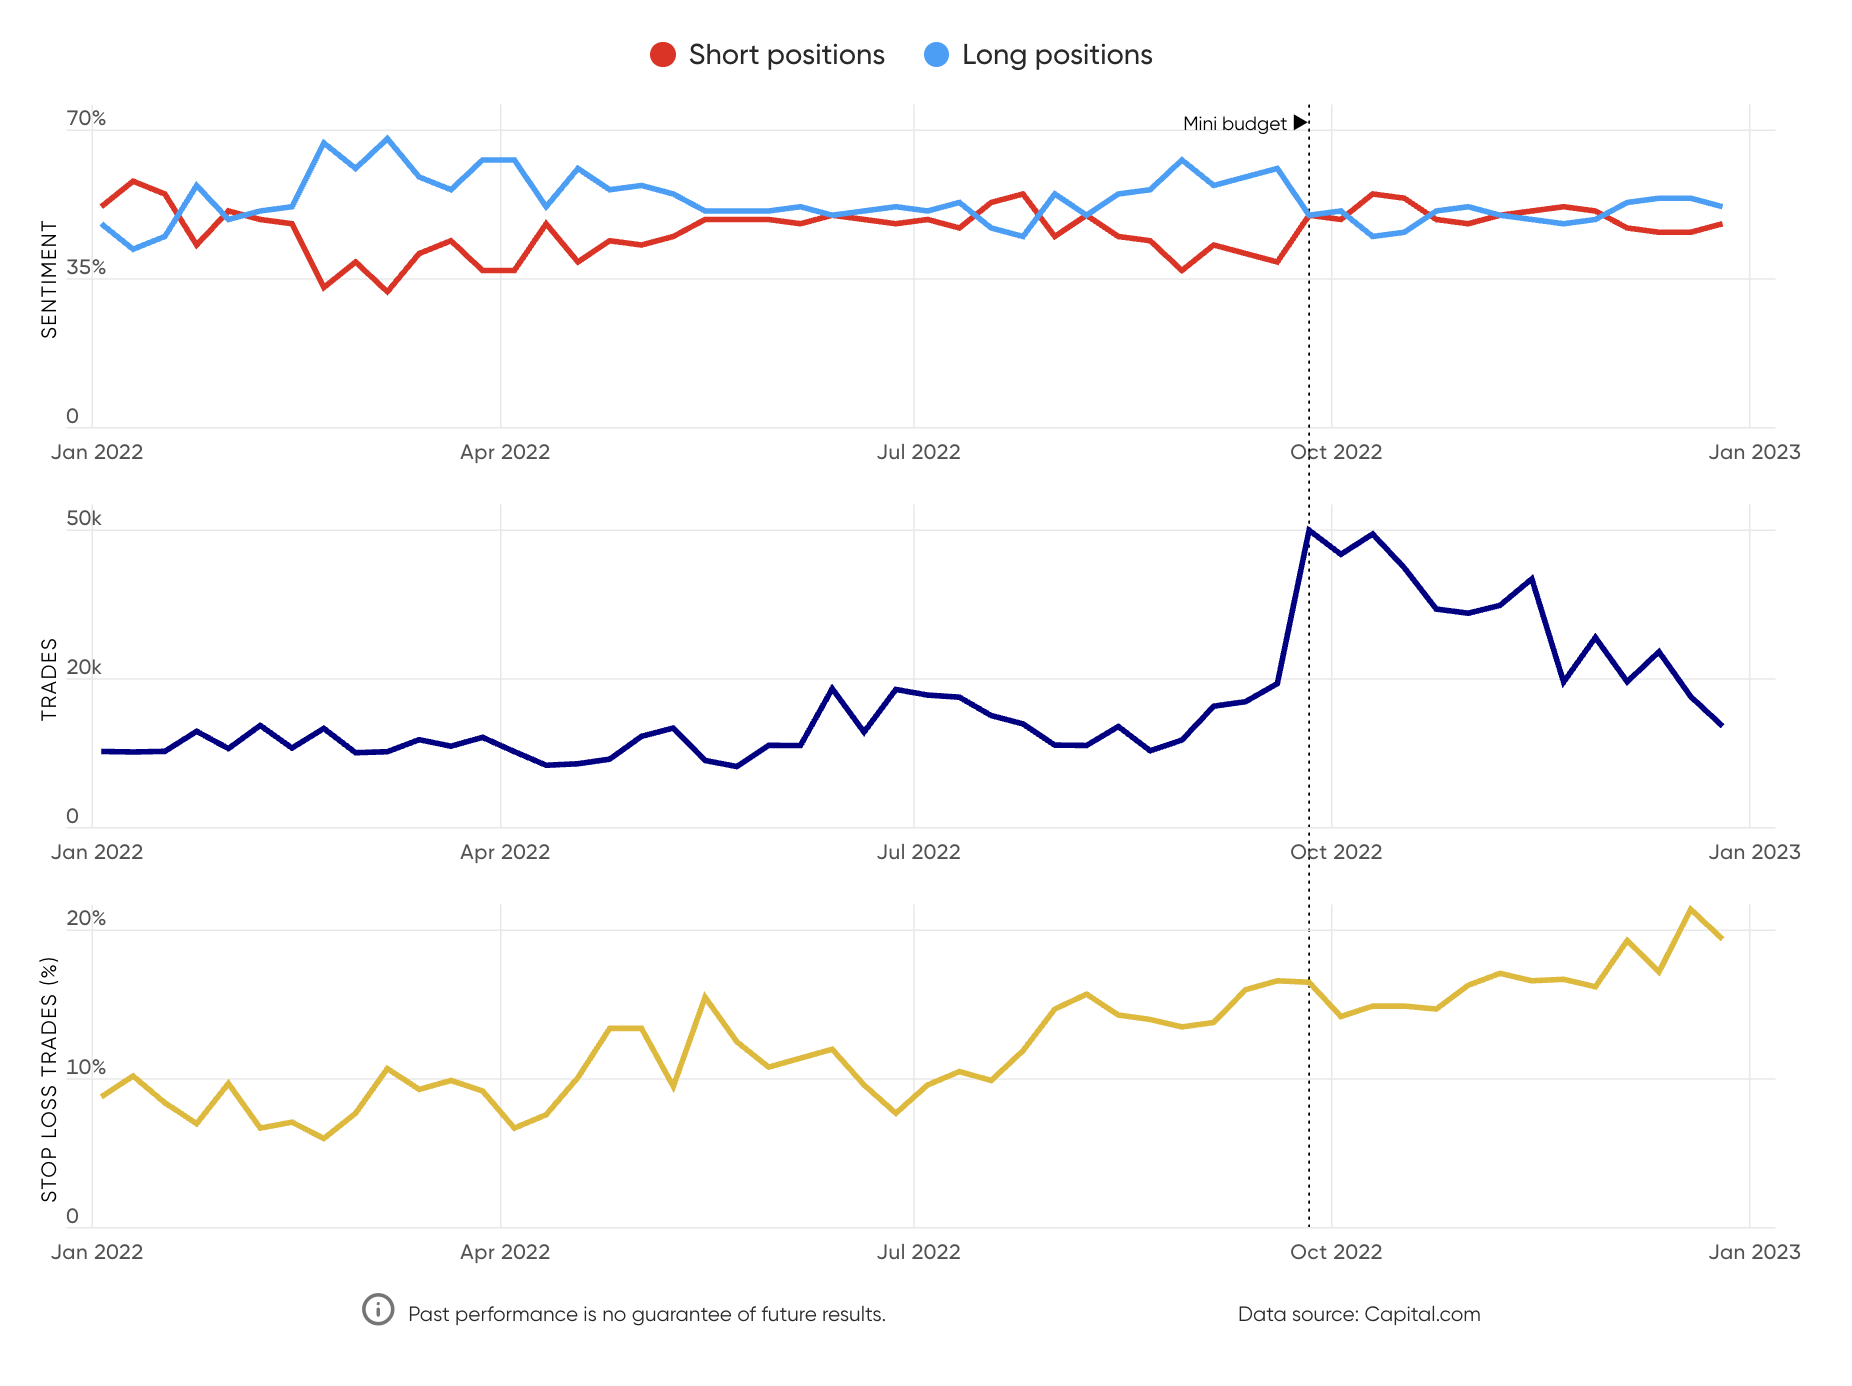
GBP/USD traders take advantage of volatile market conditions
Percentage of long and short positions vs total number of trades
Trouble for sterling: Huge trader interest as stop-loss orders increased
When the pound hit a record low of $1.035 on 26 September, following the disastrous mini-budget statement from the short-lived UK administration of Liz Truss, how did Capital.com traders respond to this volatile situation? Well, the number of GBP/USD trades hit its highest level for 2022 (and coincidentally the highest level since 2020). Meanwhile, the percentage of trades with stop-loss orders rose to 16.54% on 26 September – and it continued to rise, achieving 19.4% on 26 December.
Since the pound’s September downfall (and the ousting of Truss as prime minister and the sacking of her chancellor, Kwasi Kwarteng), sterling recovered to close 2022 at around $1.21, up by 16%. Capital.com traders have remained bearish on the currency pair, with short levels of between 48% and 55%.
Piero Cingari, market specialist at Capital.com, said:
In addition, Justin McQueen, market specialist at Capital.com, saw the use of stop-loss orders as a positive step by Capital.com traders. McQueen said:
GBP/USD hits highest number of trades since 2020
Weekly number of trades
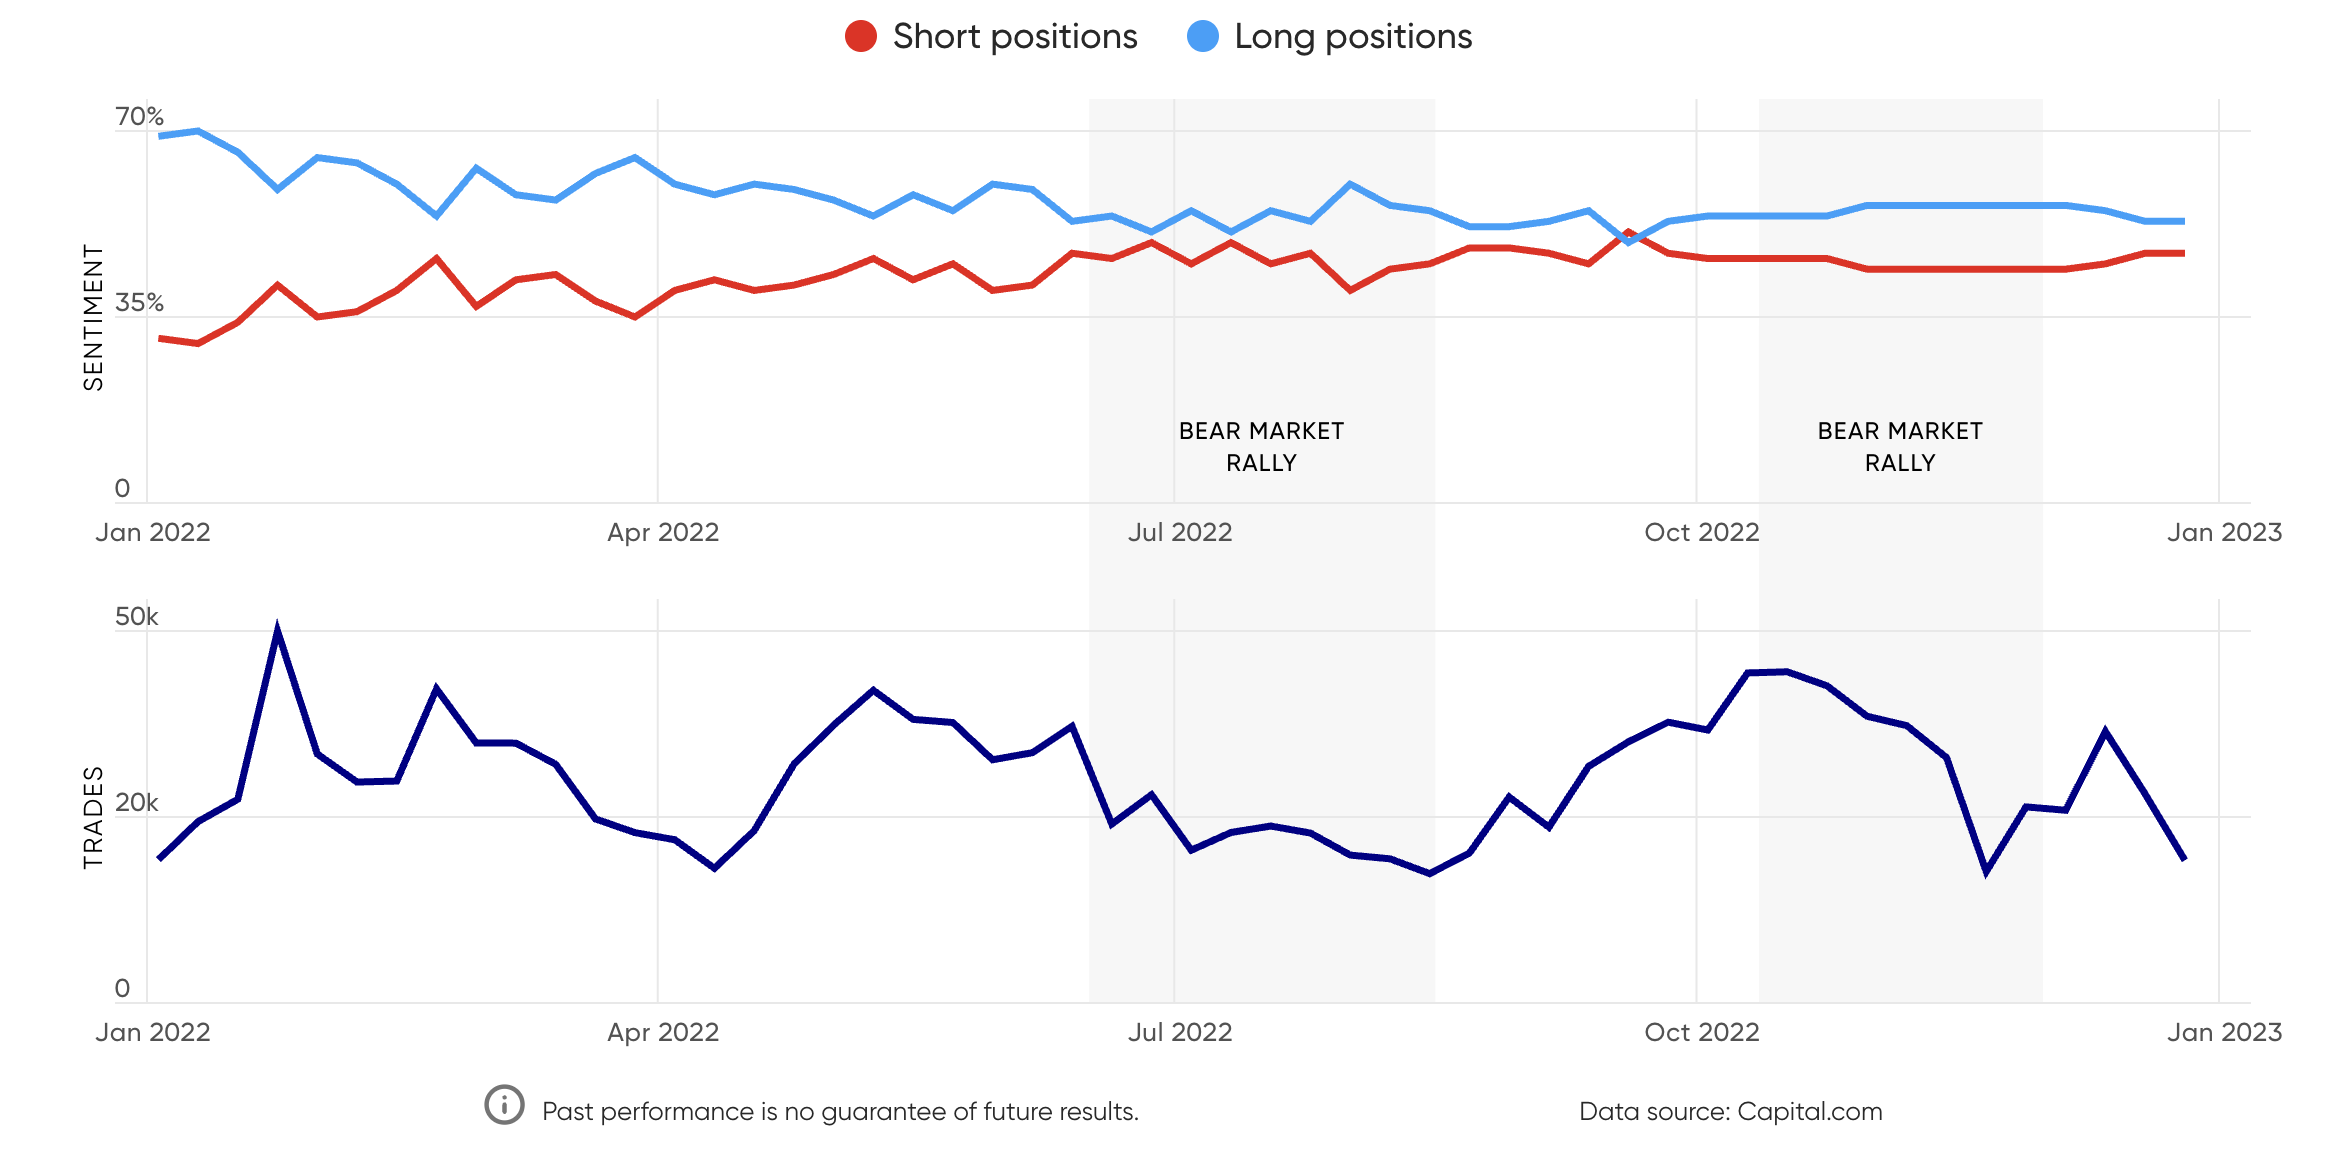
Bear market rallies repel traders while crashes attract them
Market crashes – the sudden decline in stock prices that usually follow a period of uncertainty, speculation, excessive optimism or an economic bubble – have presented some interesting data on how retail investors have behaved during these events. Importantly, Capital.com traders have been more involved during market crashes.
In the chart below, the two areas shaded grey represent the last two bear market rallies. According to Daniela Hathorn, market analyst at Capital.com, this shows that traders were focused on limiting their losses.
Capital.com traders have been more involved during market crashes
US500 percentage of long and short positions vs total number of trades
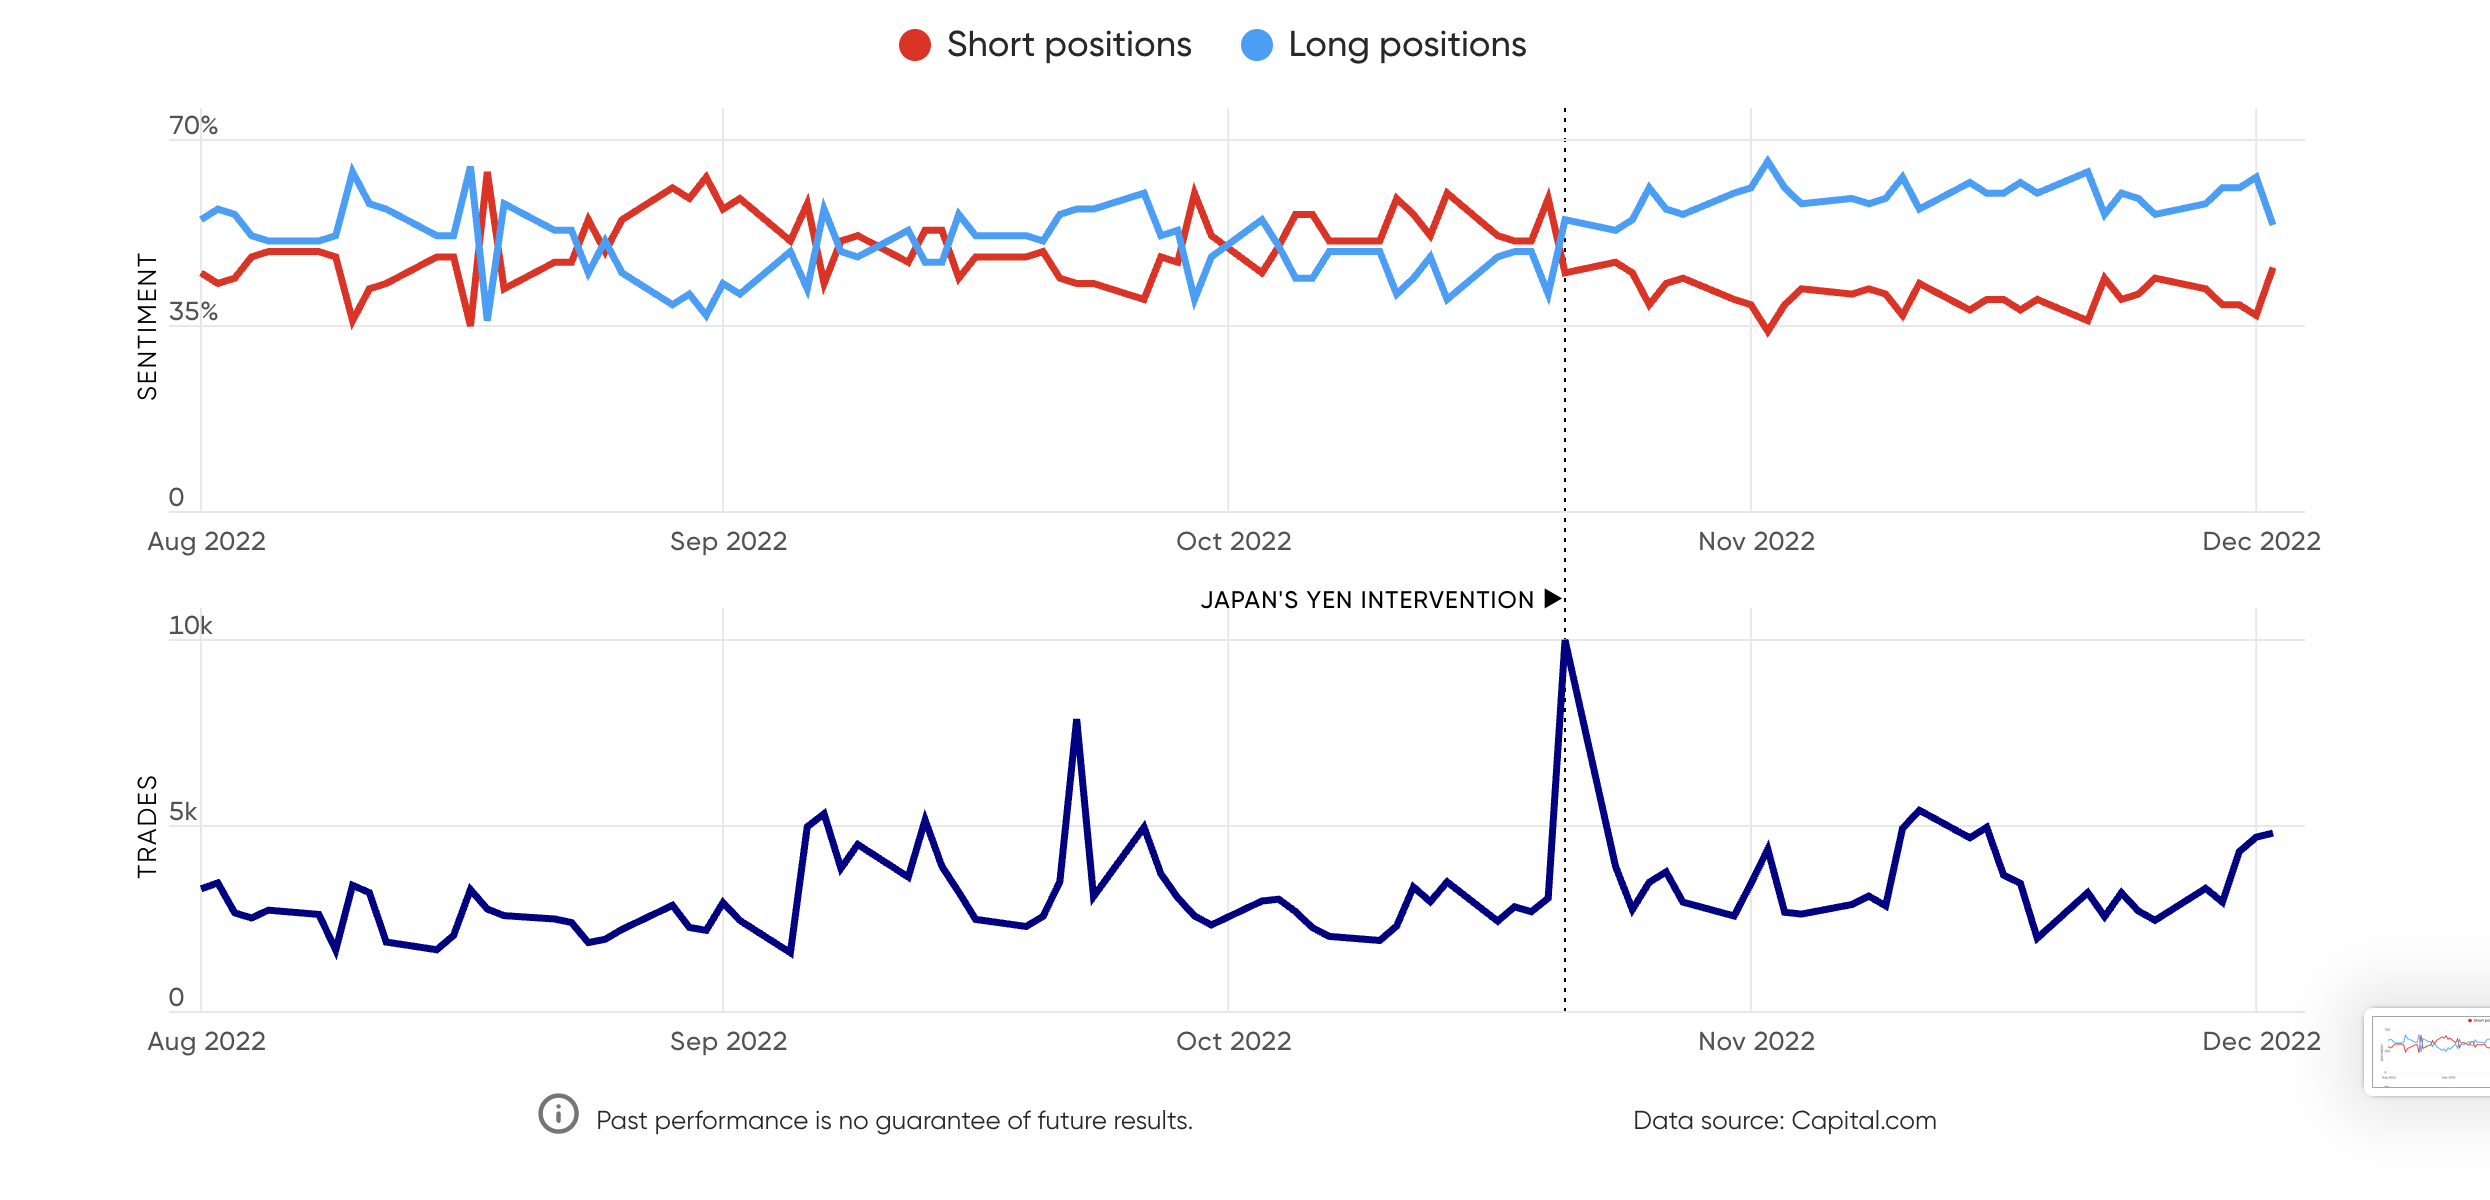
USD/JPY: Currency intervention sparks opportunity to buy the dip
Since the Bank of Japan (BoJ) met in September, attention has been on the sliding Japanese yen. It has received a record amount of intervention from Japan, estimated to be worth more than $60bn.
Justin McQueen, senior market specialist at Capital.com, said:
However, this did not deter Capital.com traders from trying to find an opportunity. McQueen added:
Currency intervention creates opportunity for traders to buy the dip
Percentage of long and short positions vs total number of trades
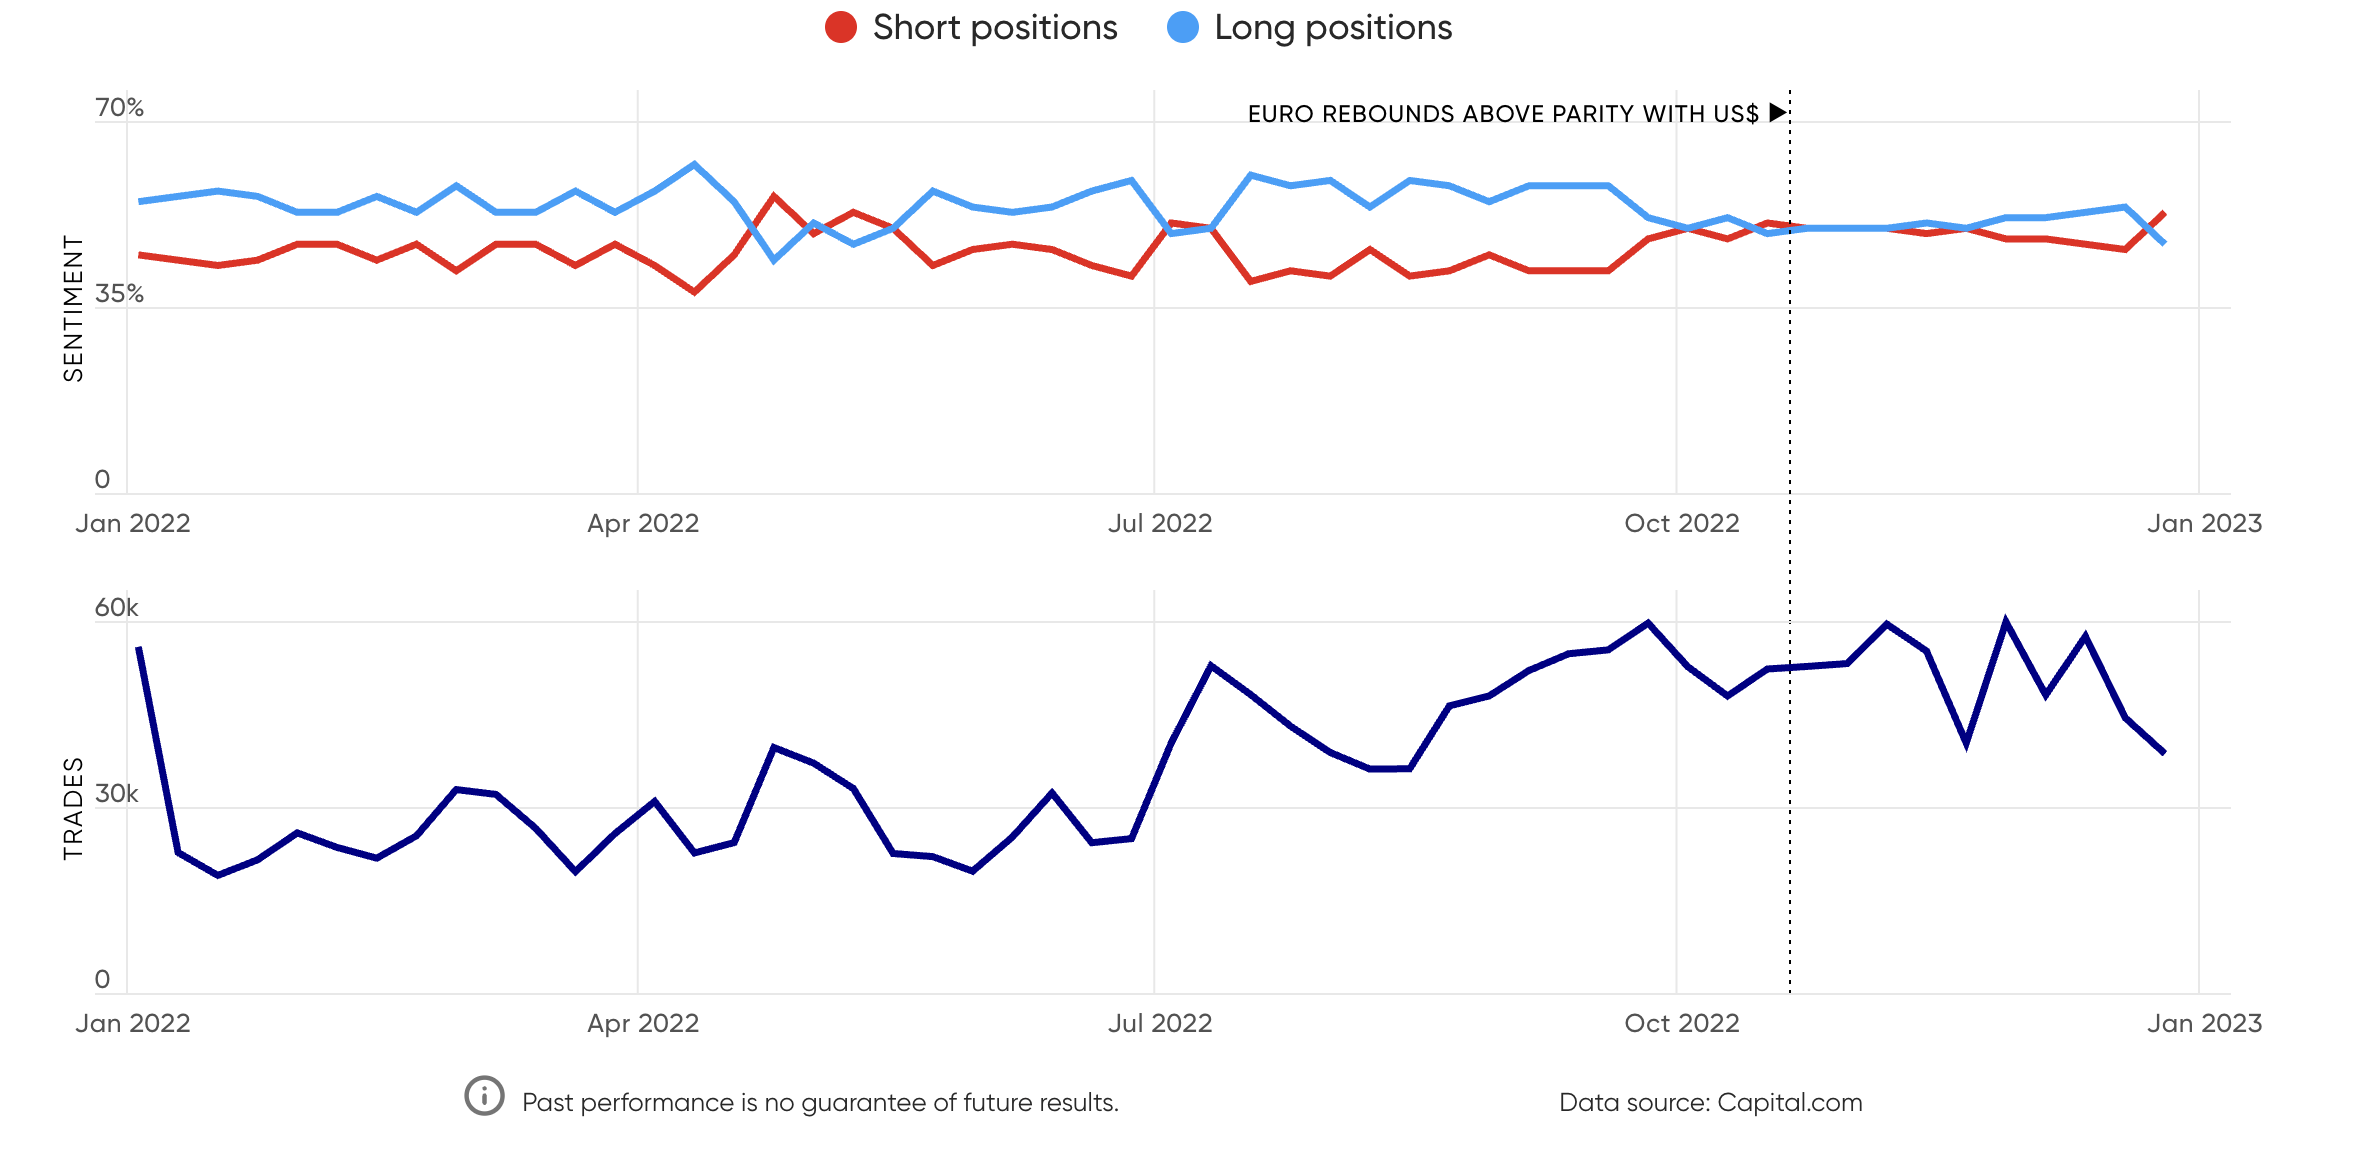
EUR/USD: Retail investors adopt contrarian position on currency pair
According to the most recent Commodity Futures Trading Commission (CFTC) Commitment of Traders report, large non-commercial traders have expanded their long holding on the euro to its highest level since the first quarter of 2021 – switching from a net short position held in the first half of the year.
Piero Cingari, market specialist at Capital.com said:
Our traders appeared to favour the contrarian strategy of going long on the euro’s weakness in the summer, when the EUR dropped below parity levels against the USD, and subsequently going short on it when positive news came in at a later stage.
Cingari concluded.
Bearish sentiment as the euro rebounds
Percentage of long and short positions vs total number of trades
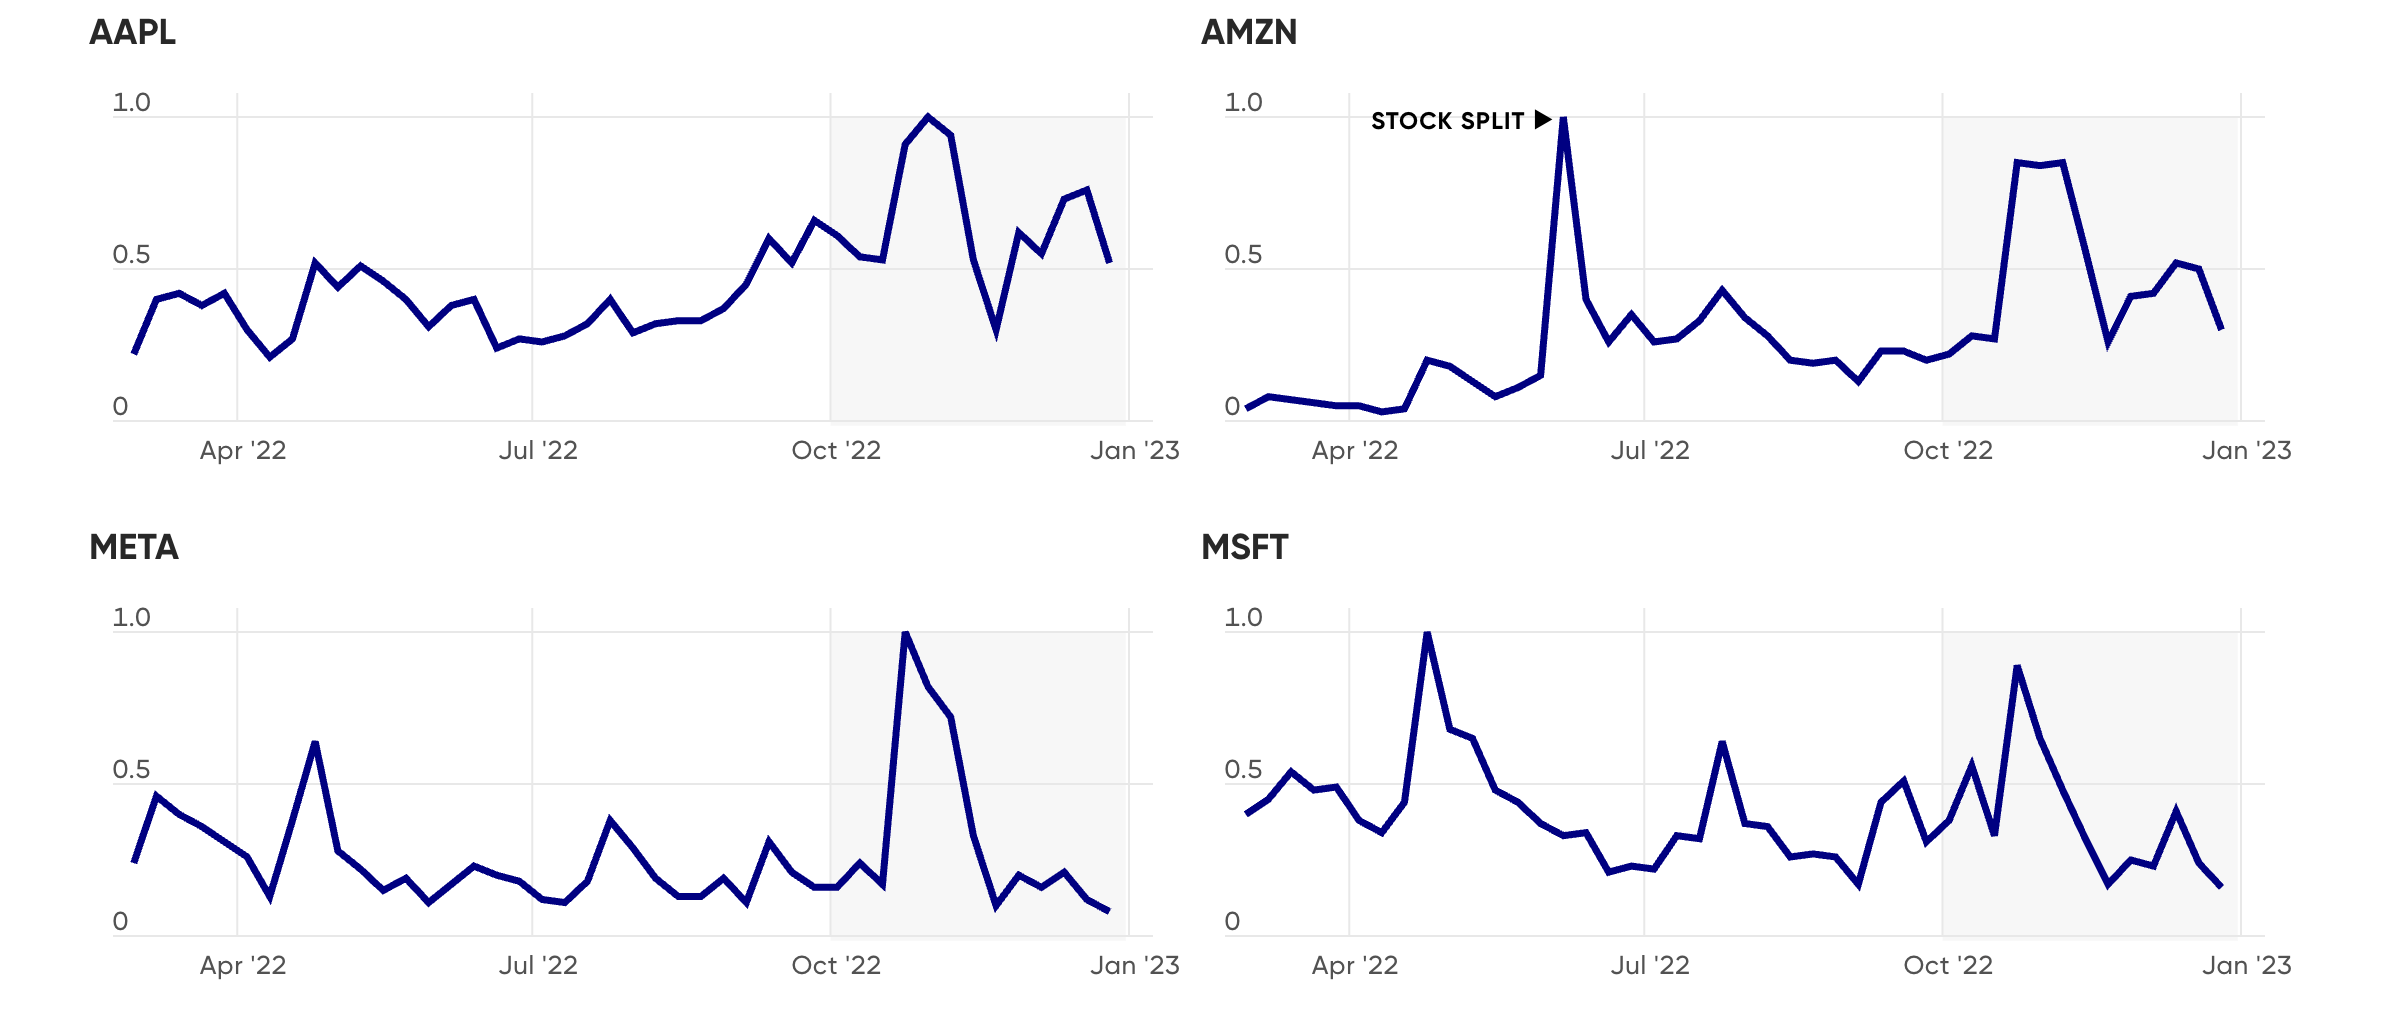
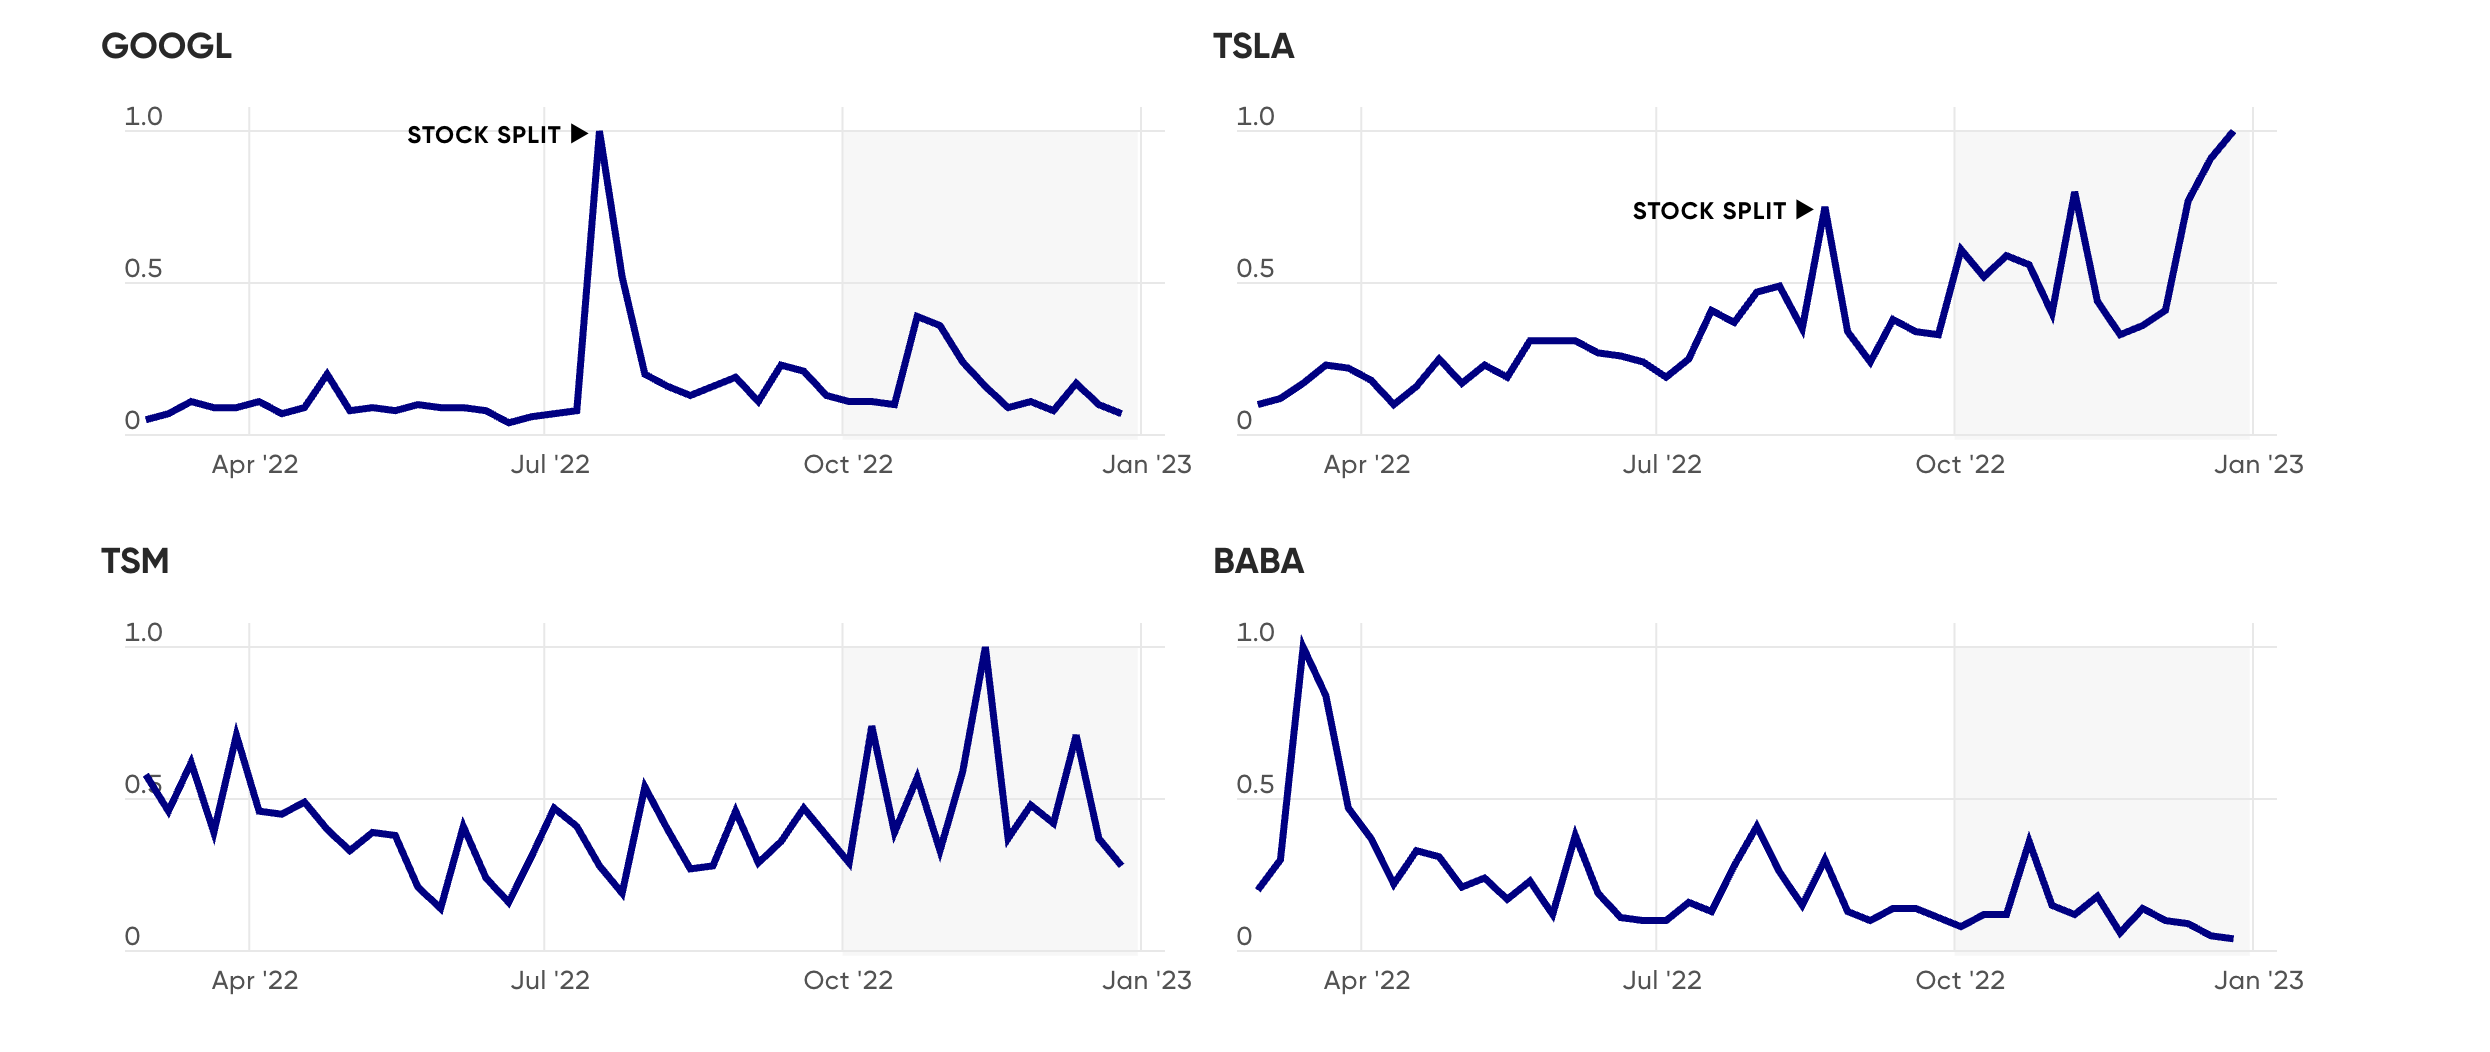
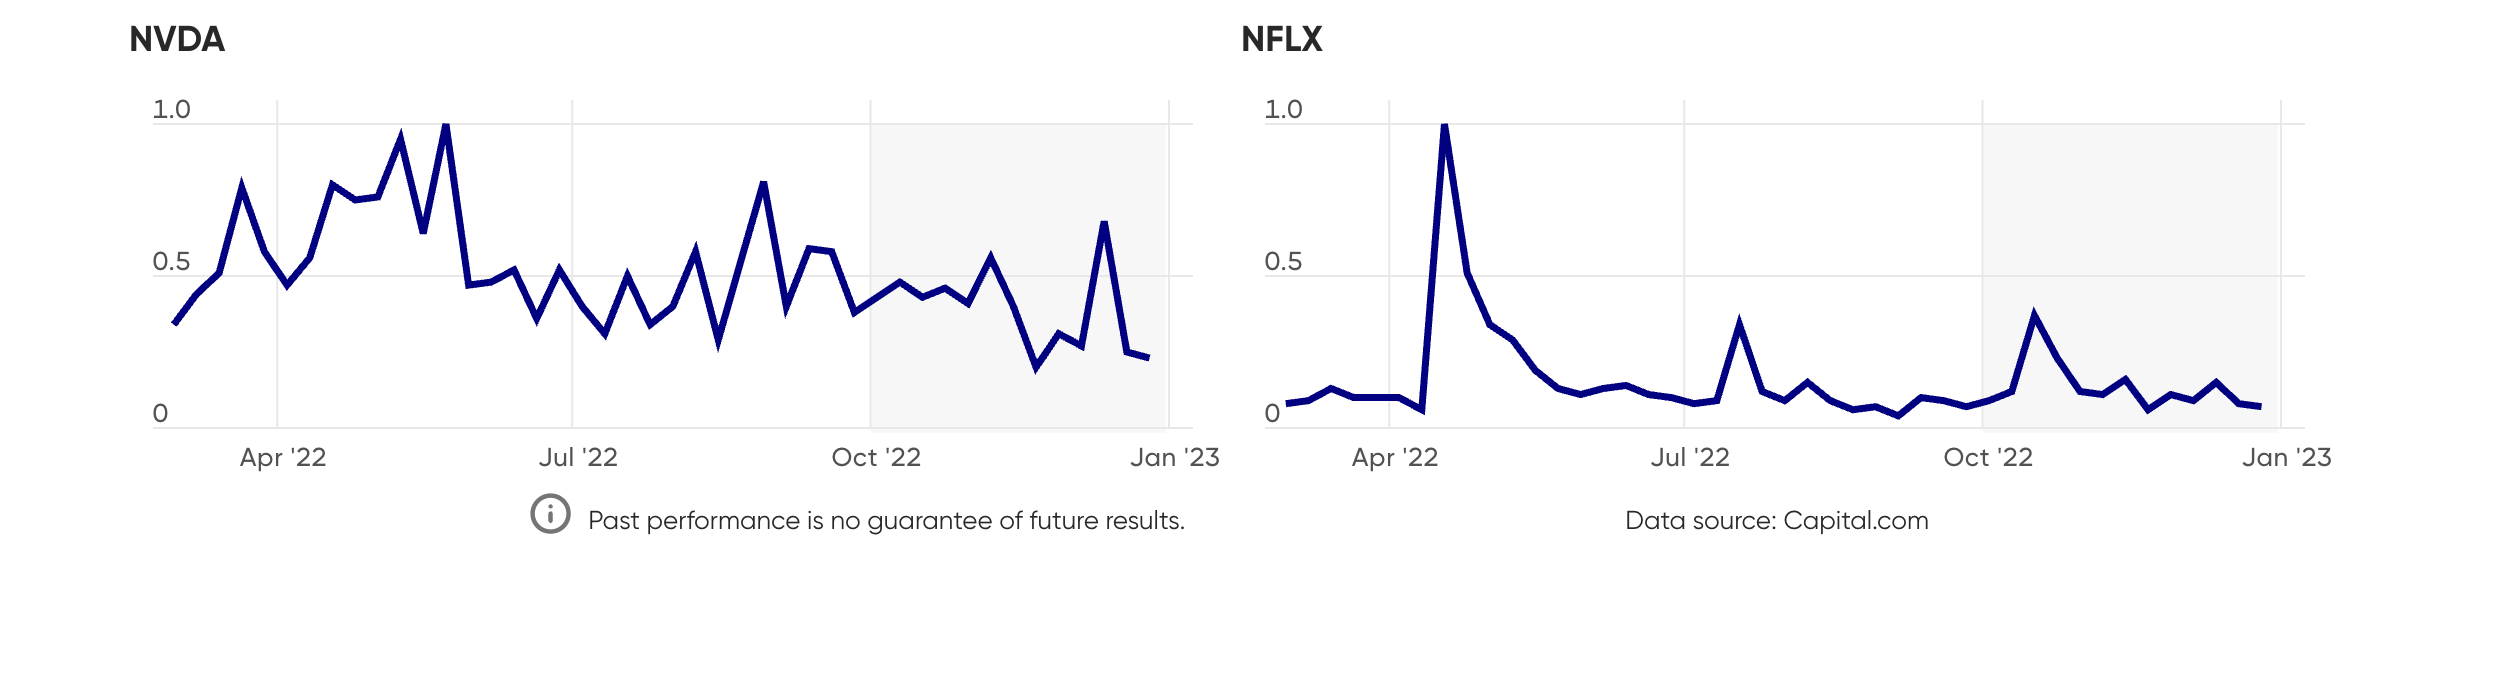
Retail investors looked to buy the dip in tech stocks
For traders seeking high rewards, increased risk in markets is often perceived as good news. It has been a tough year for the US stock market as a whole – the US500 has fallen by about 18%. But big tech appears to have suffered the largest decline – with the tech-heavy US100 down 32% year on year.
Capital.com’s data finds that bigger companies – such as Apple (AAPL), Amazon (AMZN), Meta Platforms (META) and Microsoft (MSFT) – have seen a post-dip rally, clearly showcasing the chase for cheap buys.
This was particularly true for the period after September 2022, when tech stocks achieved the lowest values since the start of the Covid-19 pandemic. During the following month, our site recorded some of the year’s highest trade numbers for these companies.
Smaller influxes also occurred during periods approaching stock splits. Amazon, Alphabet (GOOG) and Tesla (TSLA) shares all underwent a stock split this year, which again coincided with an increase in trading.
Traders chasing tech stocks cheap buys
Weekly number of trades
Interest in CN50 and HK50 rises as China reopening speculation mounts
When China’s strict lockdown policies negatively affected its production, the equity market was unlikely to maintain its confidence in the country’s stocks. The world’s second-largest economy had employed a zero-Covid policy since the beginning of the pandemic, which meant that factories and offices were often shut for weeks if an employee tested positive.
This approach went on to negatively affect national production, consumption and exports, which not only reduced confidence in Chinese companies, but also those dependent on Chinese production.
The market outlook for Chinese companies turned bearish, and remained so for most of 2022. That is until October 2022, when frustration among workers began to spill over in aggressive nationwide protests against the Covid-19 lockdowns. The government then caved and loosened some of its policies.
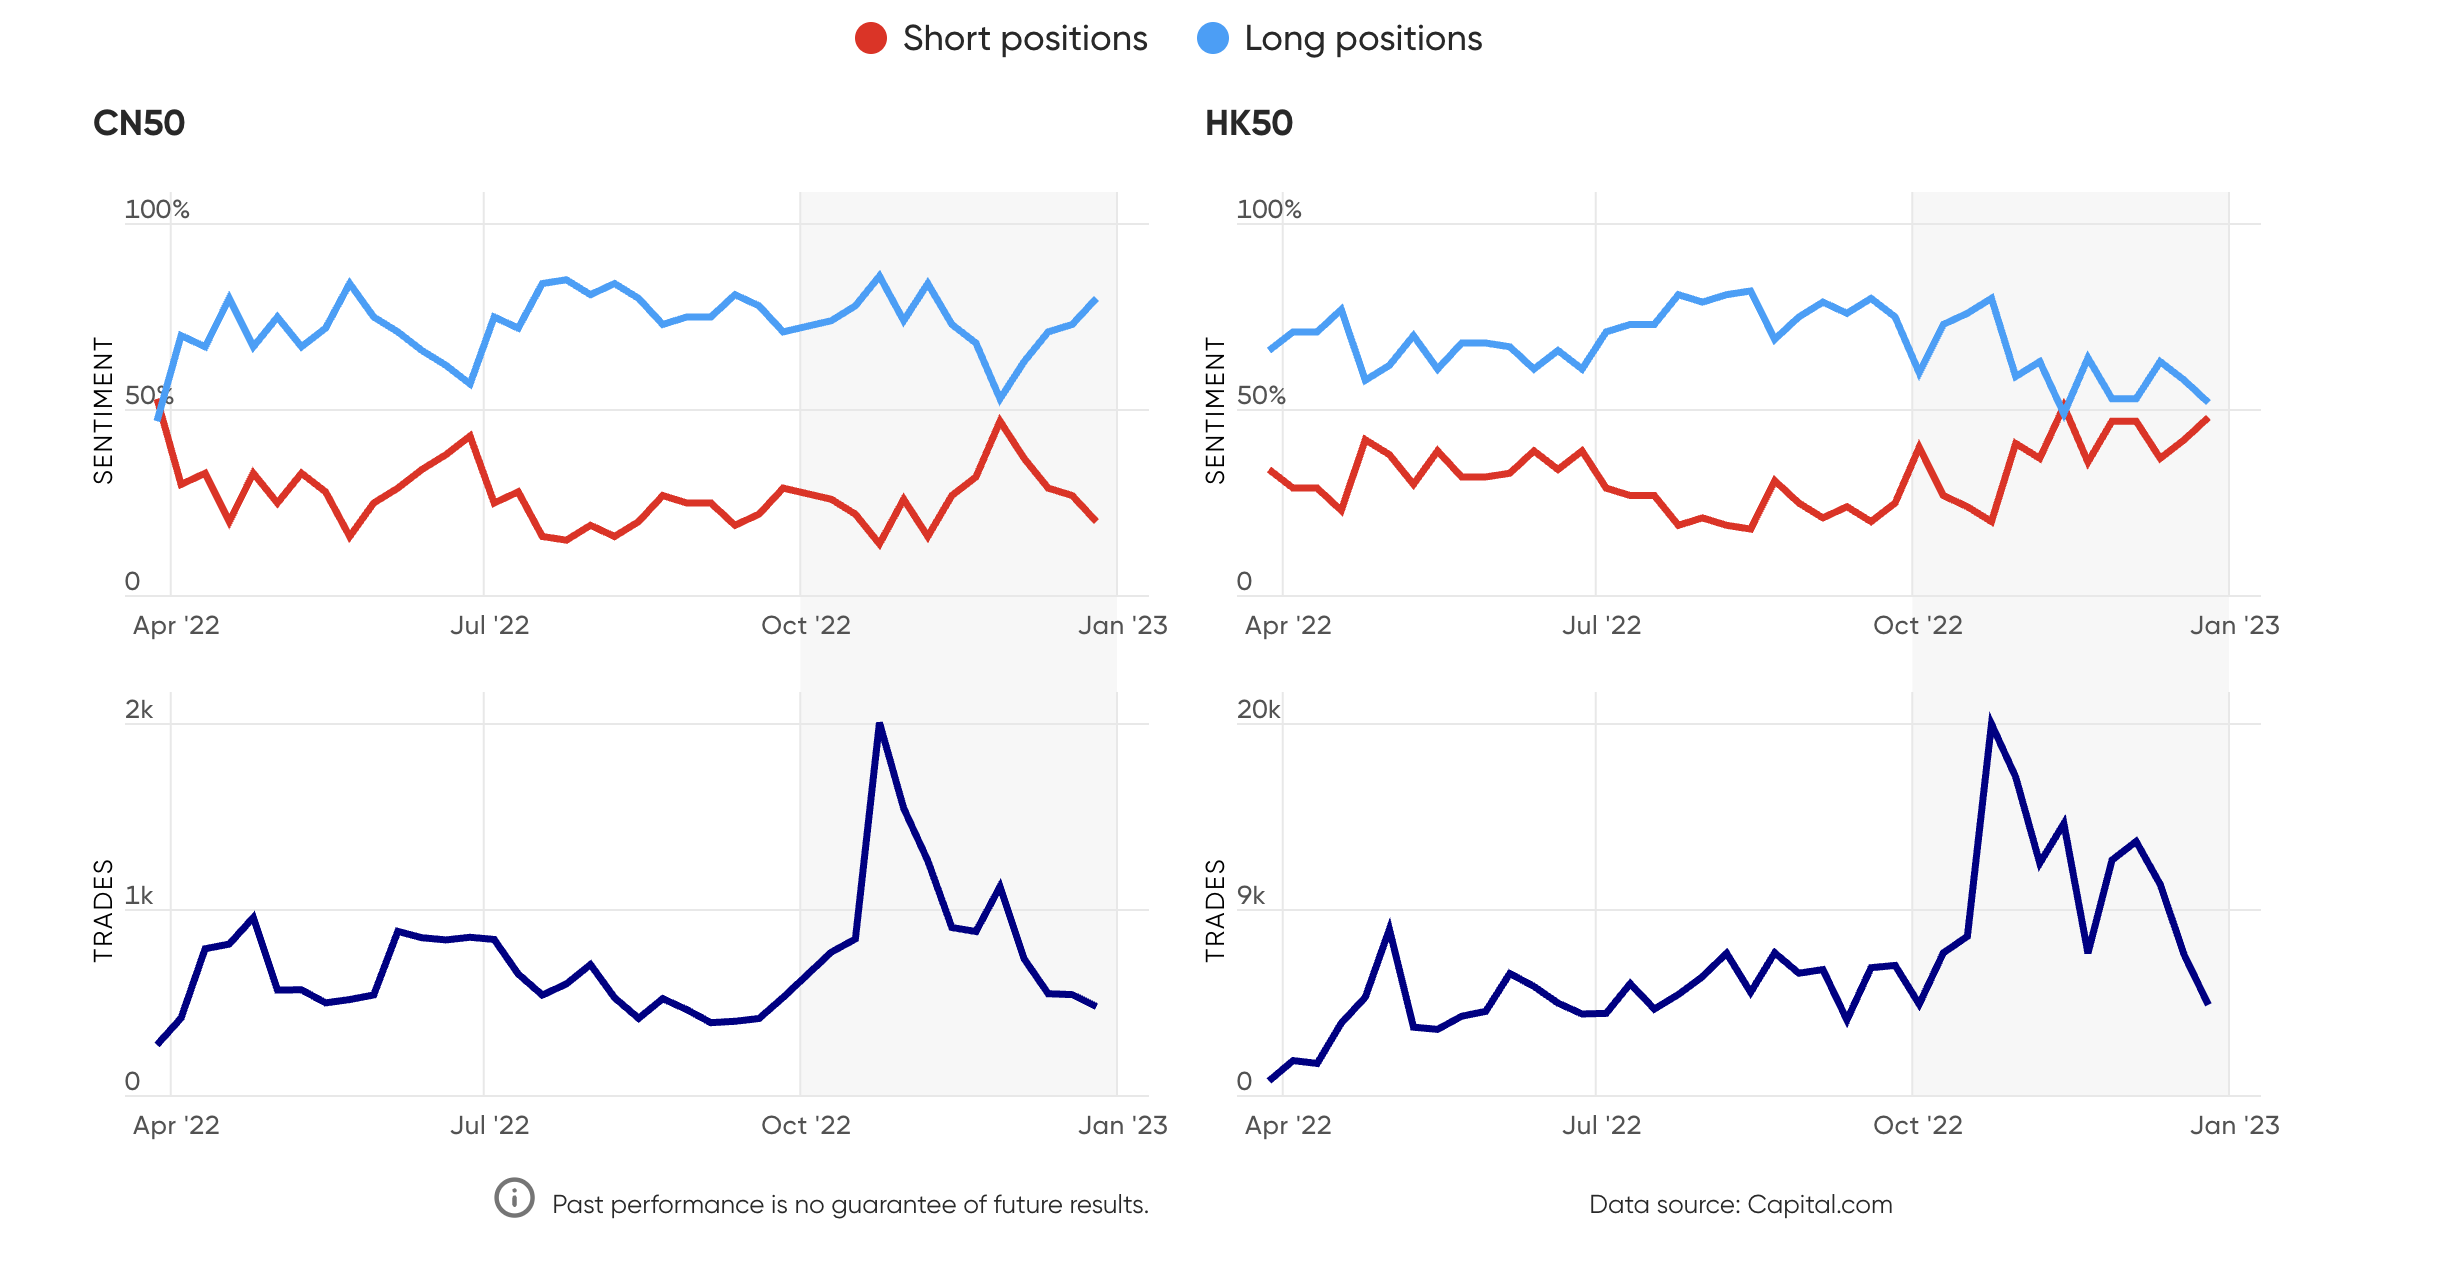
In contrast to what one would have anticipated, our traders appeared to ‘sell on the news’ by boosting the proportion of bearish views towards these assets. The percentage of short positions came close to matching the percentage of long positions on the China A50 (CN50) – and in the Hong Kong 50 (HK50) the two positions actually crossed paths. We are now witnessing a divided attitude in these markets, with a roughly equal share of bullish and bearish views.
Trading on CN50 and HK50 soars on speculation of a reopening
Percentage of long and short positions vs total number of trades
Trade length and number of trades reflect tough Q4 conditions
The average duration of trades on Capital.com remained low during the fourth quarter, across commodity, forex and index markets. In cryptocurrency, however, traders taking long positions appeared to be maintaining the ‘HODL’ strategy, even as the market crumbled from the record highs seen in November 2021.
The average position length, after rising from around 85 hours in Q1 to around 170 hours in Q2, fell to 110 hours in the third quarter, as the market leader bitcoin halved in value to around $24,000. During the fourth quarter – as bitcoin settled around the $16,000 level – the average length of trades rocketed to around 250 hours, suggesting traders were expecting an end-of-year crypto ‘Santa rally’.
Simultaneously, the average length of short positions rose throughout the year. In Q1, short trades were around four hours on average, but by the end of 2022 they had risen to 22 hours.
Only equity trades showed similar levels of trading length, peaking at 210 hours in the third quarter before falling to 150 hours in Q4. They also showed the highest lengths for short trades, rising to 40 hours in the third quarter and ending the year at around 32 hours.
Cryptocurrency traders are HODL-ing
Average hourly trade duration by market and position
Equities and indices
Stock markets were difficult to forecast. Many economies were facing recession, and with corporate profitability on the decline, the US500 hit its lowest mark of the year in October. However, as US inflation began to dip, hopes of an early end to the Fed’s rate-hike cycle underpinned a rally from mid-October into early December, which faded towards the end of the month.
Commodities
Metals and energy markets were hit by conflicting events that made for unpredictable trading. The China-metals-demand outlook improved as Beijing announced an easing of its harsh Covid-19 restrictions. But a devastating winter wave of infections could yet damage demand – even after the abandonment of the zero-Covid policy in December. Oil and gas prices were also volatile, as Western economies managed to cut usage in the face of falling supply from Russia.
Forex
The long-dollar bet that drove currency-market trading during the first nine months faded as US inflation began to dip from its highs. Trade volume in the forex market on Capital.com saw only a flattening in Q4, where volume in other markets fell more precipitously.
Cryptocurrency
Crypto trade volume halved from third-quarter levels as market volatility intensified, with sentiment undermined by news of the collapse of the FTX cryptocurrency exchange.
Risk management: Stop-loss orders at record high
Perhaps an indication of the more volatile trading conditions facing our traders in Q4 was the increased use of stop-loss orders when entering a trading position.
By using this function on Capital.com, traders can limit their losses if a trade goes the wrong way for them – which is something we have made a concerted effort to bring to the attention of our traders with educational guides and videos.
Piero Cingari, market specialist at Capital.com, said:
Cingari added:
Percentage of trades with stop-loss orders reaches new levels
Percentage of orders with stop-loss orders
Traders turn to CRO, SOL and DOGE cryptos in wake of FTX collapse
For cryptocurrency, 2022 was a chaotic year to say the least. In May, the Luna network fell apart when its TerraUSD (UST) stablecoin lost its peg with the US dollar and wiped billions off the global market value. Investor confidence in crypto was rocked further following the demise of Three Arrows Capital (3AC), Voyager Digital, Celsius Network and BlockFi.
Then in Q4 2022, accusations surrounding the FTX exchange and its CEO Sam Bankman-Fried surfaced. In early November, a leaked balance sheet showed sister company Alameda Research, a crypto trading firm, was being propped up by FTX’s FTT token. Anxiety soon spread. In spite of Bankman-Fried’s assertions on 7 November that “FTX is fine, assets are fine,” plans by crypto exchange Binance to acquire FTX were dropped two days later.
On 11 November, FTX – once valued at $32bn – began Chapter 11 bankruptcy proceedings along with Alameda Research and 130 other companies. With a reported $1.8bn worth of investor money under question, Bankman-Fried resigned as CEO the same day. He was arrested in the Bahamas on 12 December and later charged by the US Securities and Exchange Commission with wire fraud, securities fraud, money laundering and campaign finance violations.
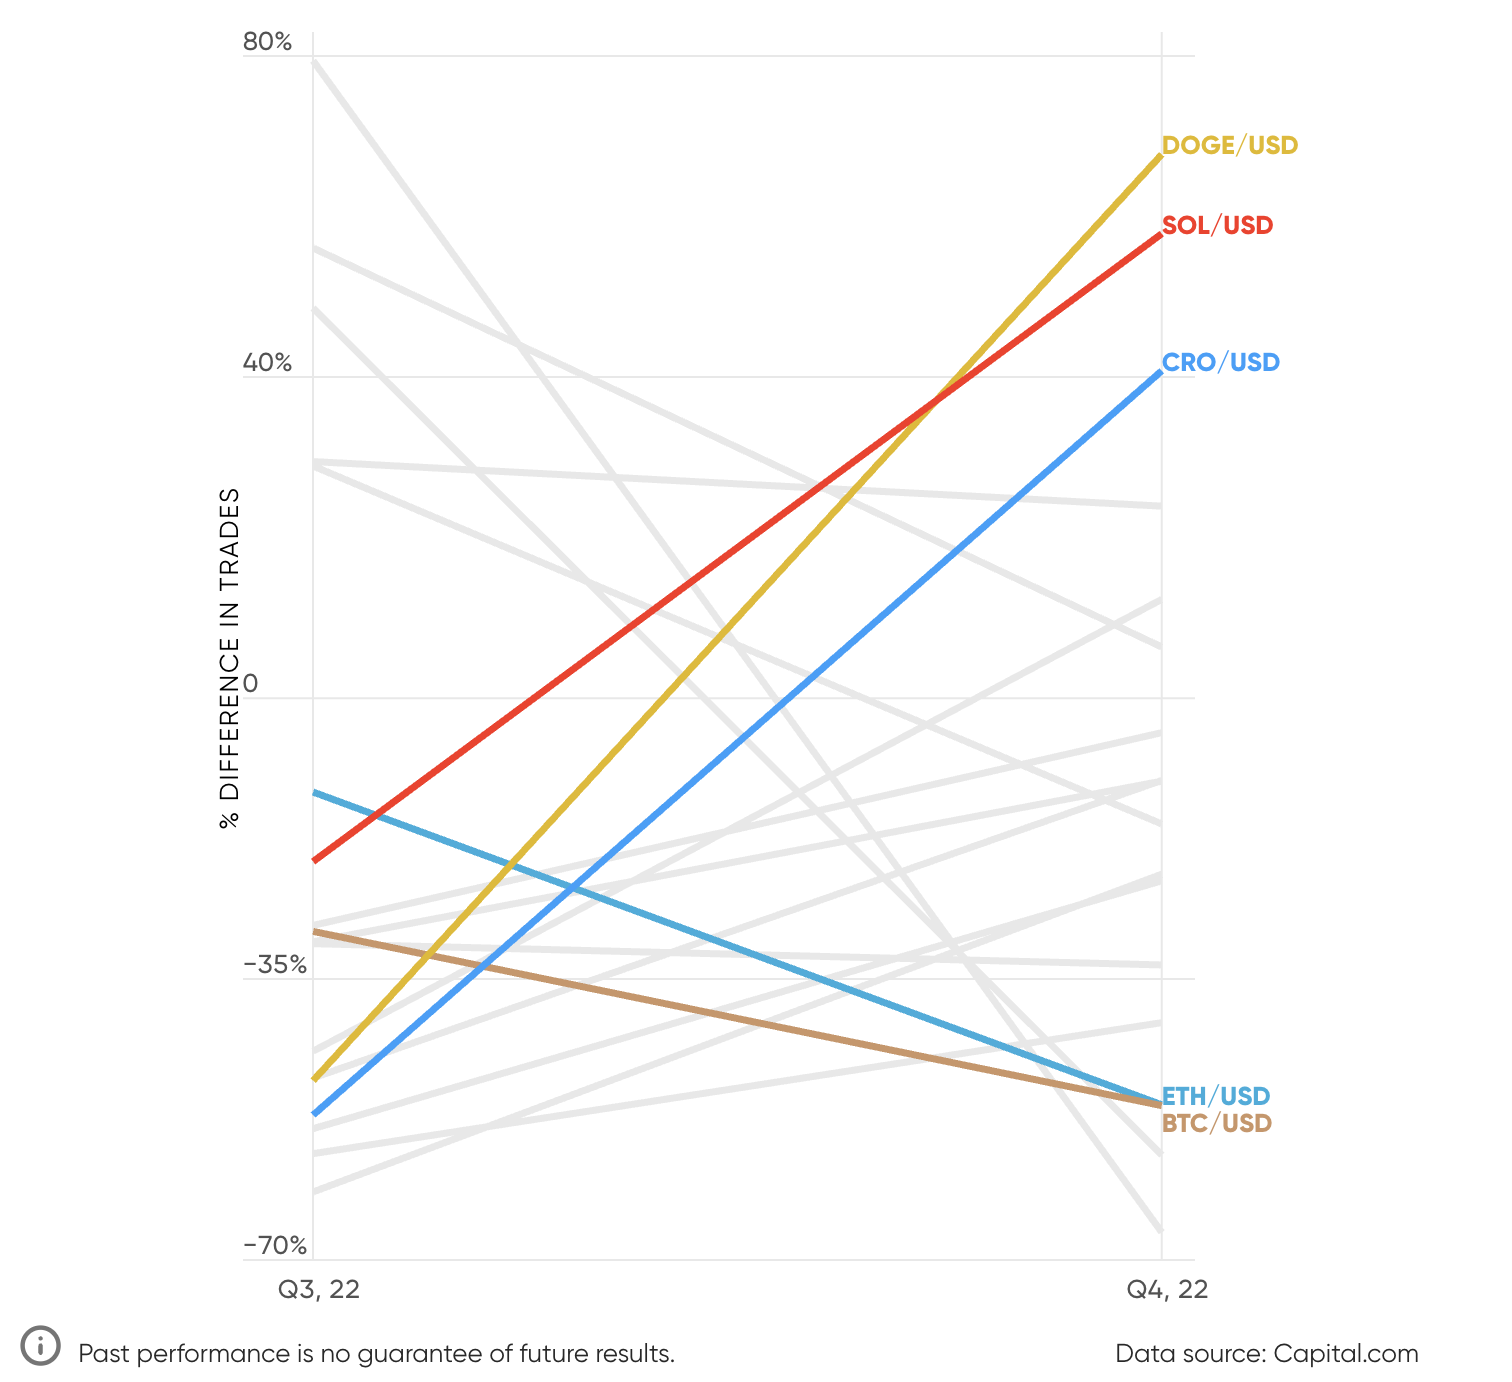
So how did all this affect our most-traded coins in Q4? From our top 20 list this quarter (see chart below), only cronos (CRO), solana (SOL), and dogecoin (DOGE) saw an uptick in interested new traders. There are several potential reasons for this.
CRO
After the fall of FTX, contagion fears spread to other crypto exchanges. Crypto.com’s cronos coin fell by 54% between 7-14 November. As of 20 December, CRO was trading at $0.05657 – 94.19% down from its all-time high of $0.9698 on 24 November 2021.
SOL
Solana is tied to FTX to the tune of $982m in SOL. The Sam Bankman-Fried favourite was also Alameda’s second-largest holding. On 6 November the price of SOL was $36.51, and by 10 November it had fallen to $13.49. As of 20 December, it was trading at $12.16.
DOGE
Dogecoin remains entrepreneur Elon Musk’s crypto of choice and the DOGE price hinges on his every word. In October, his takeover of Twitter led to a rally of more than 60% for the meme coin. However, a recent Twitter poll by Musk asking if he should step down as CEO resulted in users voting 57.5% in favour of yes. As of 20 December, DOGE was trading at $0.07385.
Confidence in the cryptocurrency market shakes
Quarterly trades percentage difference of top 20 most-traded assets
Conclusion
Data from the fourth quarter of 2022 offers some key insights into the behaviour of Capital.com’s global retail traders during a period of exceptional upheaval.
High inflation, rising interest rates and treacherous periods of volatility have defined this quarter – all of which have made for extremely difficult trading conditions. While oil and natural gas were still two of the three most traded instruments on our platform during this period, the US100 rose to the top of this scale as traders looked to buy the dip among the underperforming tech stocks.
Meanwhile, in a torrid year for cryptocurrencies that culminated in the demise of Sam Bankman-Fried’s FTX exchange, the biggest losses in profitability were seen in this asset class. Only a limited number of cryptos (CRO, SOL and DOGE) attracted new trader interest.
Once again, adaptability proved to be an important trader characteristic, as investors sought to modify their positions in response to increased volatility – whether that was switching from net-long positions to net-short positions when it came to GBP/USD trades or their increased use of stop-loss orders to minimise the impact of losses on trades.
The first-quarter edition of this report for 2023 will show whether these are enduring trends or comparatively short term ones.