Retail-investor quarterly trading trends
Analysis of Q2, 2022 trading data from Capital.com.
“Retail investing has become an increasingly important phenomenon across the global financial markets in recent times, as digital platforms have lowered barriers to entry. It is now easier than ever before for ordinary people to trade the markets and act on their own insights and analysis.
The meme-stock phenomenon of 2021 has shown that even the biggest and best-funded institutional investors need to keep themselves informed on trends and thinking among retail investors. Today, the world is in turmoil as the consequences of the war in Ukraine continue to unfold, the aftermath of the pandemic plays out and inflationary shocks strike economies around the world. Traders are changing their behaviour in response.
At Capital.com, we have an unrivalled database covering the behaviour of the world’s fastest-growing investor class.
This Capital Pulse quarterly report is based on proprietary data drawn from our sector-leading trading platform. I believe it offers a valuable resource for financial professionals, analysts, journalists and indeed anyone seeking an insight into what the trends are among our huge global community of retail investors.
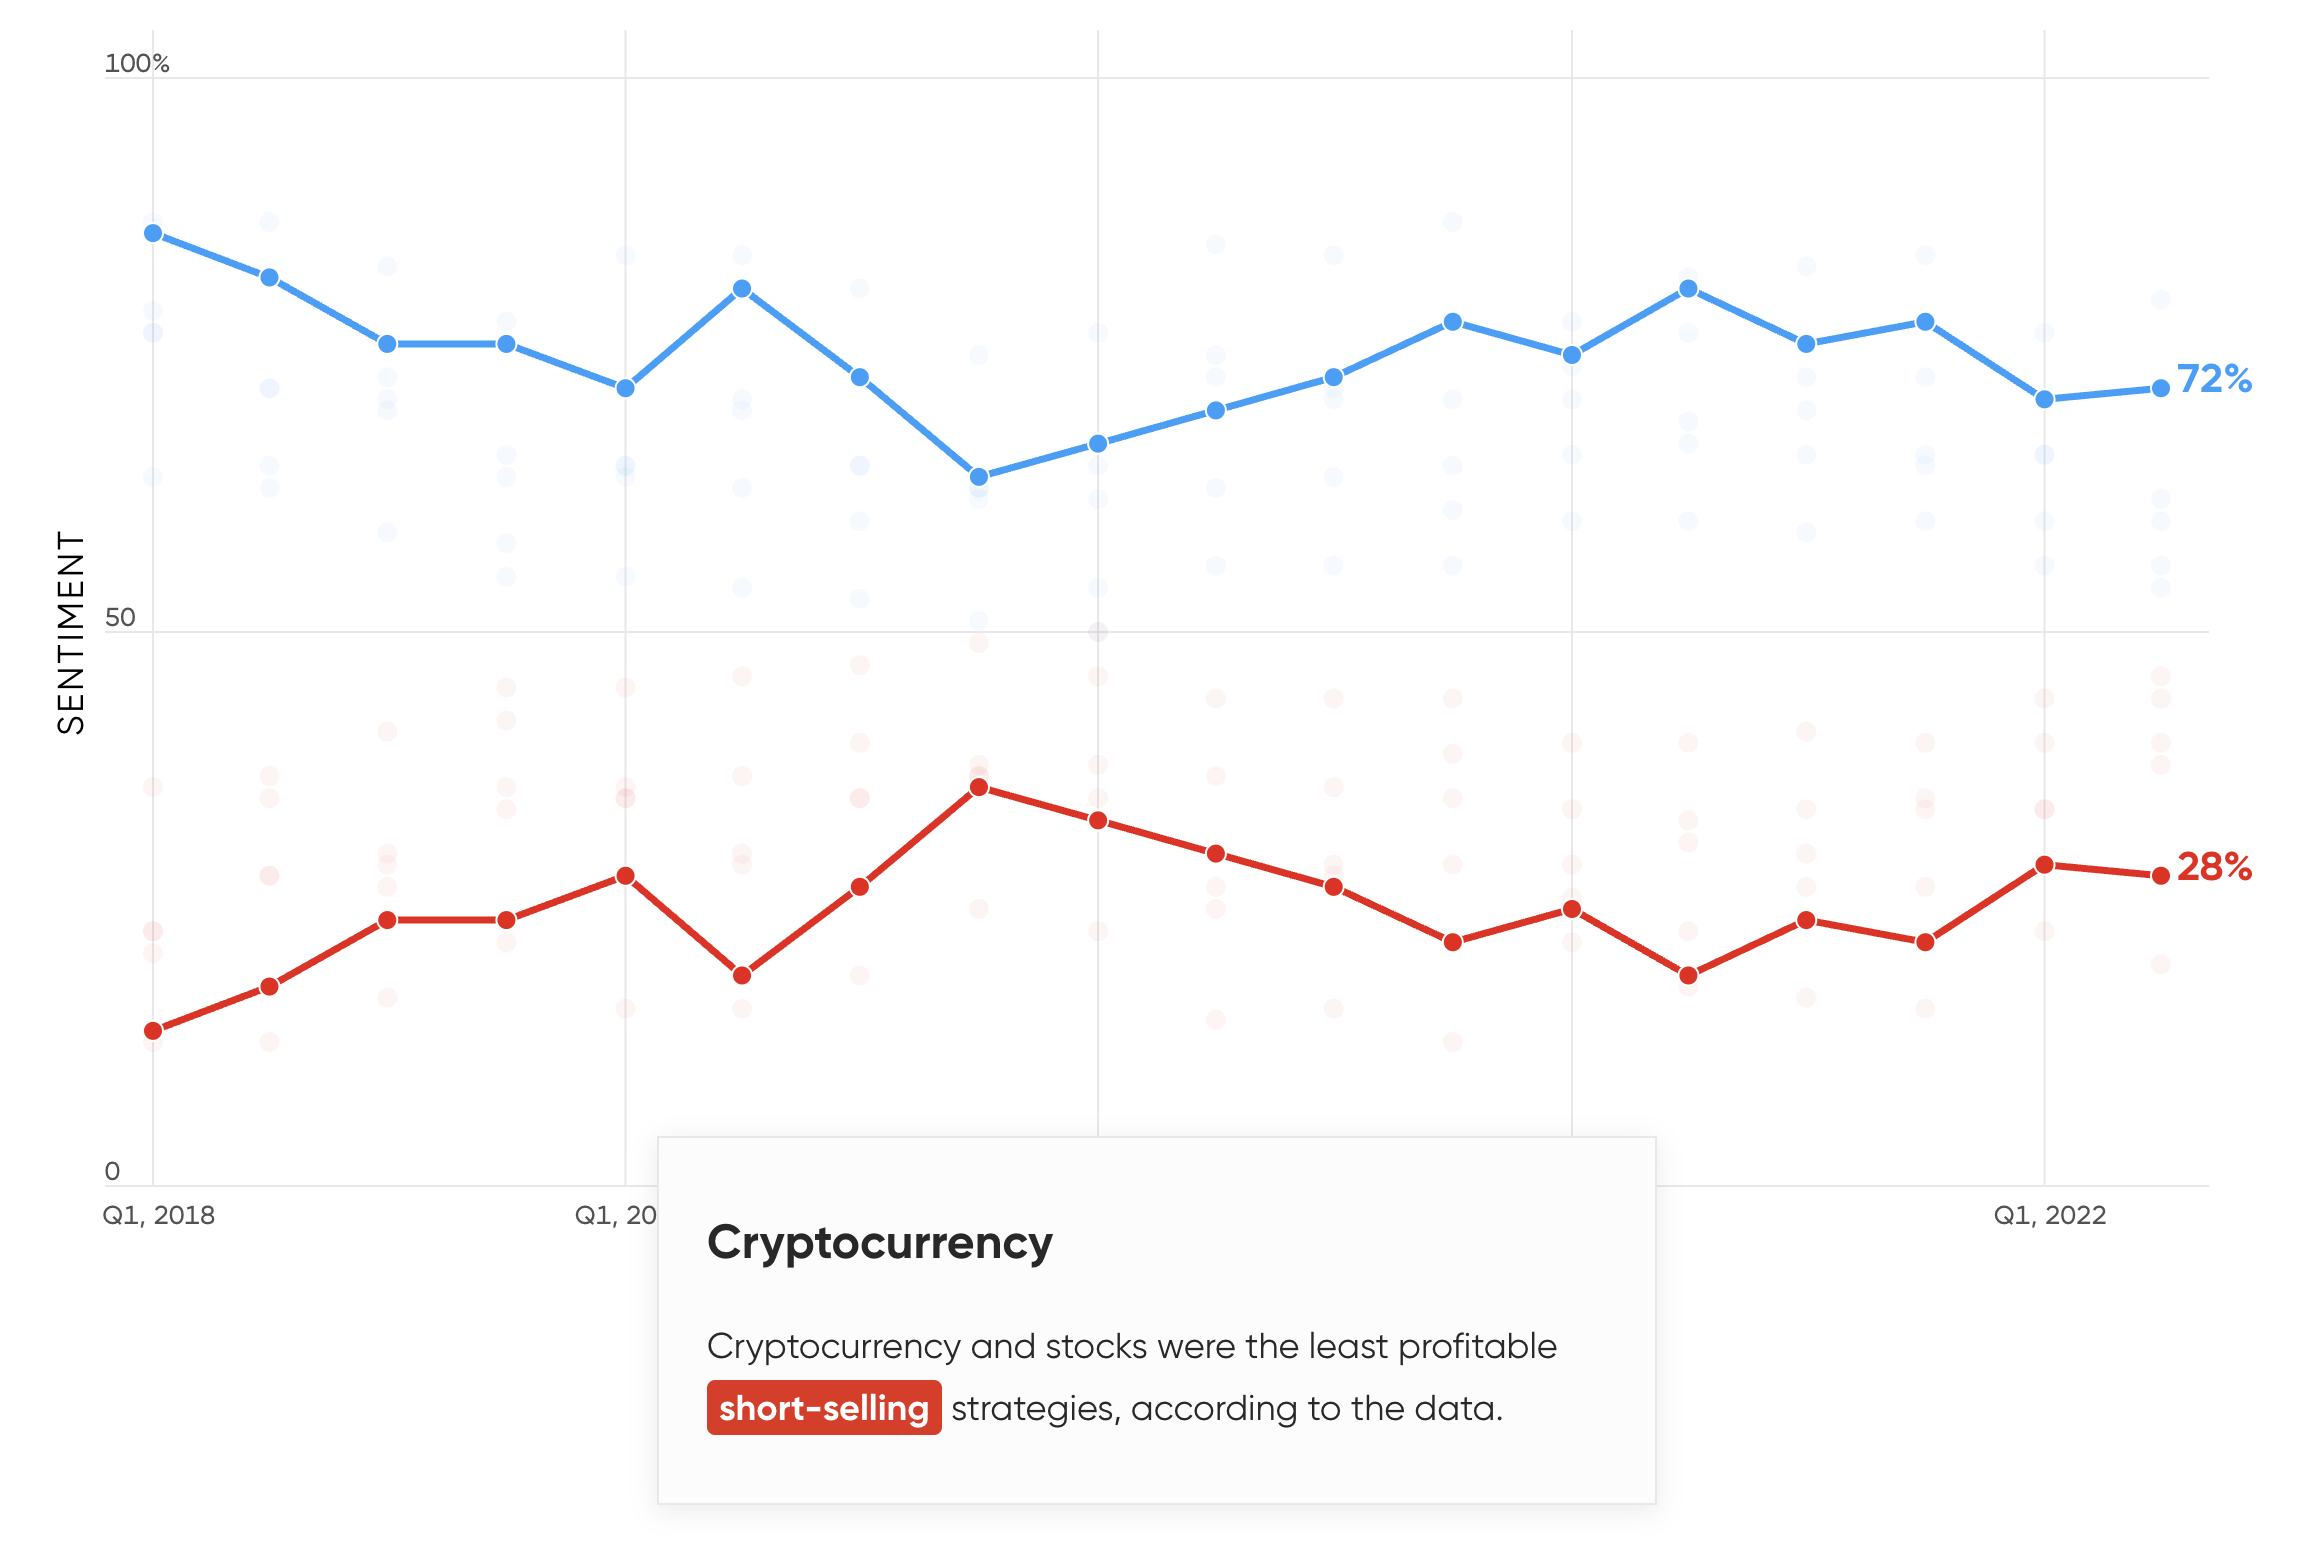
The main theme emerging from the data this quarter has been a rise in the popularity of short positions among Capital.com traders. Most investors and traders are hardwired to "go long" when it comes to markets: buy first and look to sell hopefully higher and make a profit. Although retail traders have the ability to "short-sell" (taking profit from falling markets), historically it is not something that many have done. The sharp rise in clients short-selling over the current quarter demonstrates just how significant the drop in many markets has been, forcing many retail traders to change their mindset.
Readers who would like more information about Capital.com and our traders should visit our website’s Media Centre.”
Peter Hetherington
CEO, Capital.com
Across the markets
The Capital.com platform permits investors to trade more than 6,100 different instruments across many different markets: stocks and shares, exchange-traded funds, currencies, cryptocurrencies, commodities and indices. Capital.com has group entities located in the UK, Cyprus and Australia that are authorised and regulated by the Financial Conduct Authority, the Cyprus Securities and Exchange Commission and the Australian Securities and Investments Commission respectively.
Traders around the world
More than three million people have applied for an account with the Capital.com group.
Some 13% of traders are female, though this proportion varies considerably with location.
In 2021, the Capital.com group reported trading volumes in excess of $560bn.
The UK is the number one country on Capital.com by number of trades, which is up by 18% since Q1. The number one country by volume of trade is the United Arab Emirates, beating the UK which was number one for volume in Q1.
Highlights from this report
Selected key insights drawn from the trading data in Q2 2022:
- Short positions became increasingly popular on Capital.com in Q2, and were more profitable for traders. The highest proportion of short trades was seen in the UK, Africa and Asia (41%). The lowest proportion of short trades was seen in Australia (34%), though this was increased from Q1. Forex was the most heavily shorted market.
- The mass influx of traders into crude oil seen in Q1 was followed by an almost equally rapid exodus in Q2. Natural gas, which also saw a large Q1 influx, remained popular.
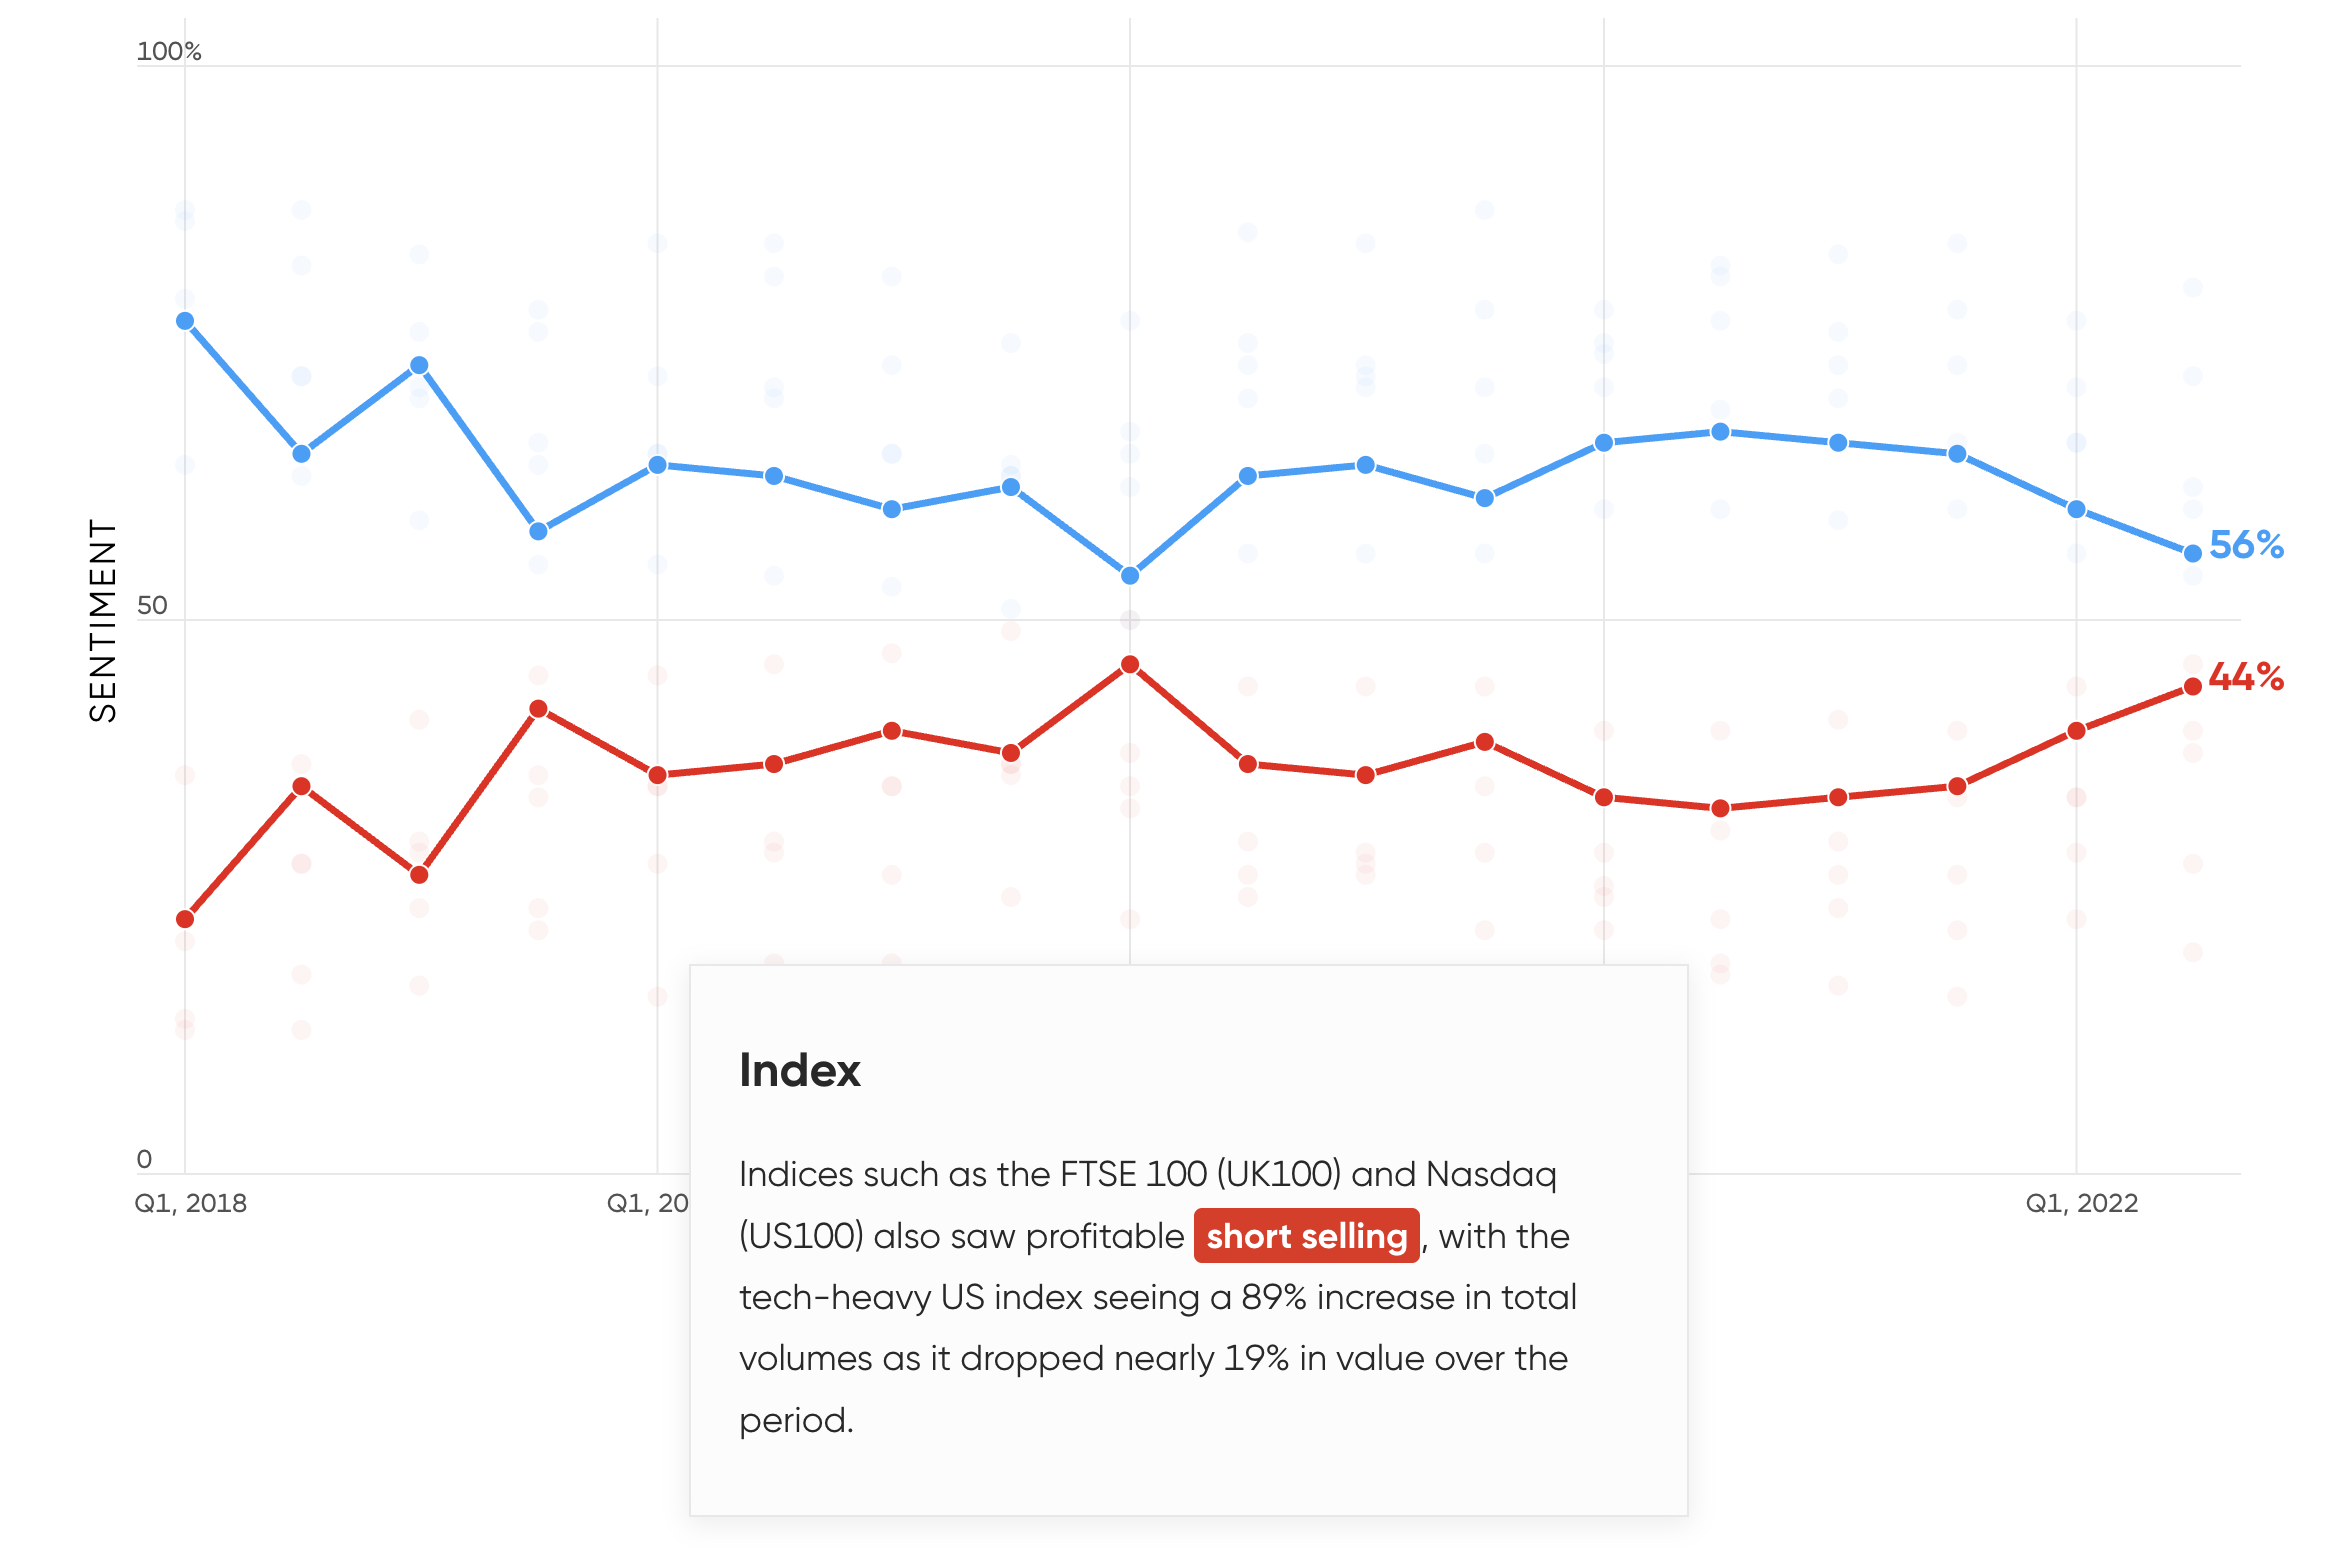
- The Nasdaq 100 index was the most traded asset for the second quarter, with traders shifting increasingly towards short positions, looking to profit from a falling market.
- The Amazon (AMZN) CFD was hugely popular with traders during Q2. The company’s stock split on 6 June saw a 1302% increase in traders and it was the only tech stock to see an increase in long positions, up by 110%. However, short positions in AMZN were more profitable than long ones.
Capital.com chief analyst David Jones comments:
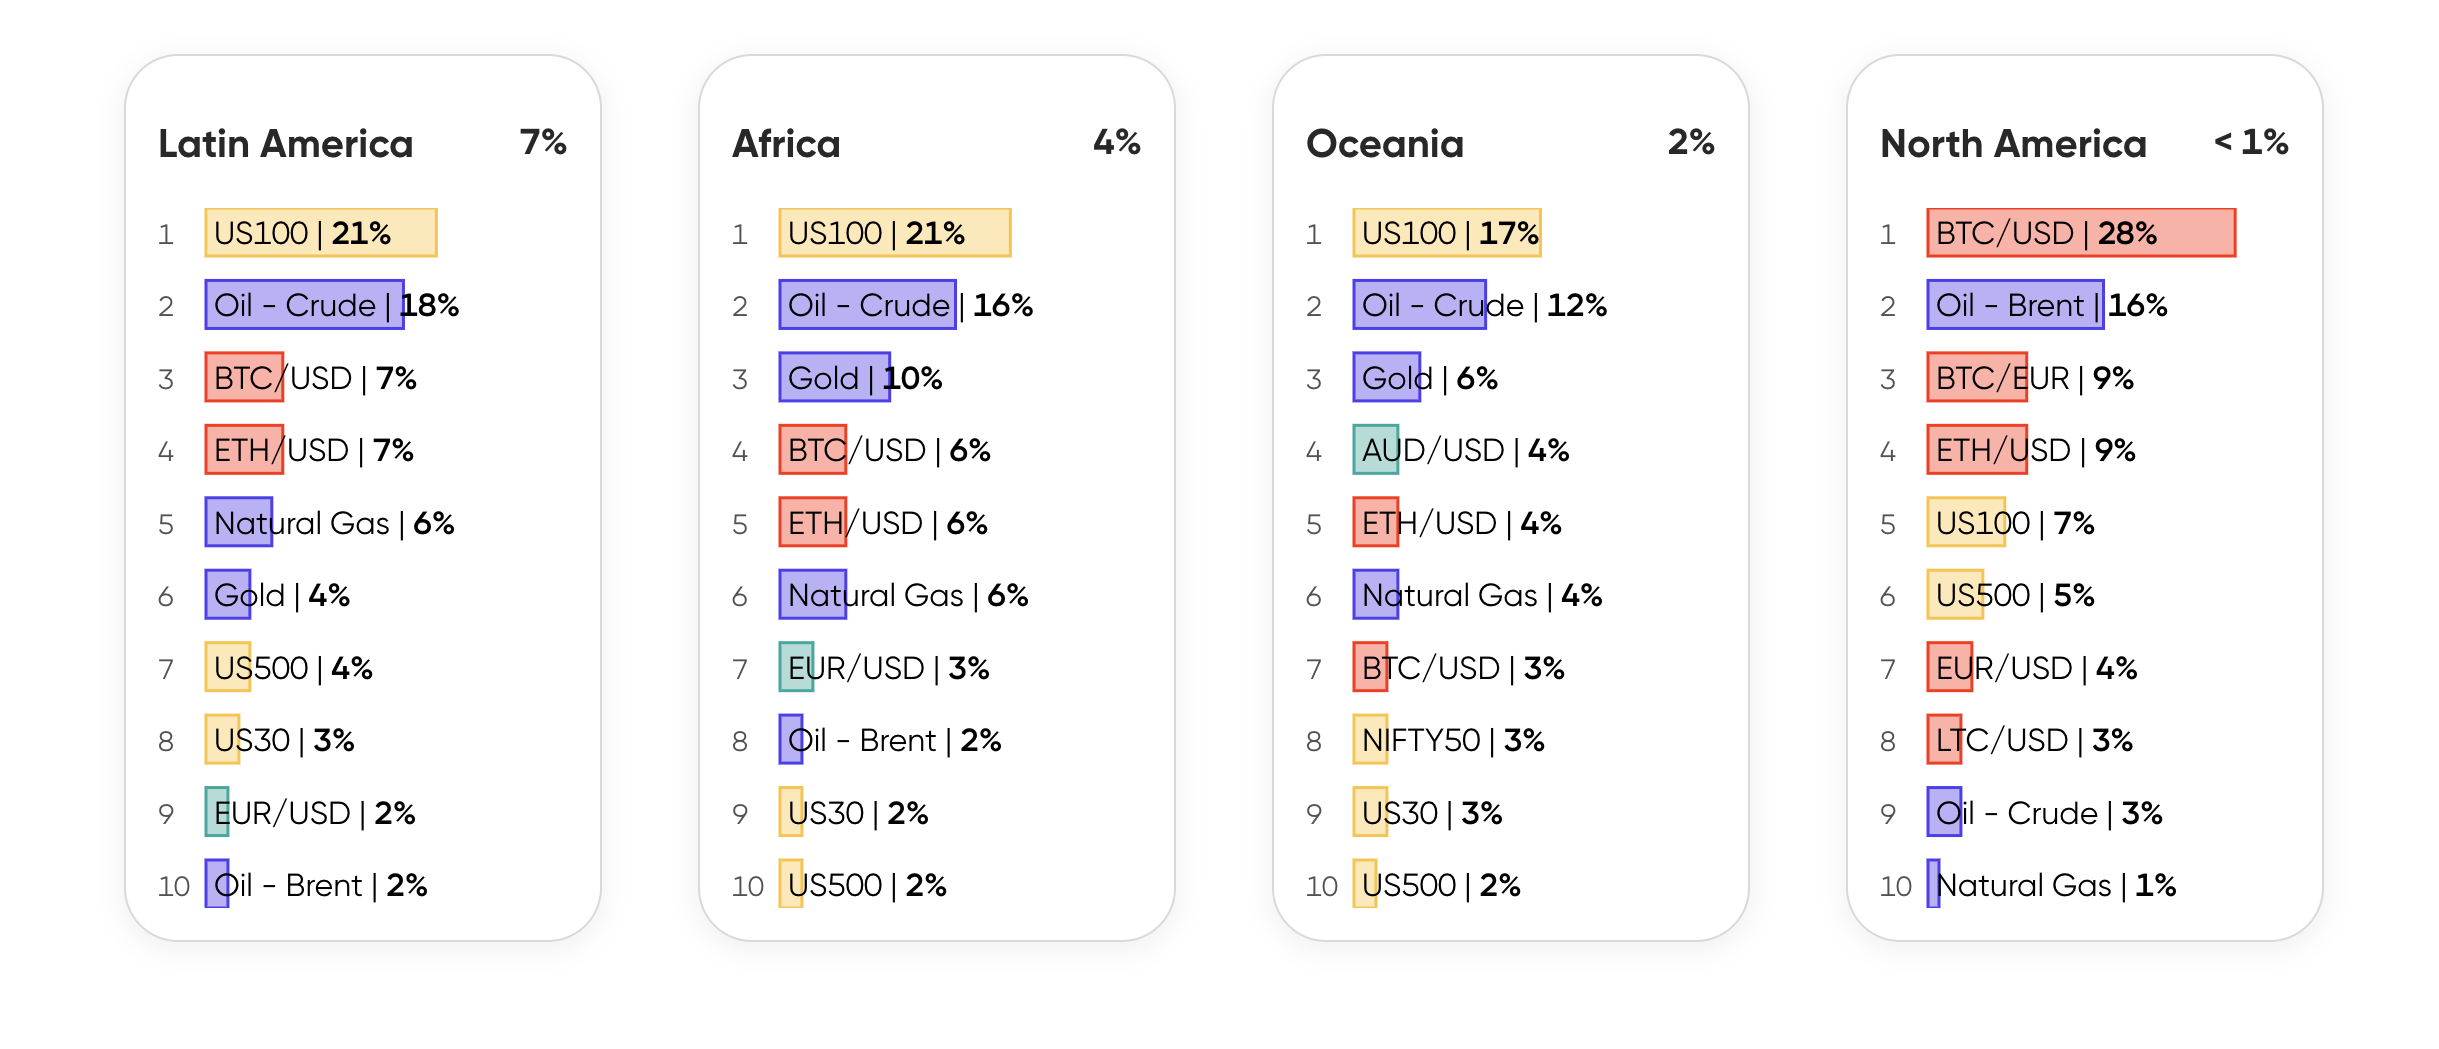
The Nasdaq 100 (US100) index is the most popular instrument in 5 regions
Top 10 most popular instrument rank by number of trades in Q2, 2022.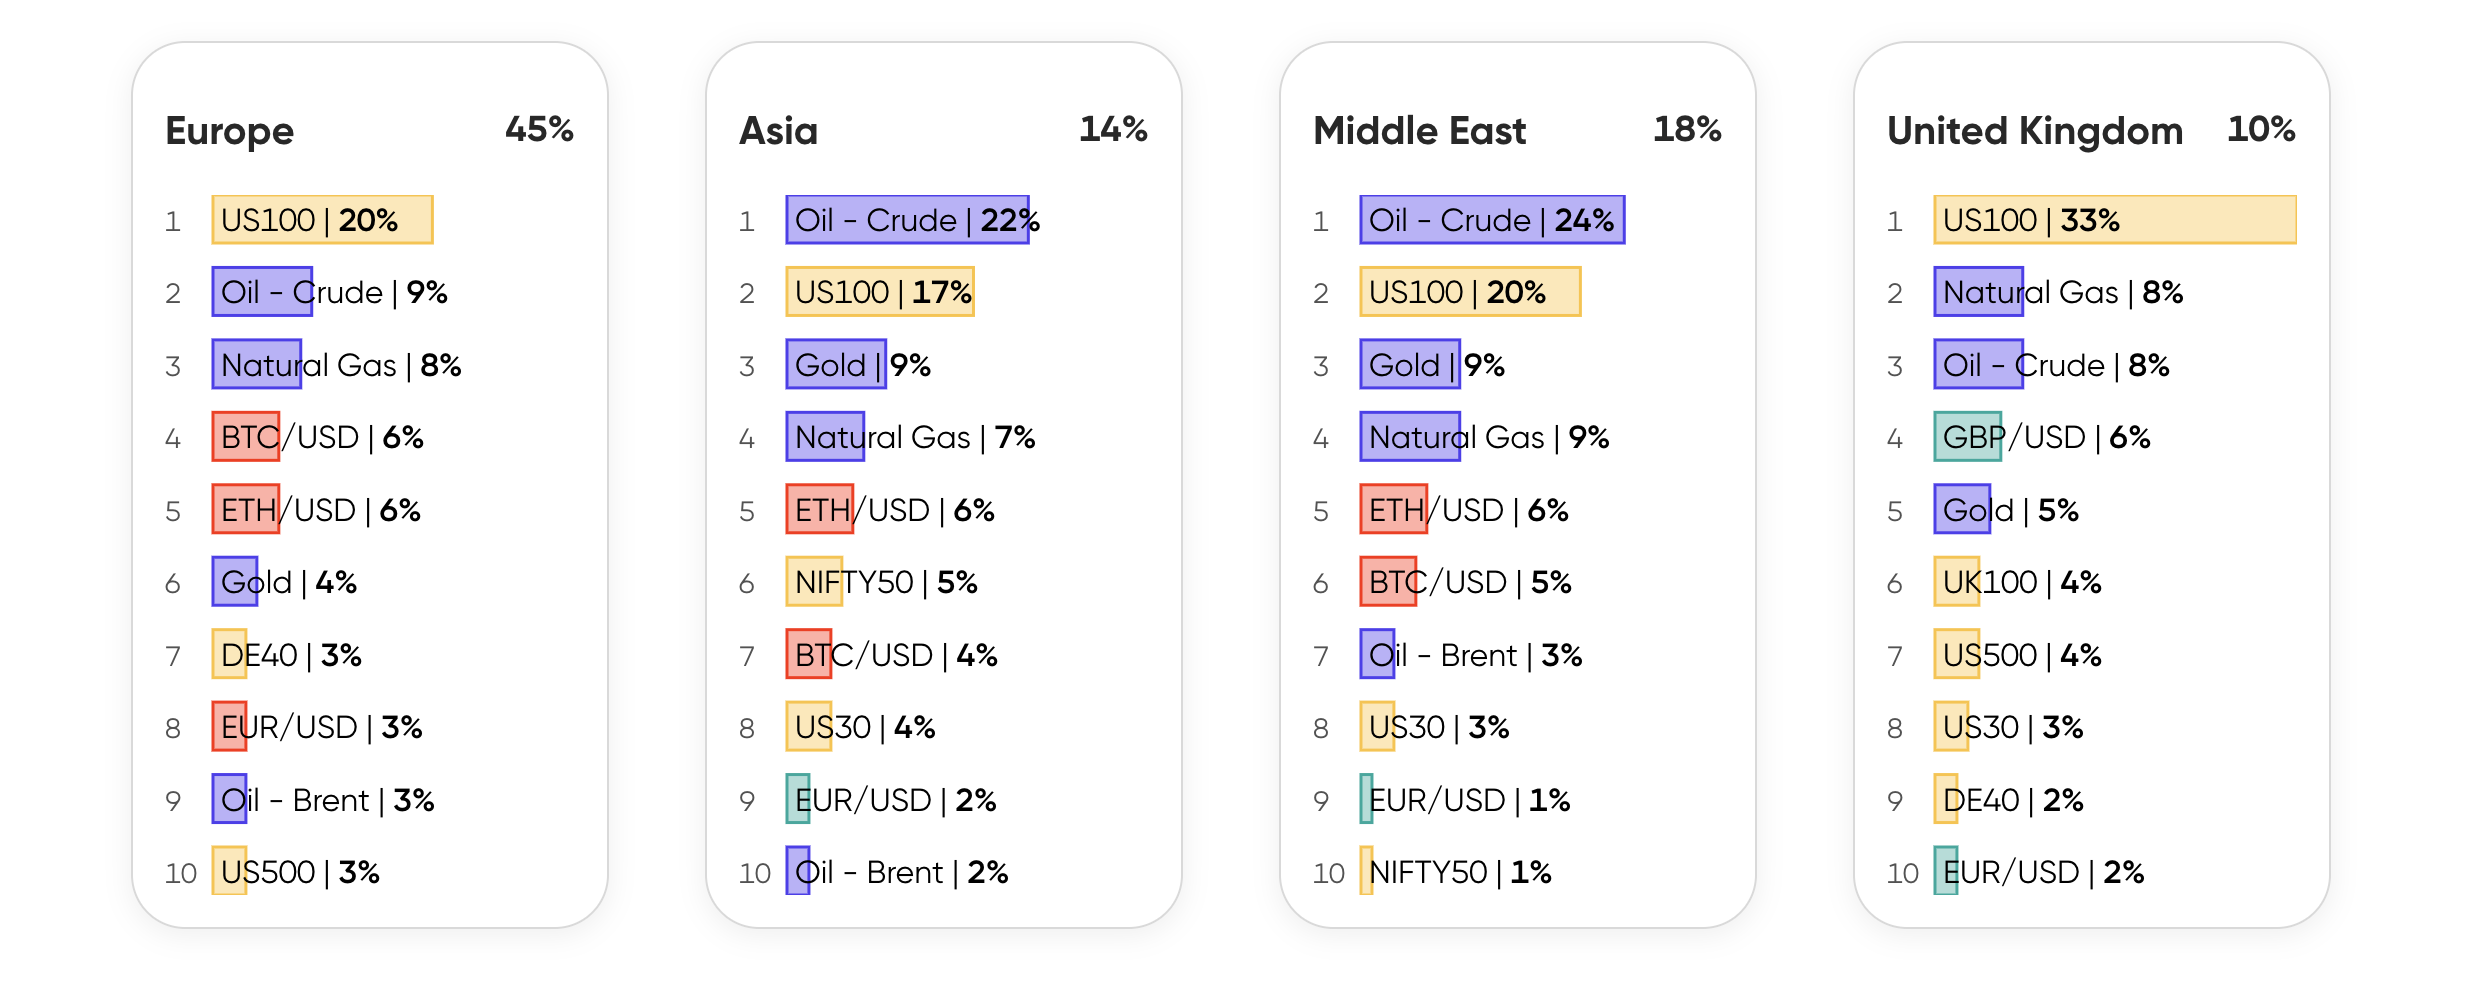
Shorting increased
Short selling became a popular feature of trading on Capital.com in the second quarter as many asset prices came under pressure following central bank moves to raise interest rates in the face of soaring inflation.
Shorting strategies enable traders to try and profit from falling asset prices. And on CFD platforms such as Capital.com the process is much simpler than short selling through a traditional brokerage.
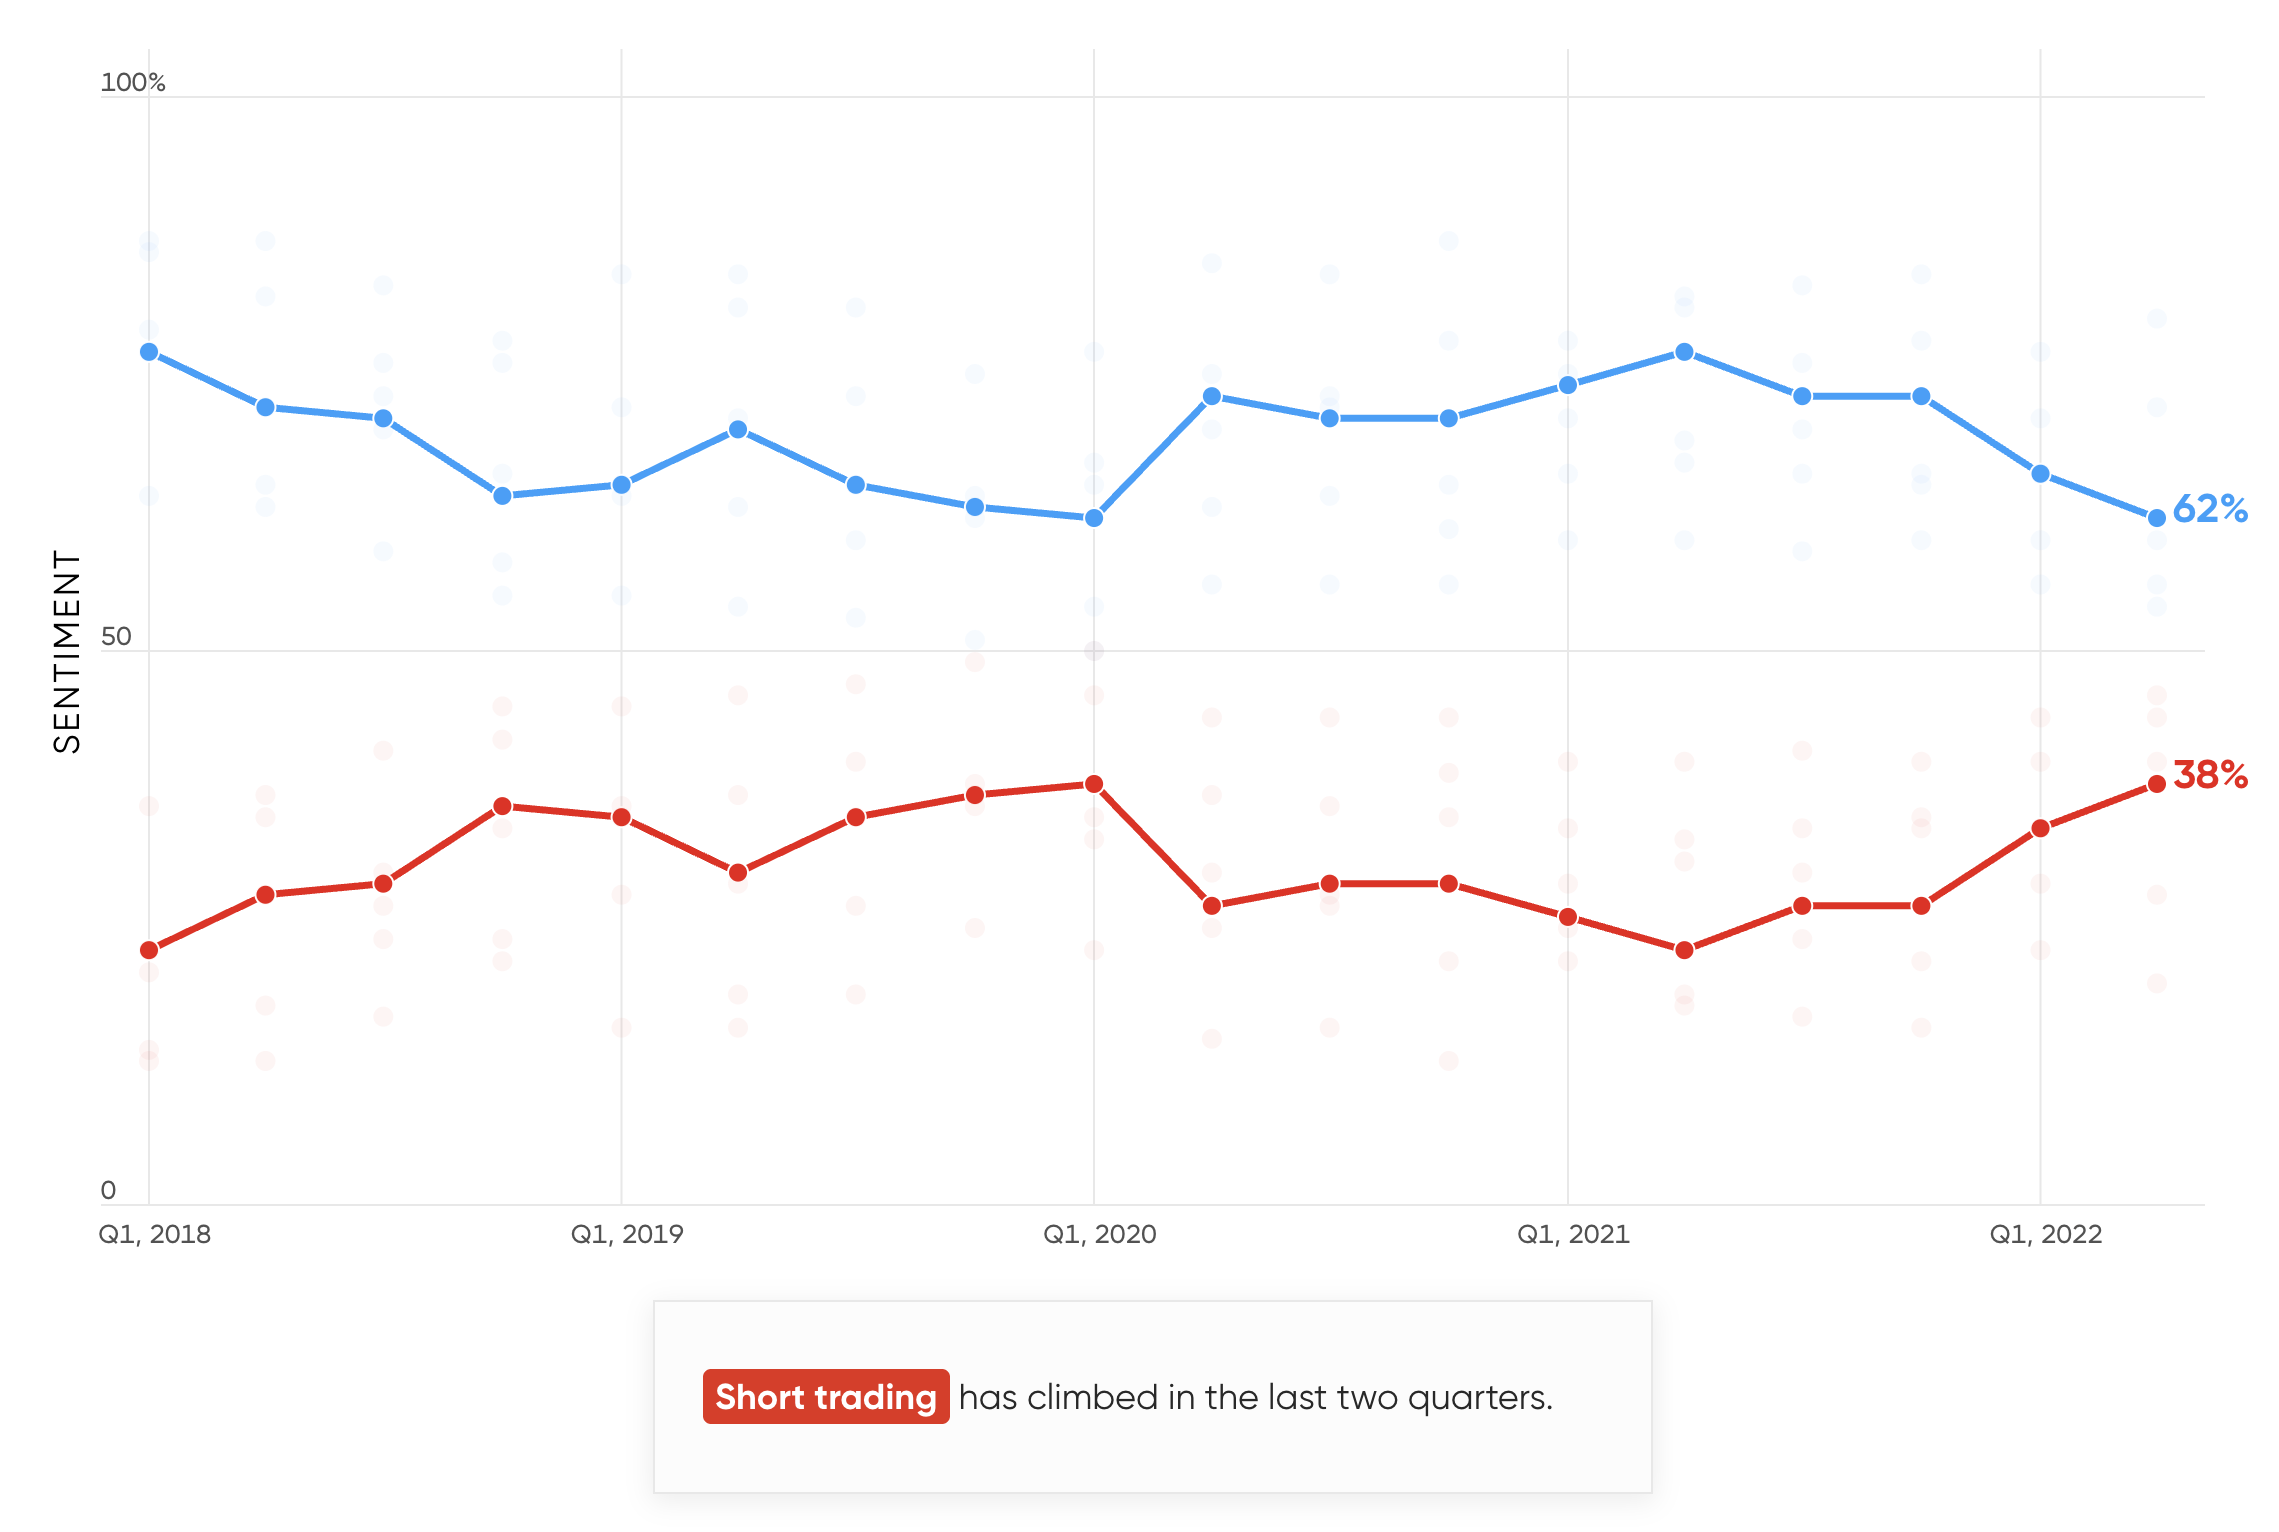
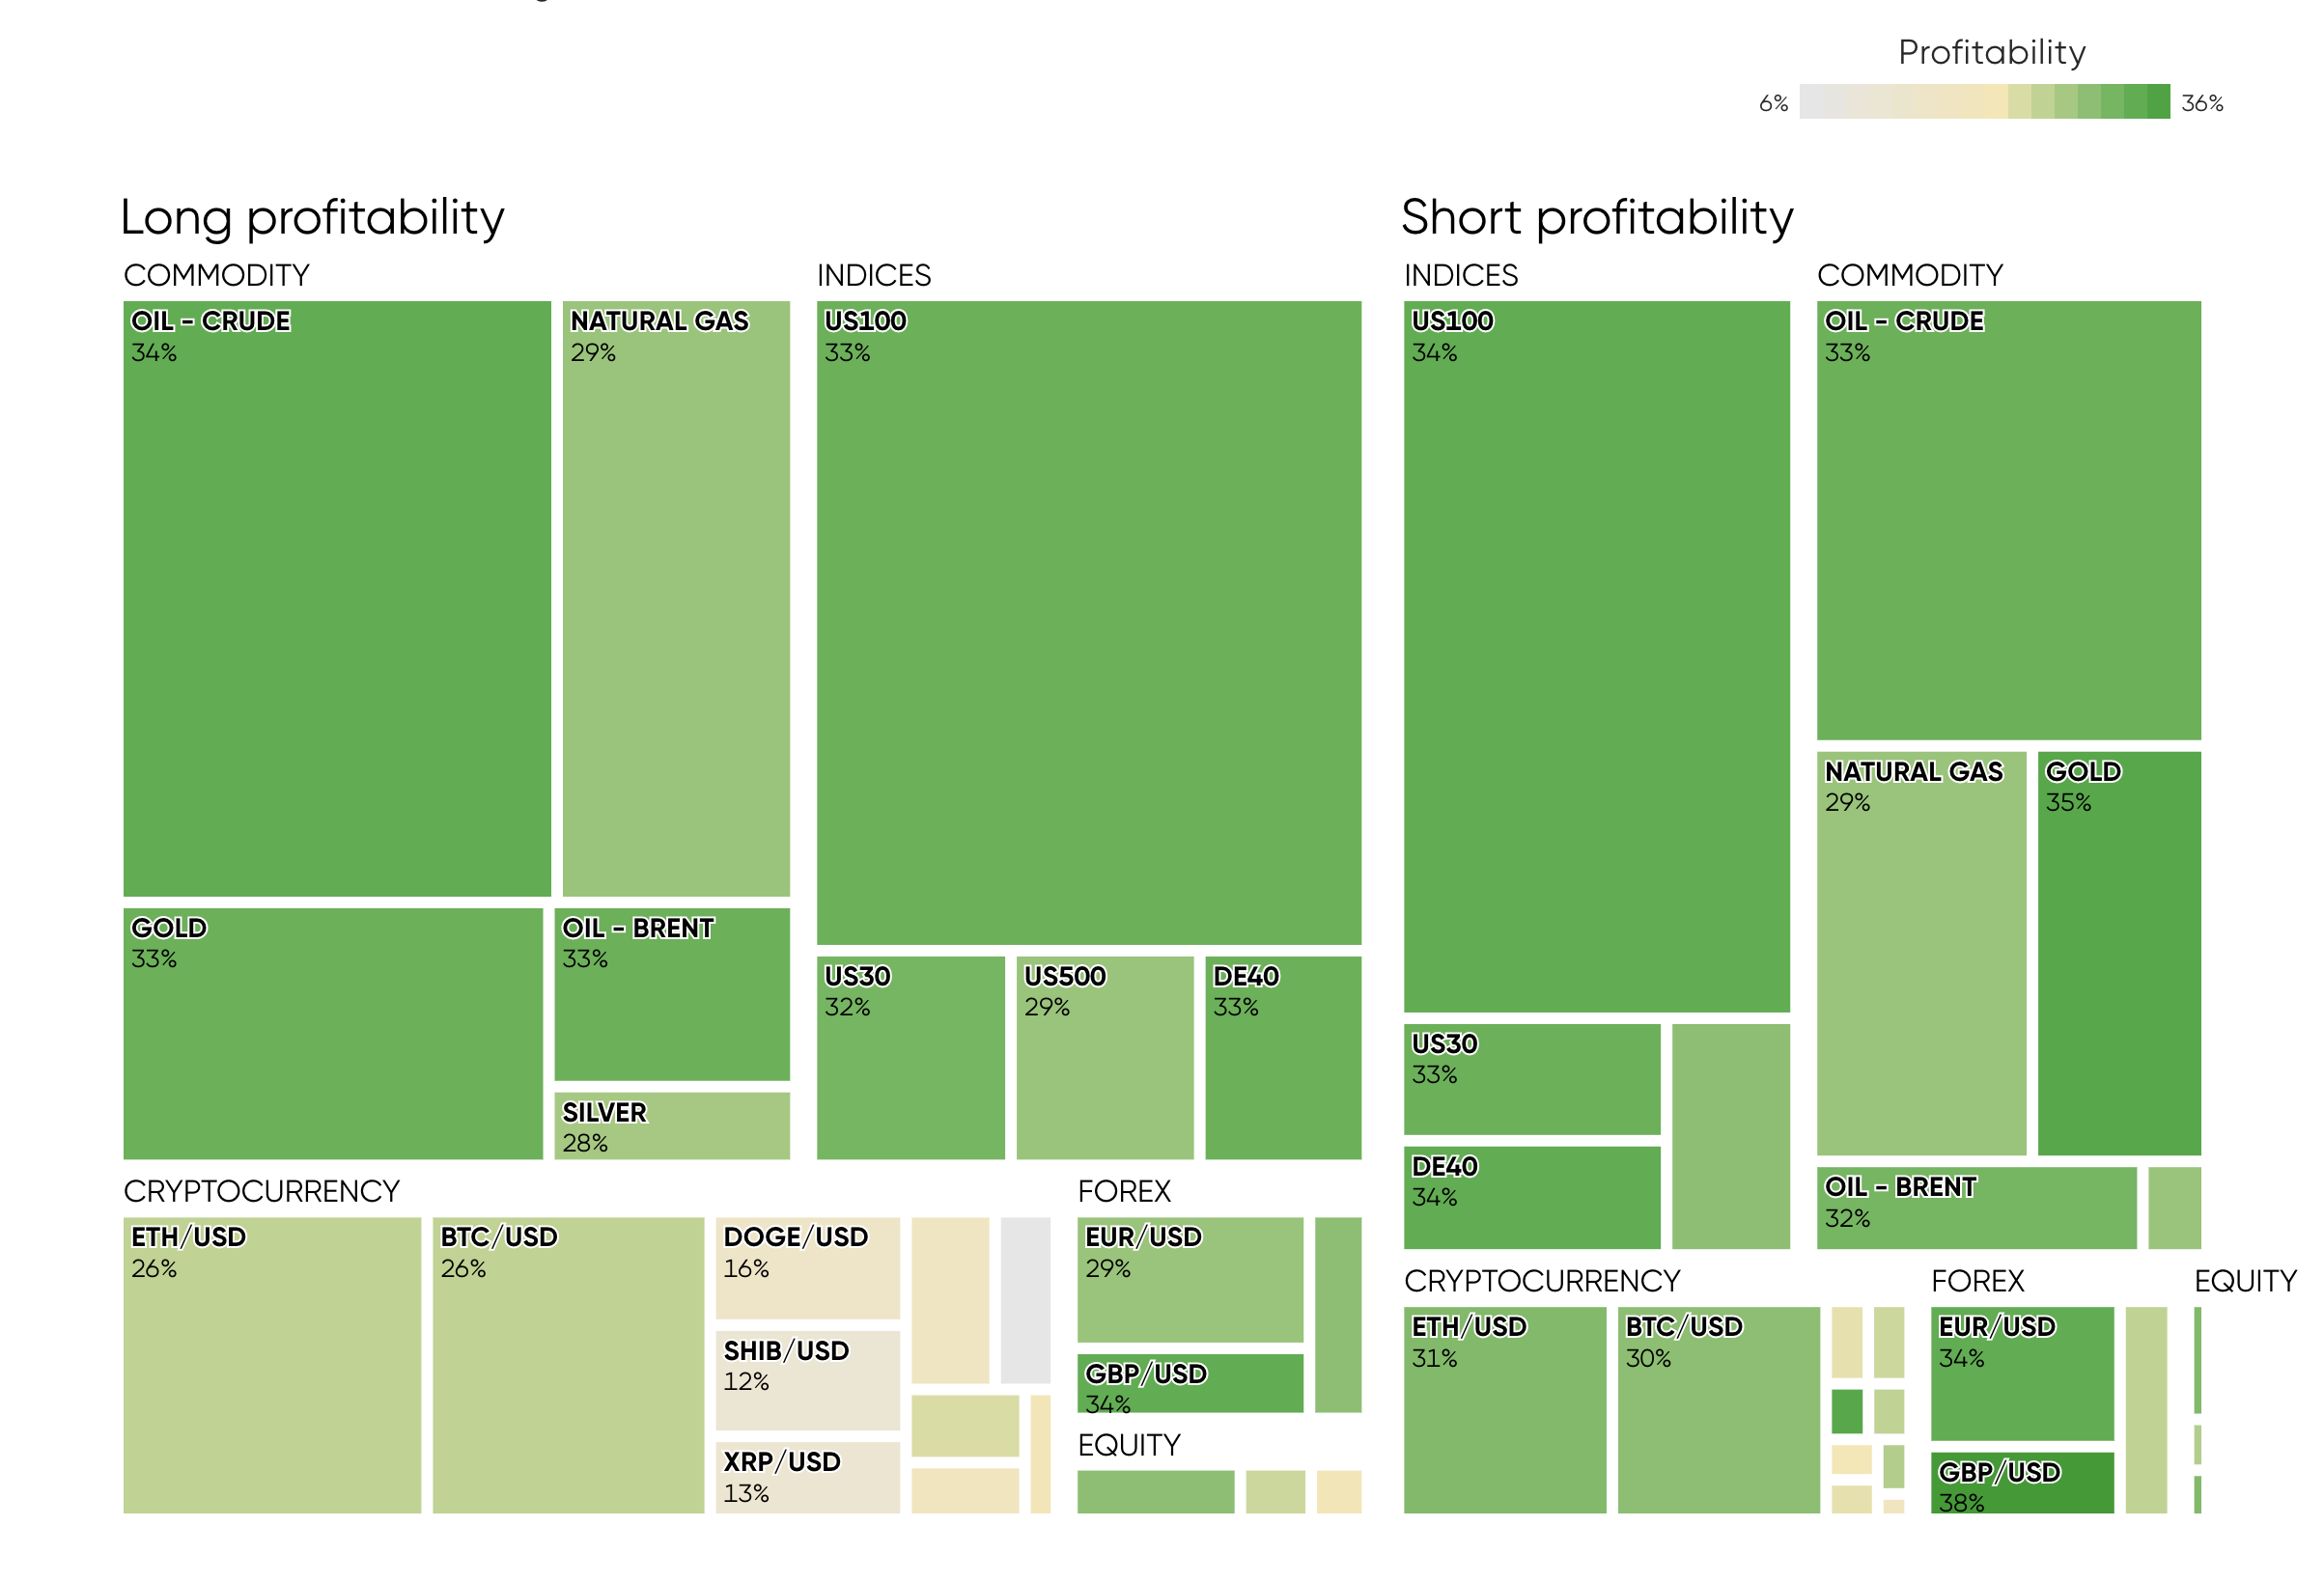
Indeed, Capital.com data showed that 38% of traders on the platform took short positions, up from 34% in the first quarter, as they took advantage of falling asset prices. This marked the highest percentage of short sellers since Q1 2020. And it proved to be a useful strategy for our traders as shorting was more often profitable this quarter than long positions, with 32.1% of short trades being profitable against 28.7% for long positions.
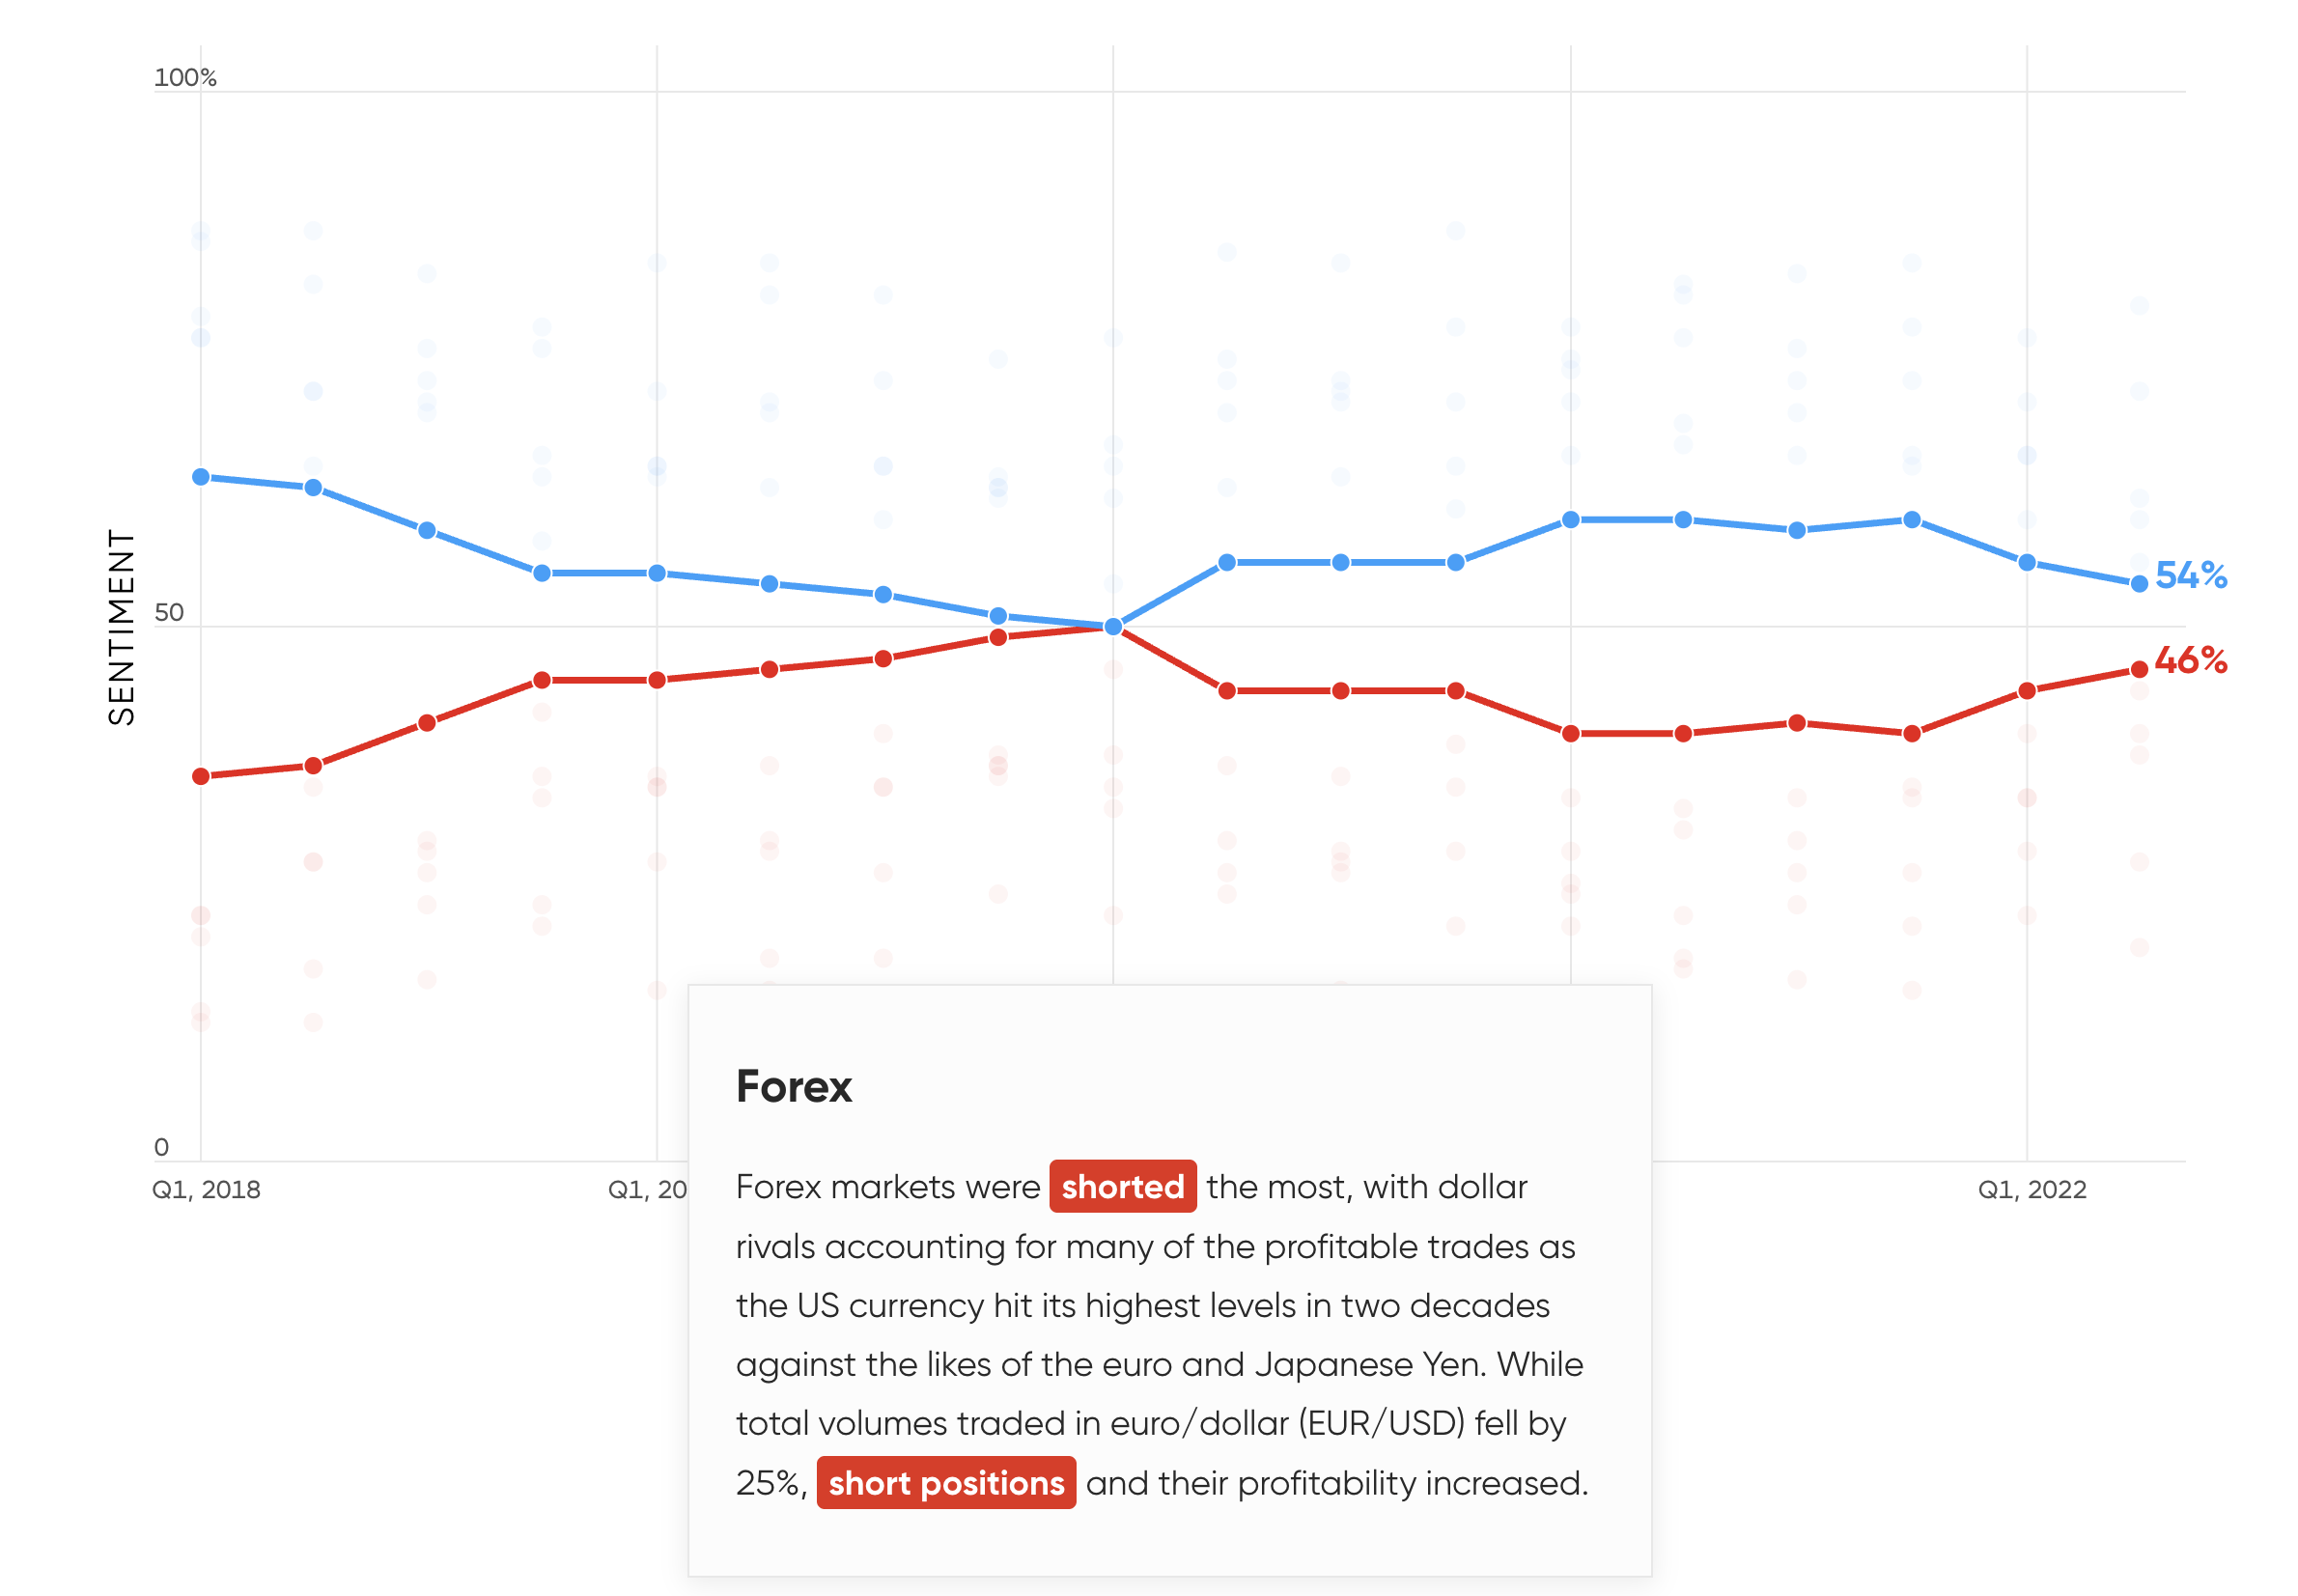
The highest proportion of short trades was seen in the UK, Africa and Asia (41%). The lowest proportion of short trades was seen in Australia (34%), though this was increased from Q1. Forex was the most heavily shorted market, with traders around the world shorting the US dollar’s prospects against other currencies, particularly the Japanese yen.
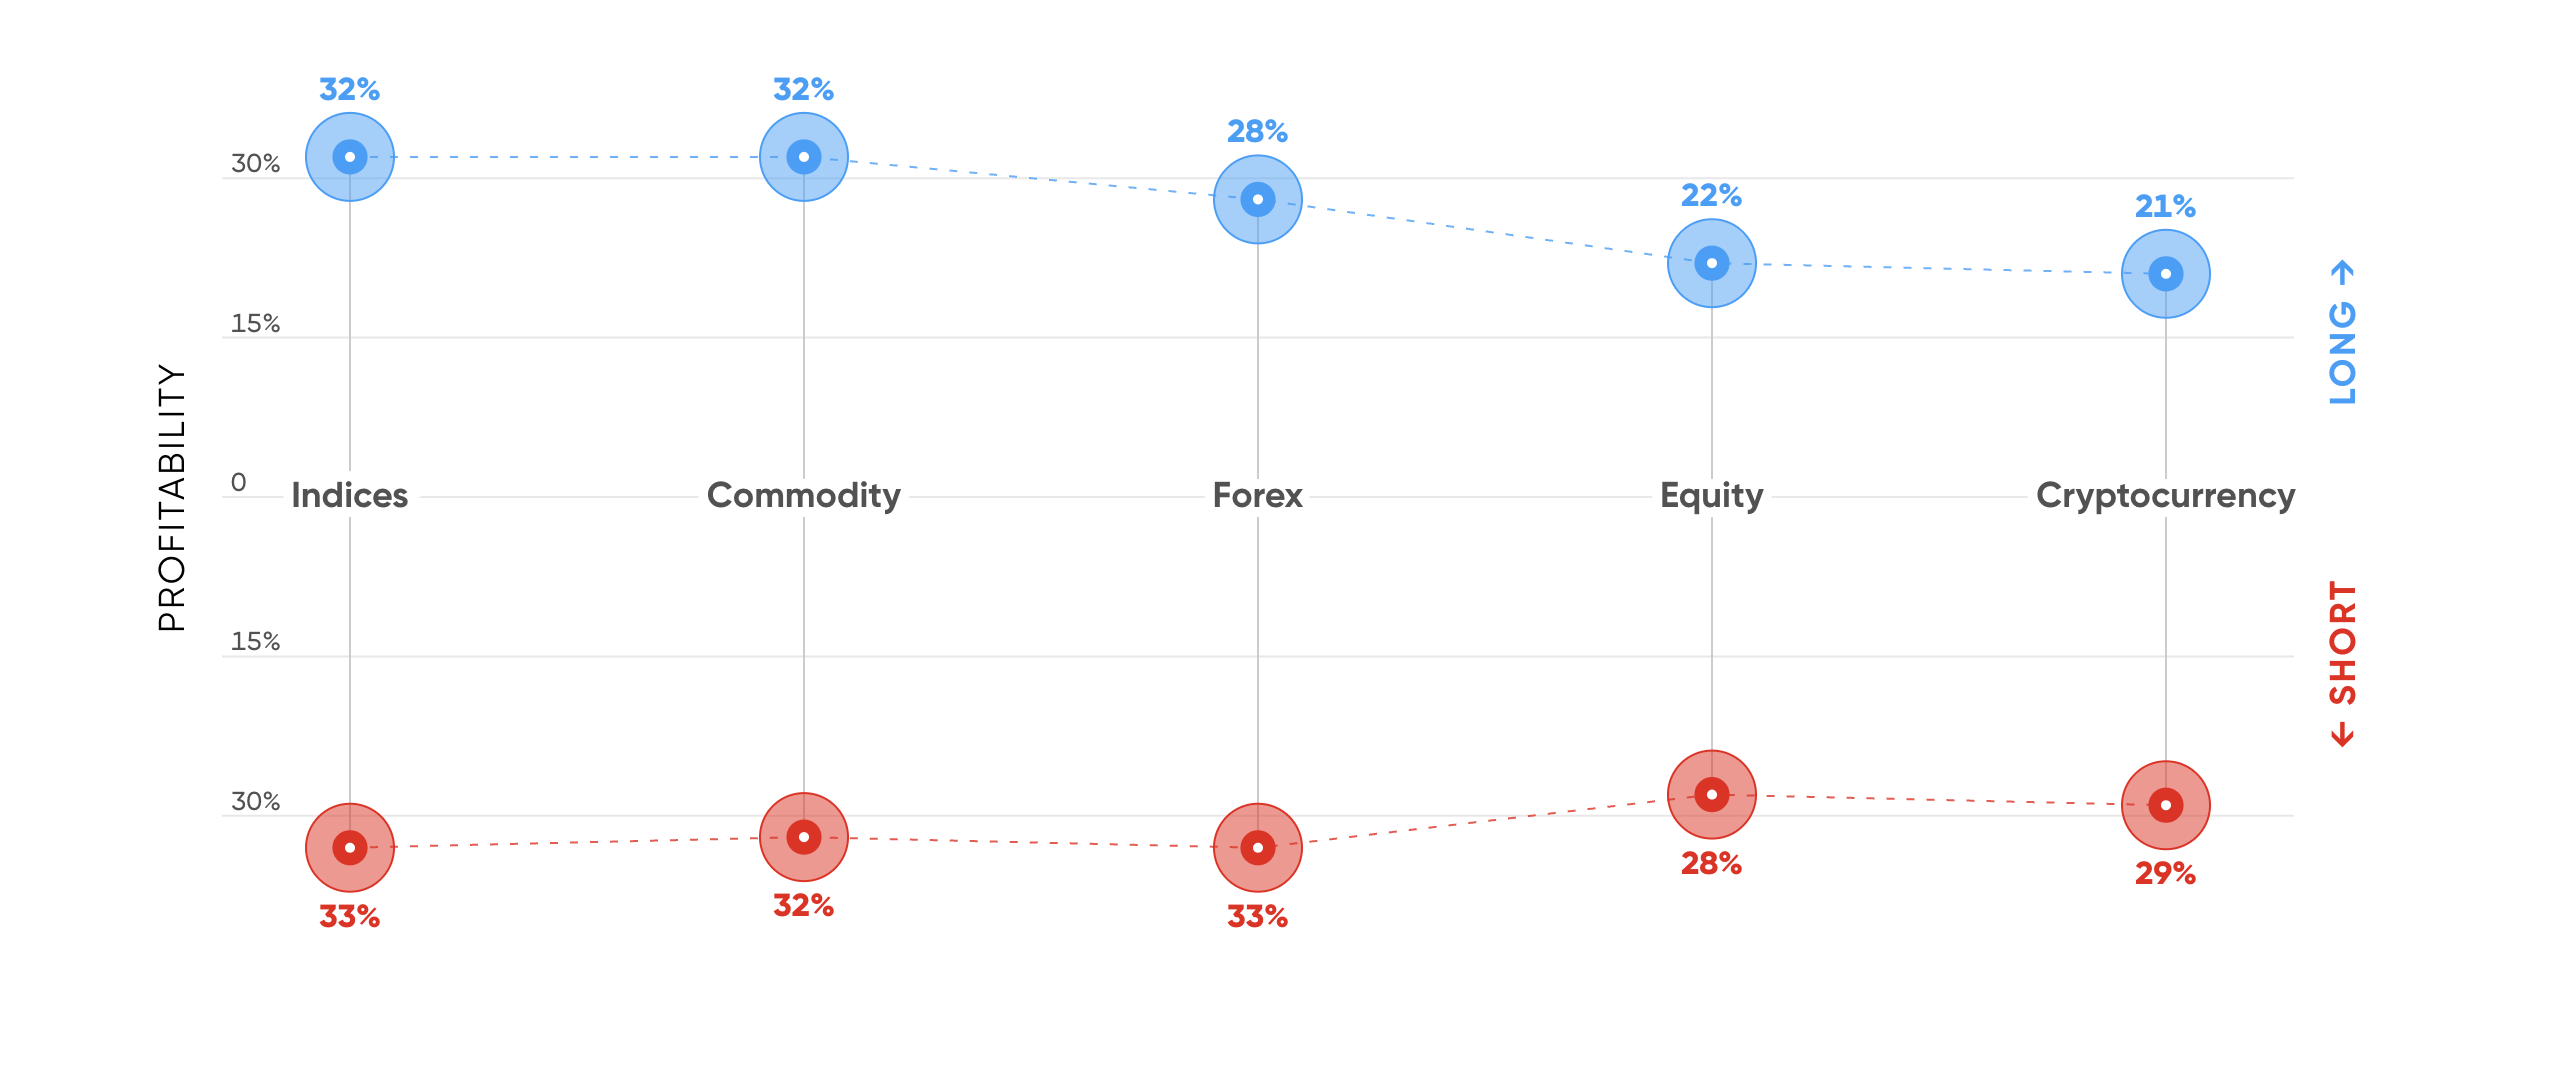
Long positions in the cryptocurrency market were the least profitable
Profitability of long and short positions per market in Q2, 2022.
Most commonly shorted assets
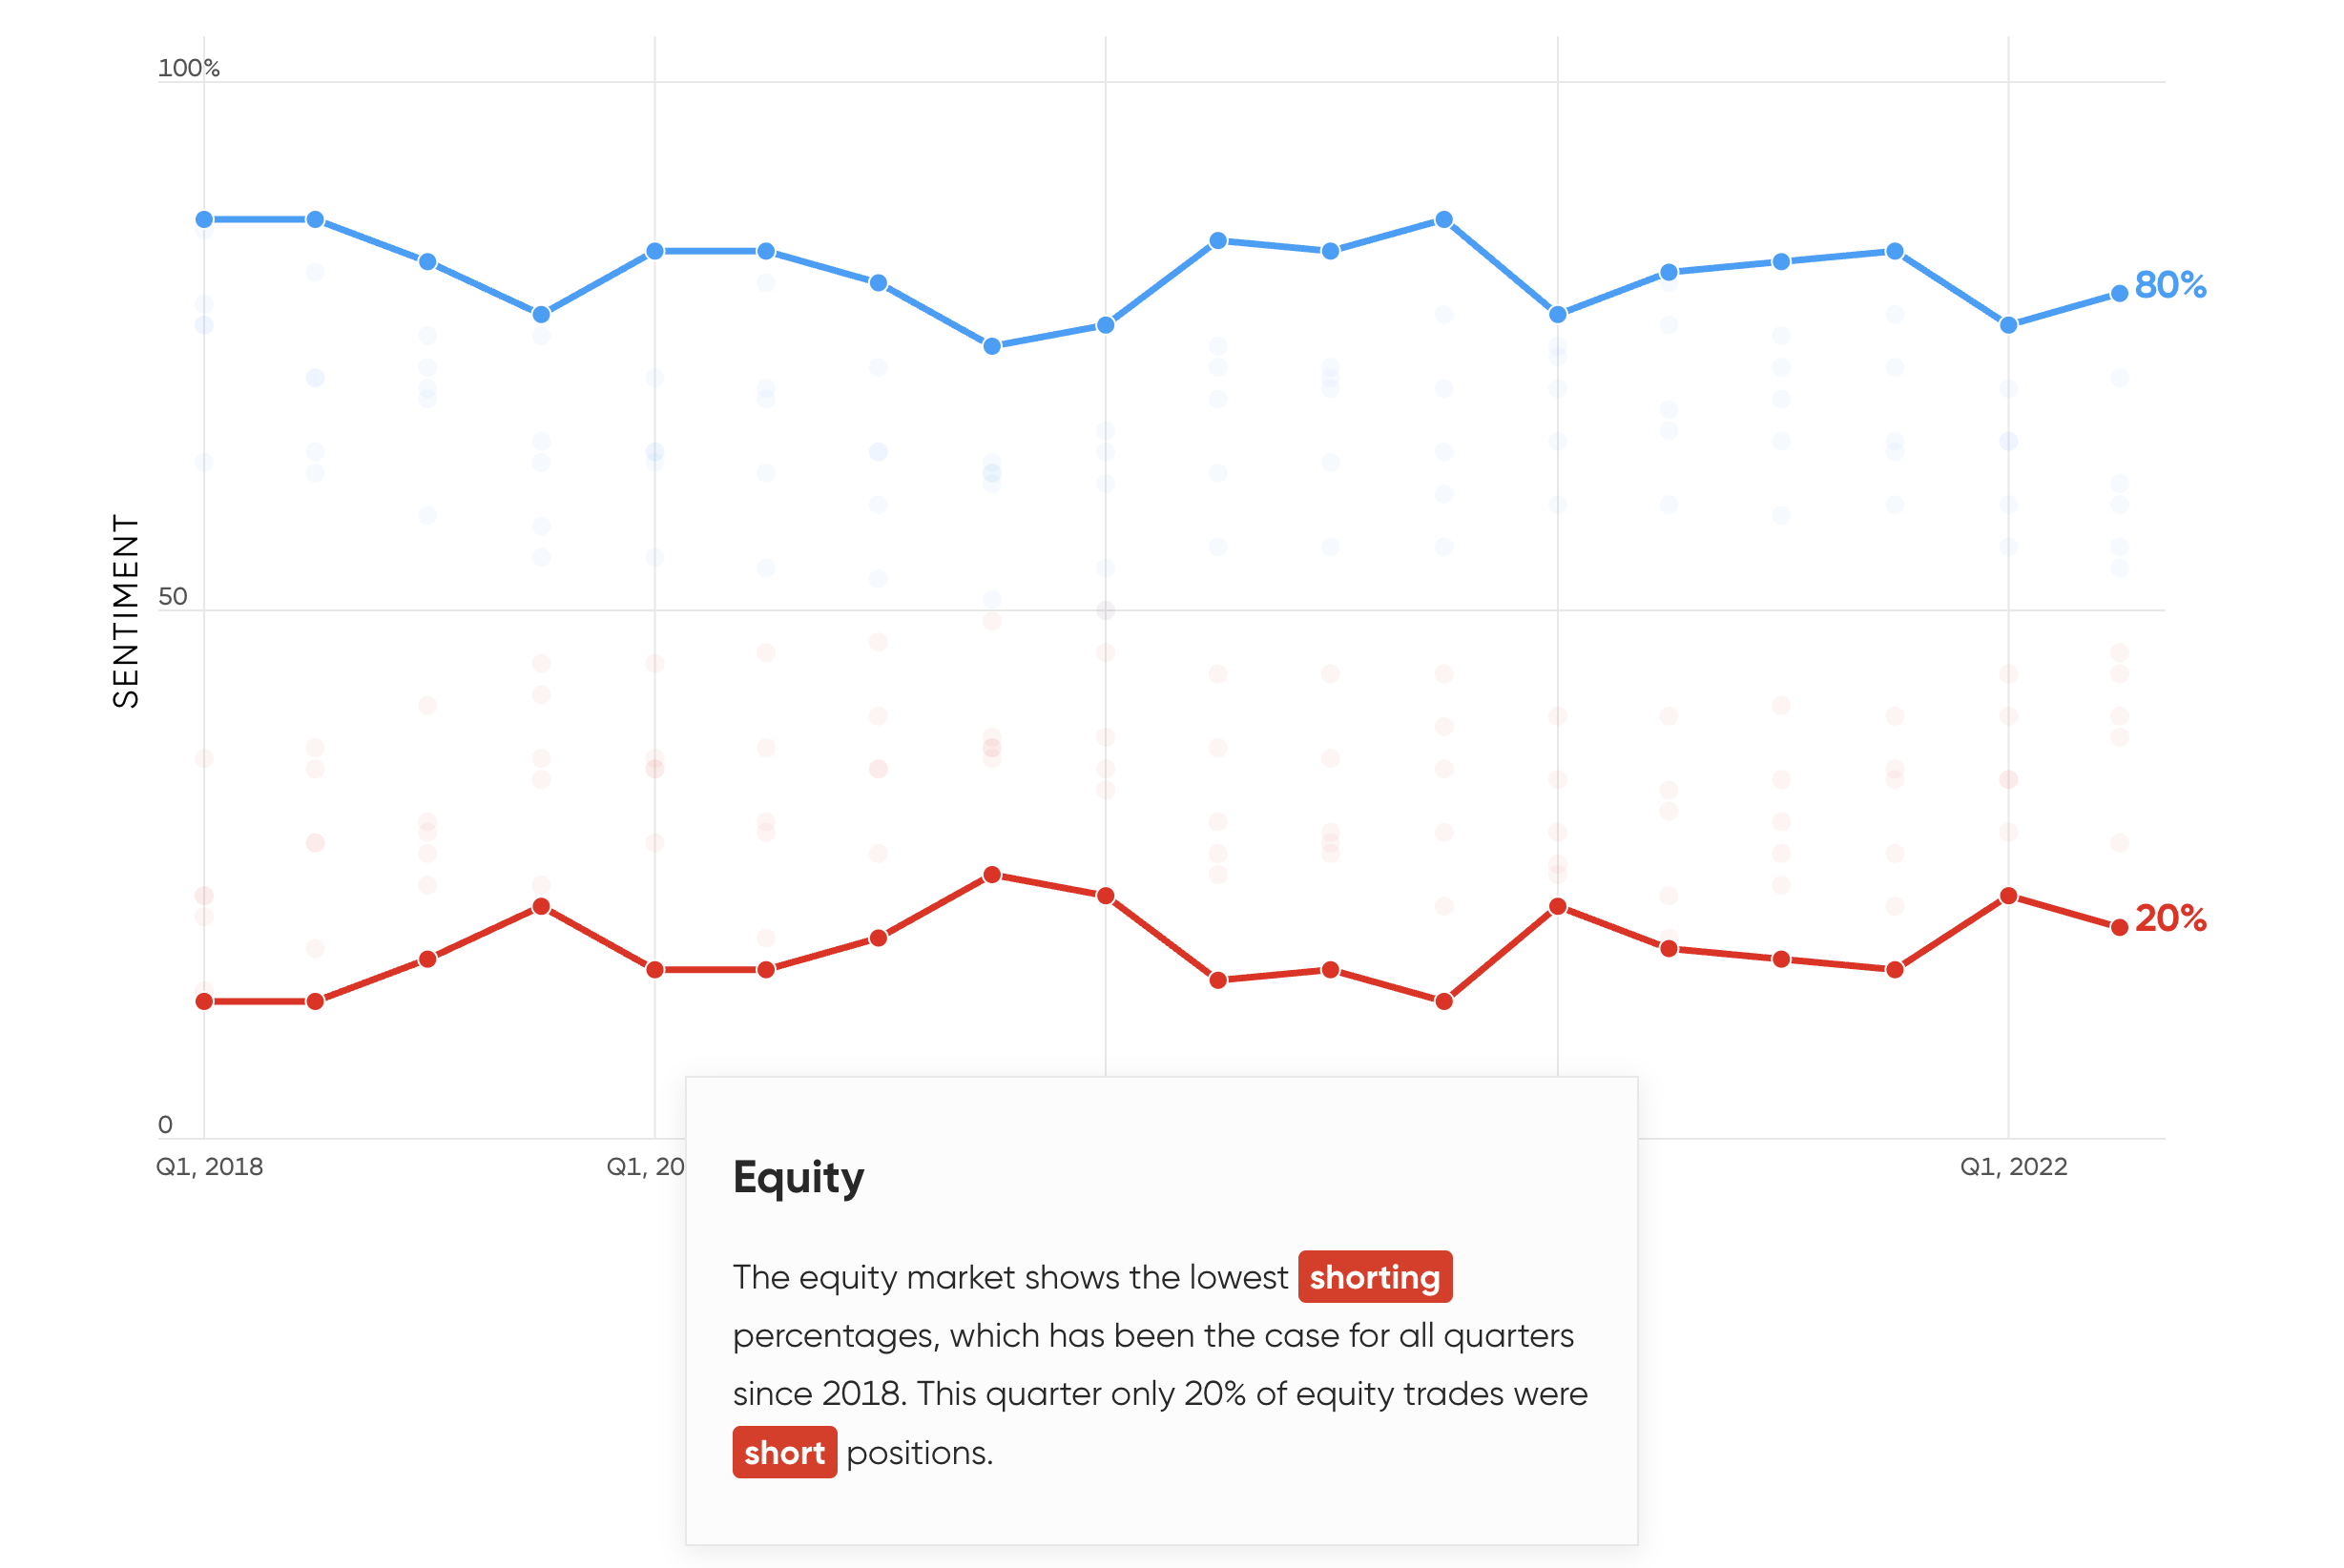
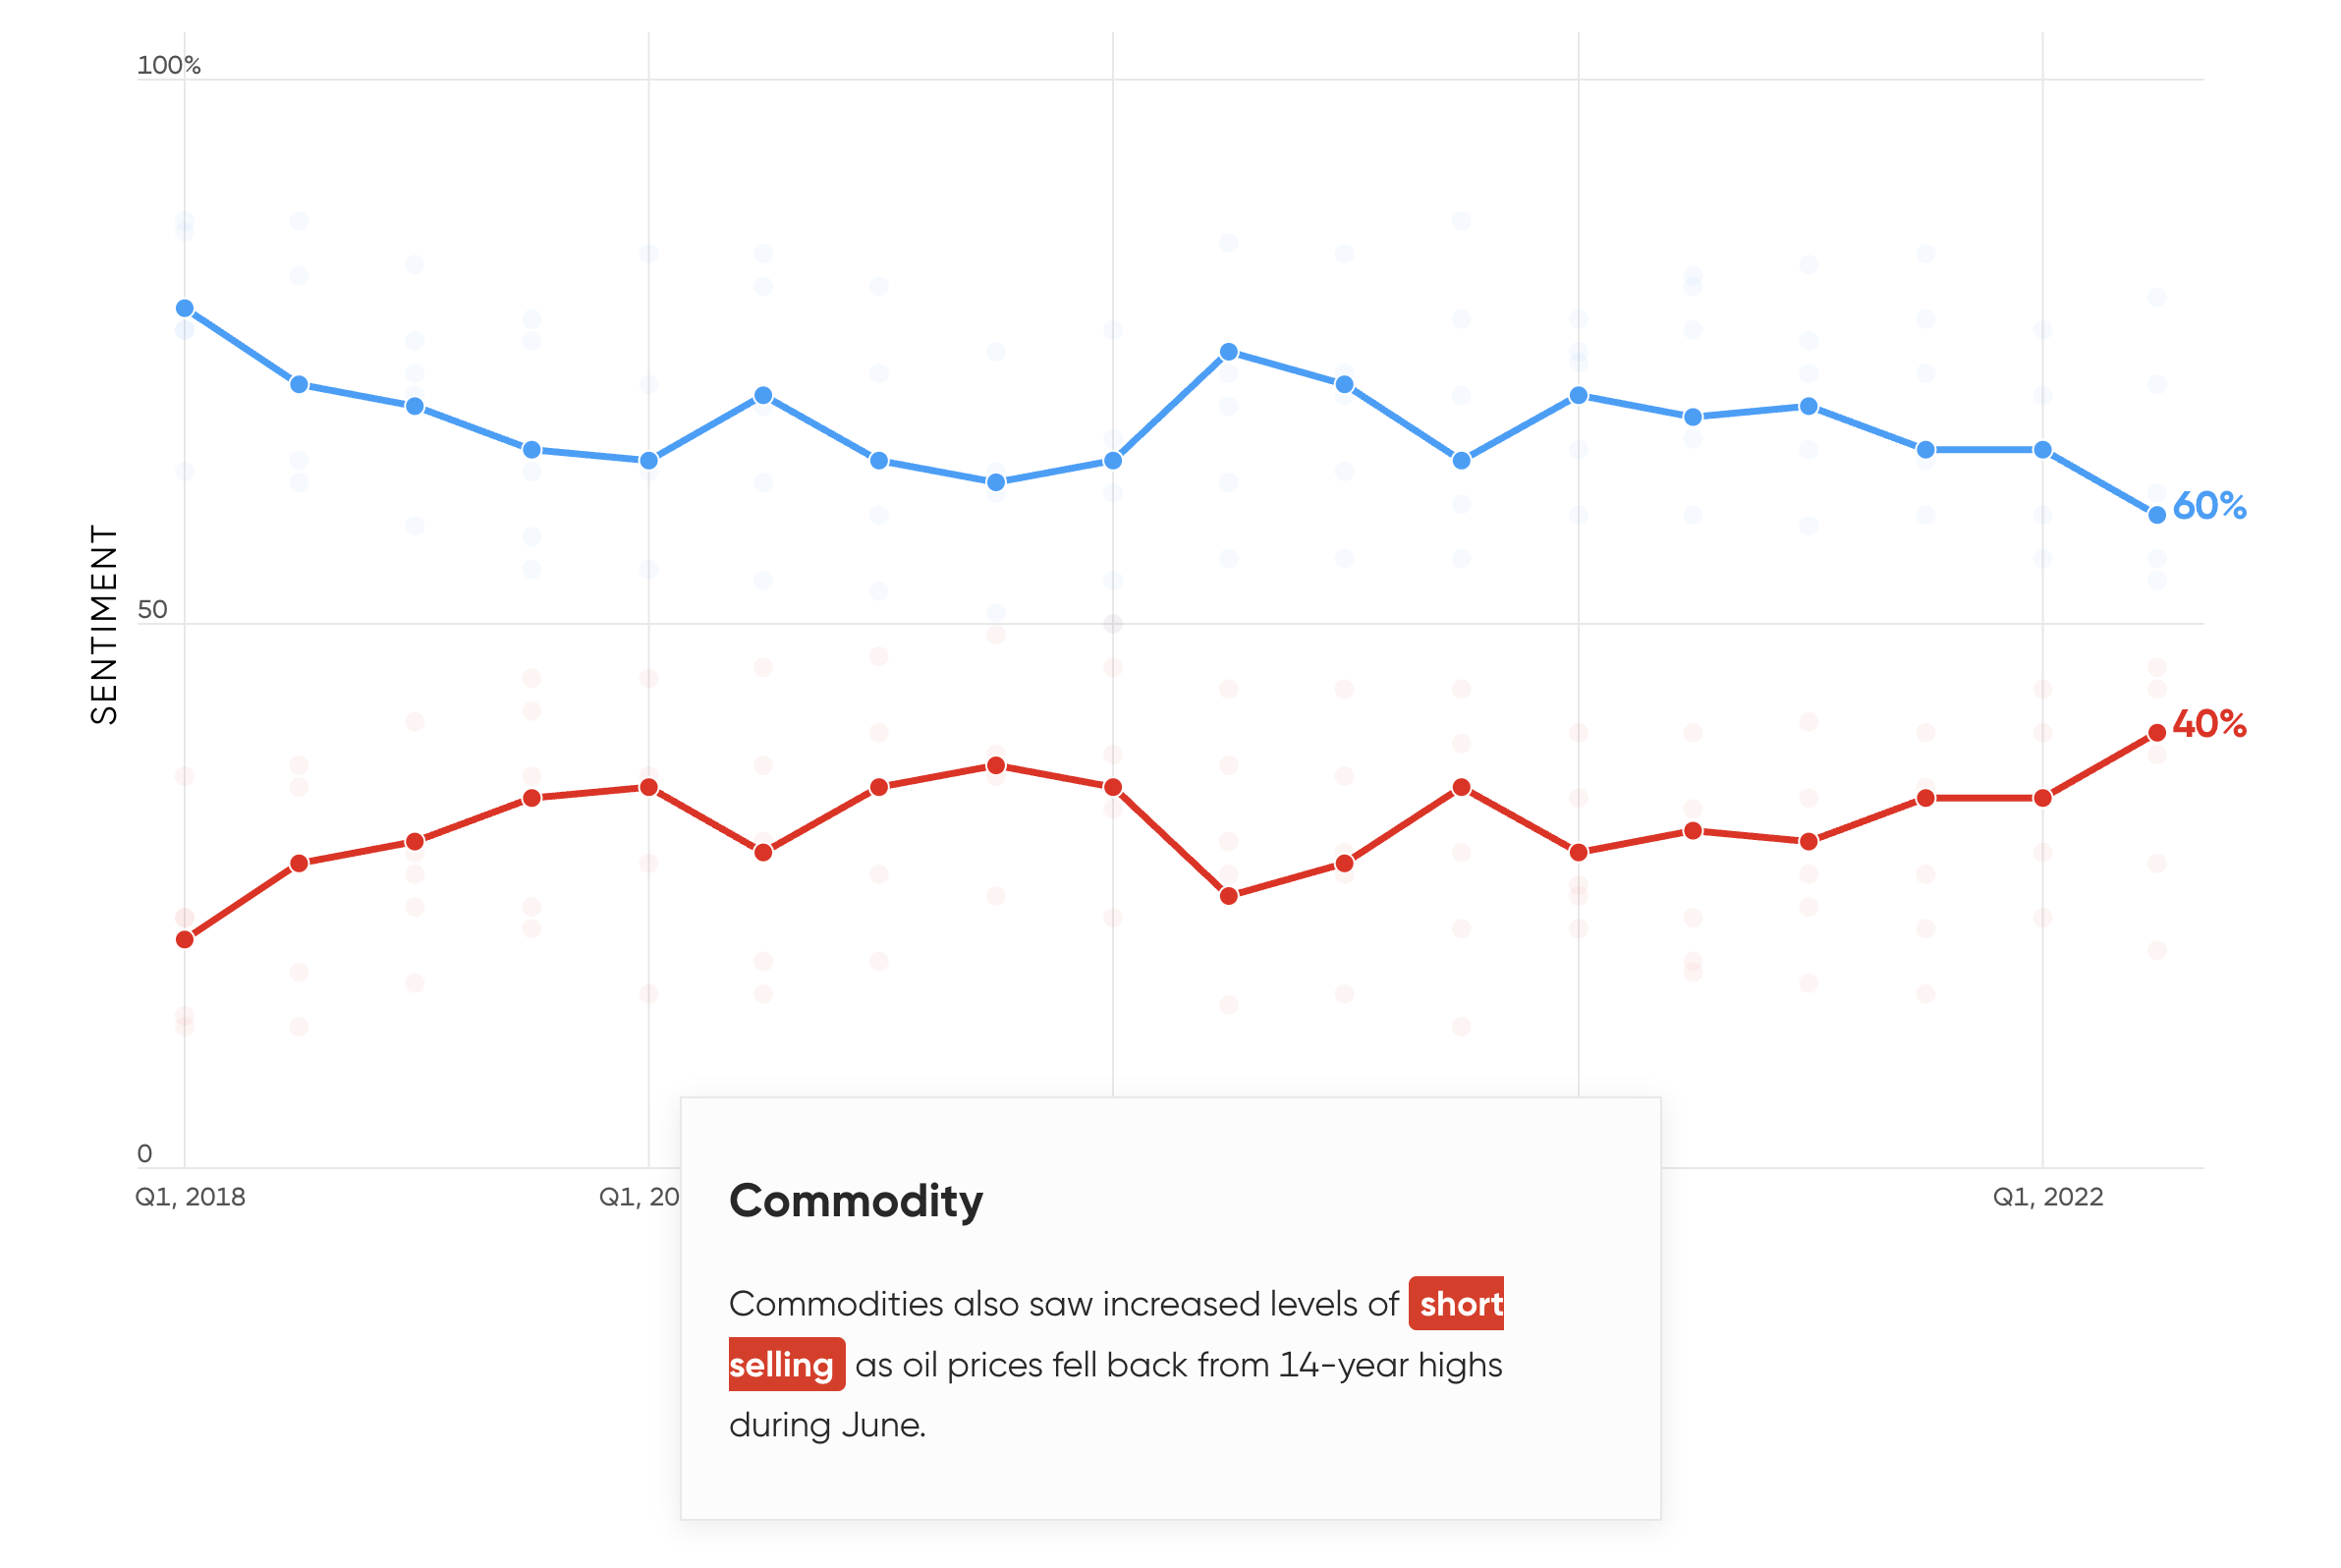
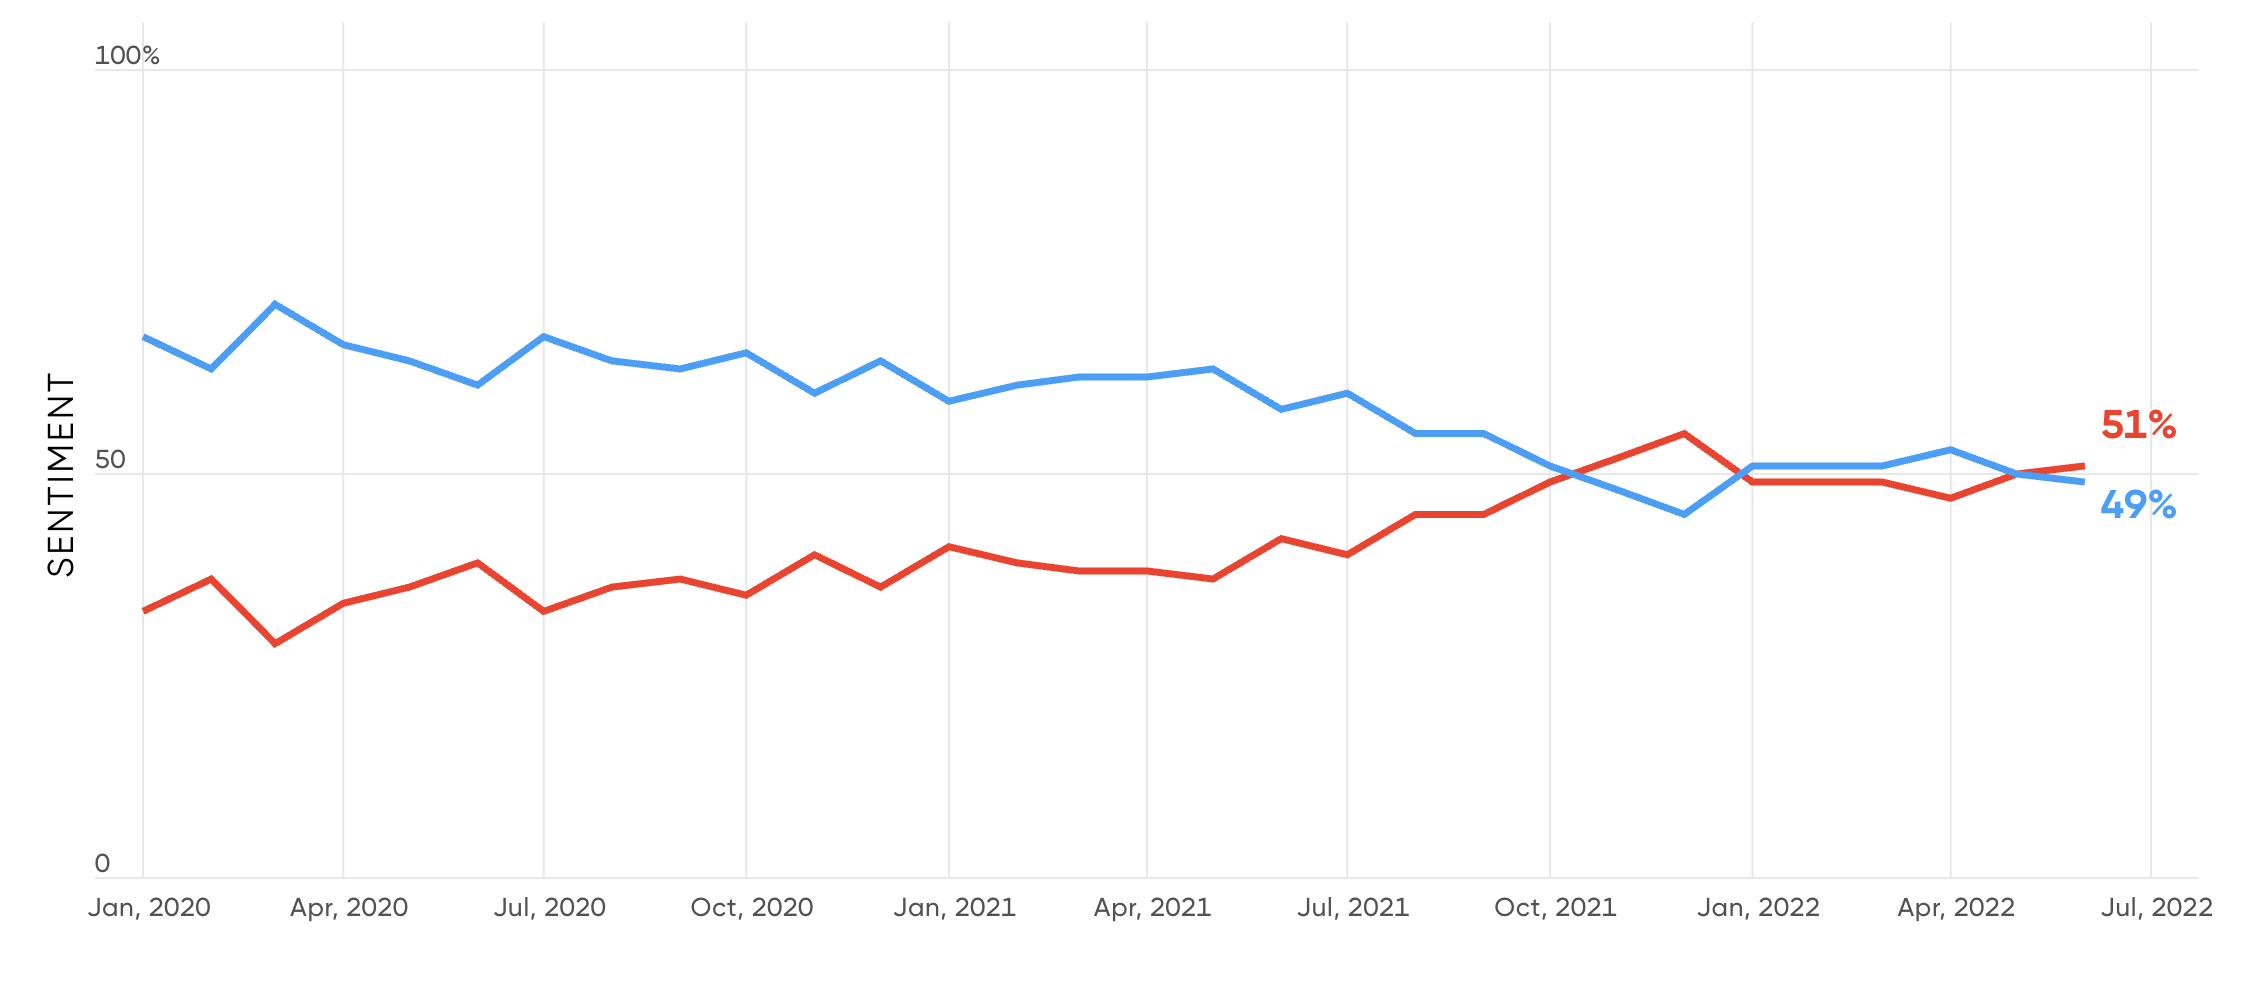
Short sentiment climbs to a four-year high
Percentage of long and short positions.
Most shorted instruments per country
Excluding countries and instruments with less than 1000 trades.
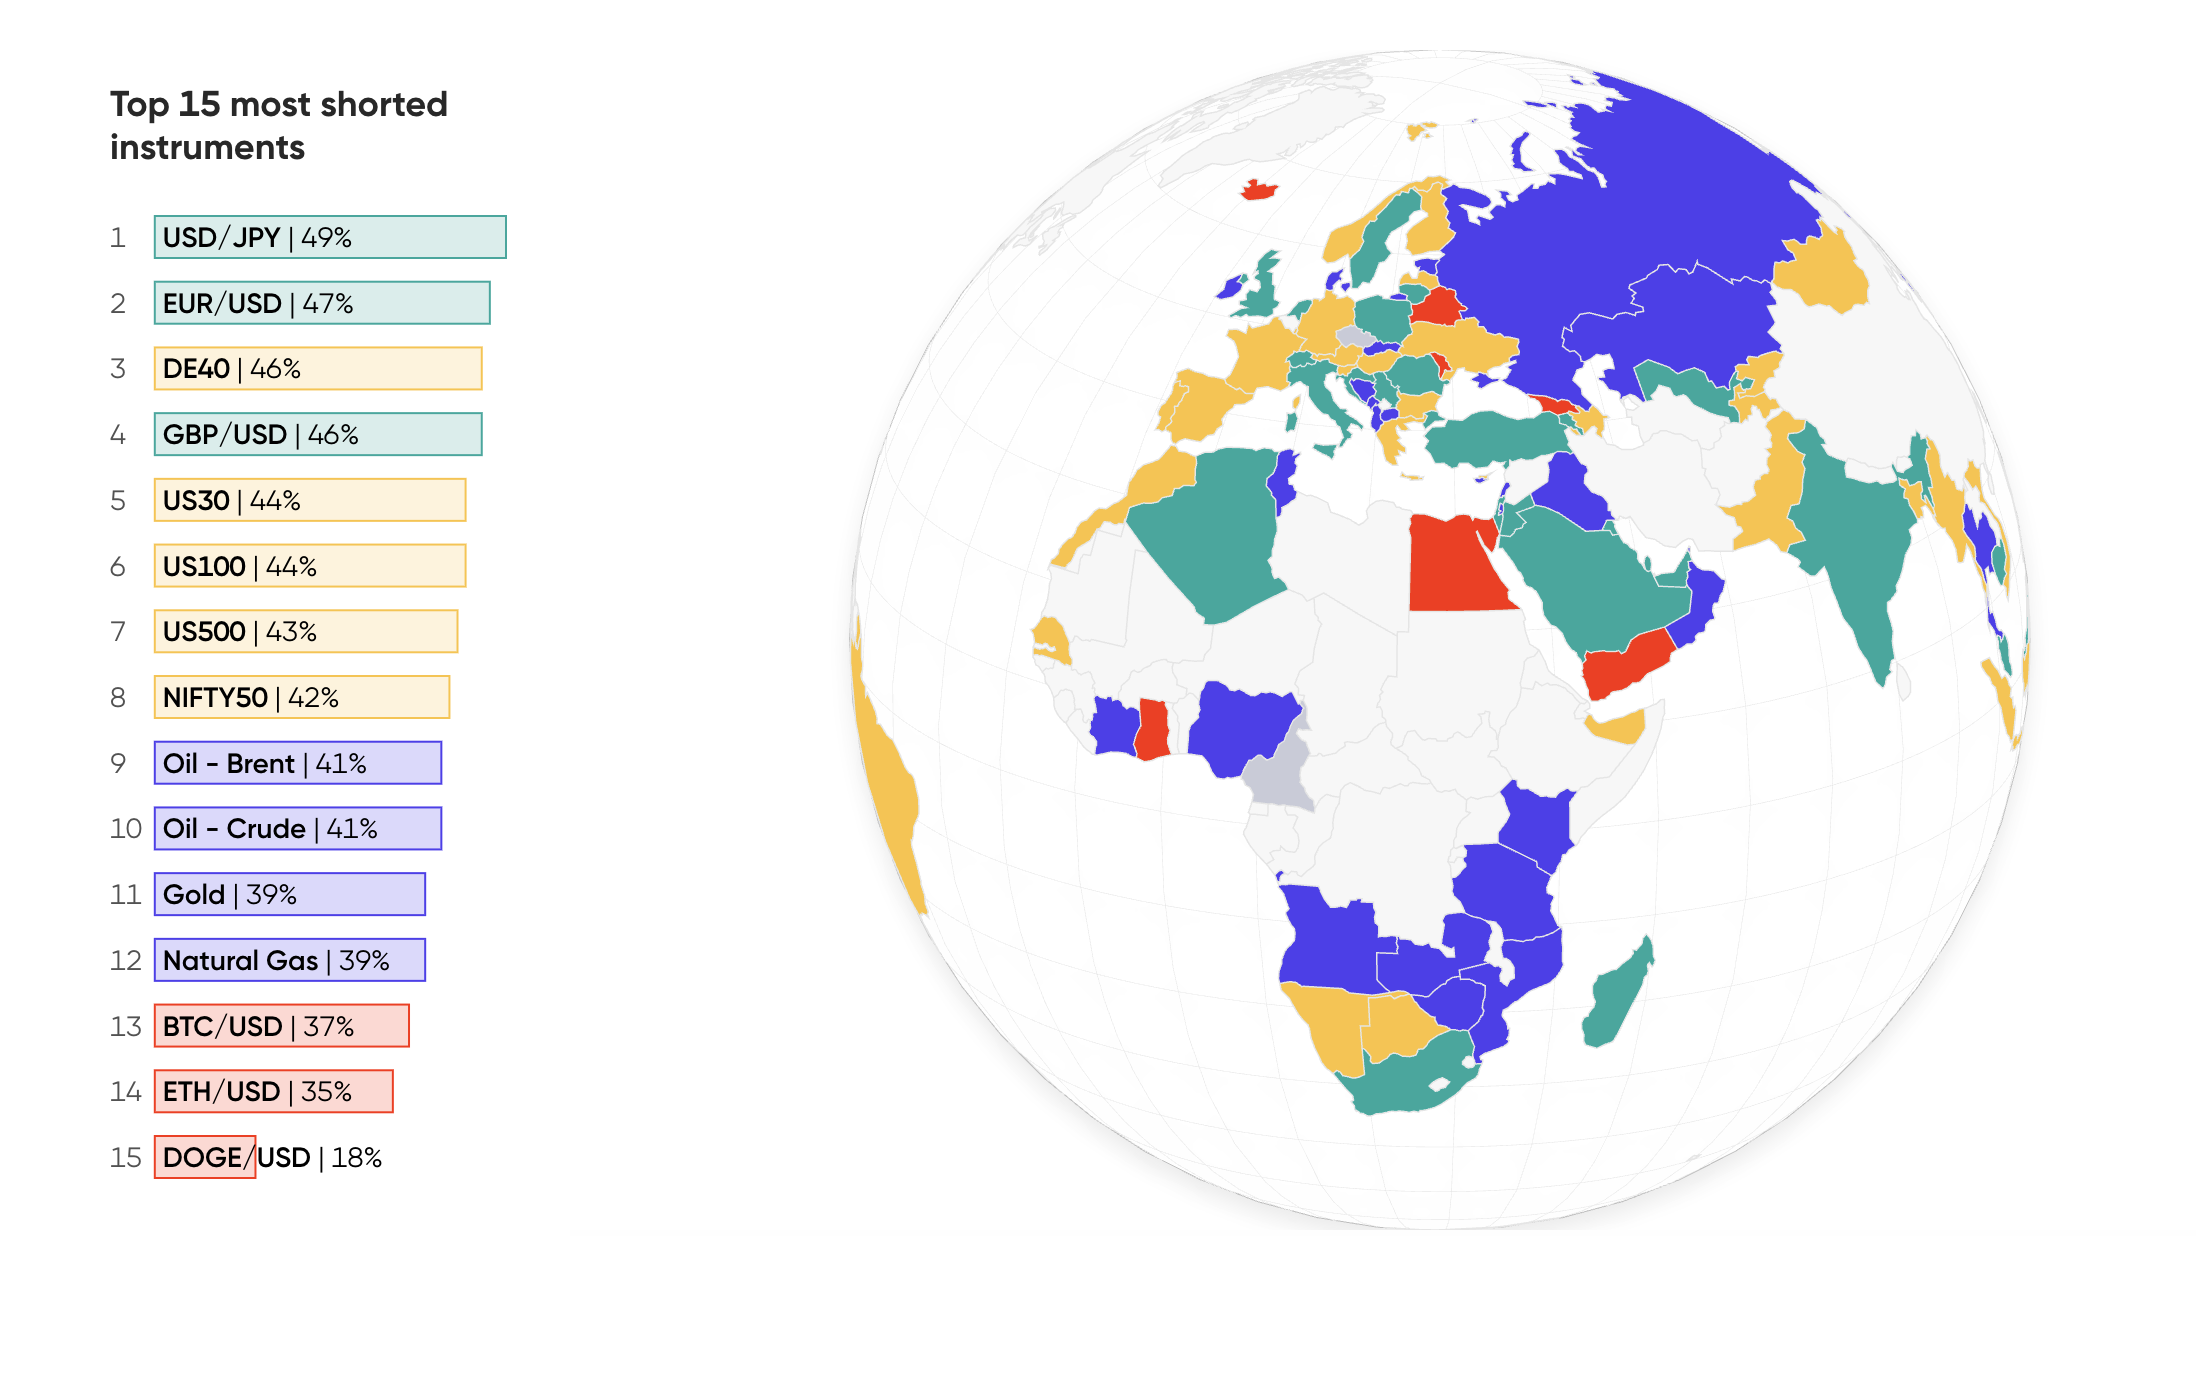
All regions had a currency pair as their most-shorted instrument: for all regions except UK and Africa, this was the US dollar versus the Japanese Yen (USD/JPY), as the US embarked on an aggressive rate-hike policy, while Japan held its ultra-loose stance (see more on this below).
Q2 showed the biggest percentage change in shorting for Australia (+18%) and the UK (+17%), followed by the Middle East (+15%). Short selling in Asia only went up by 6% in Q2.
Profitability of long vs short positions for the 25 most popular instruments
Profitability of the top 25 instruments by the number of traders in Q2 2022. Size indicates trades magnitude.
Natural gas trading surged 75%
Capital.com group data shows that there was a 75% increase in natural gas trades, which means a jump from around 858,000 to 1.5 million trades in the commodity.
The second quarter also showed that the number of short traders increased while long traders decreased – with investors proving to be most active in Europe (8,700) and the Middle East (3,400).
Natural gas trading is surging
Percent of total trades per week.
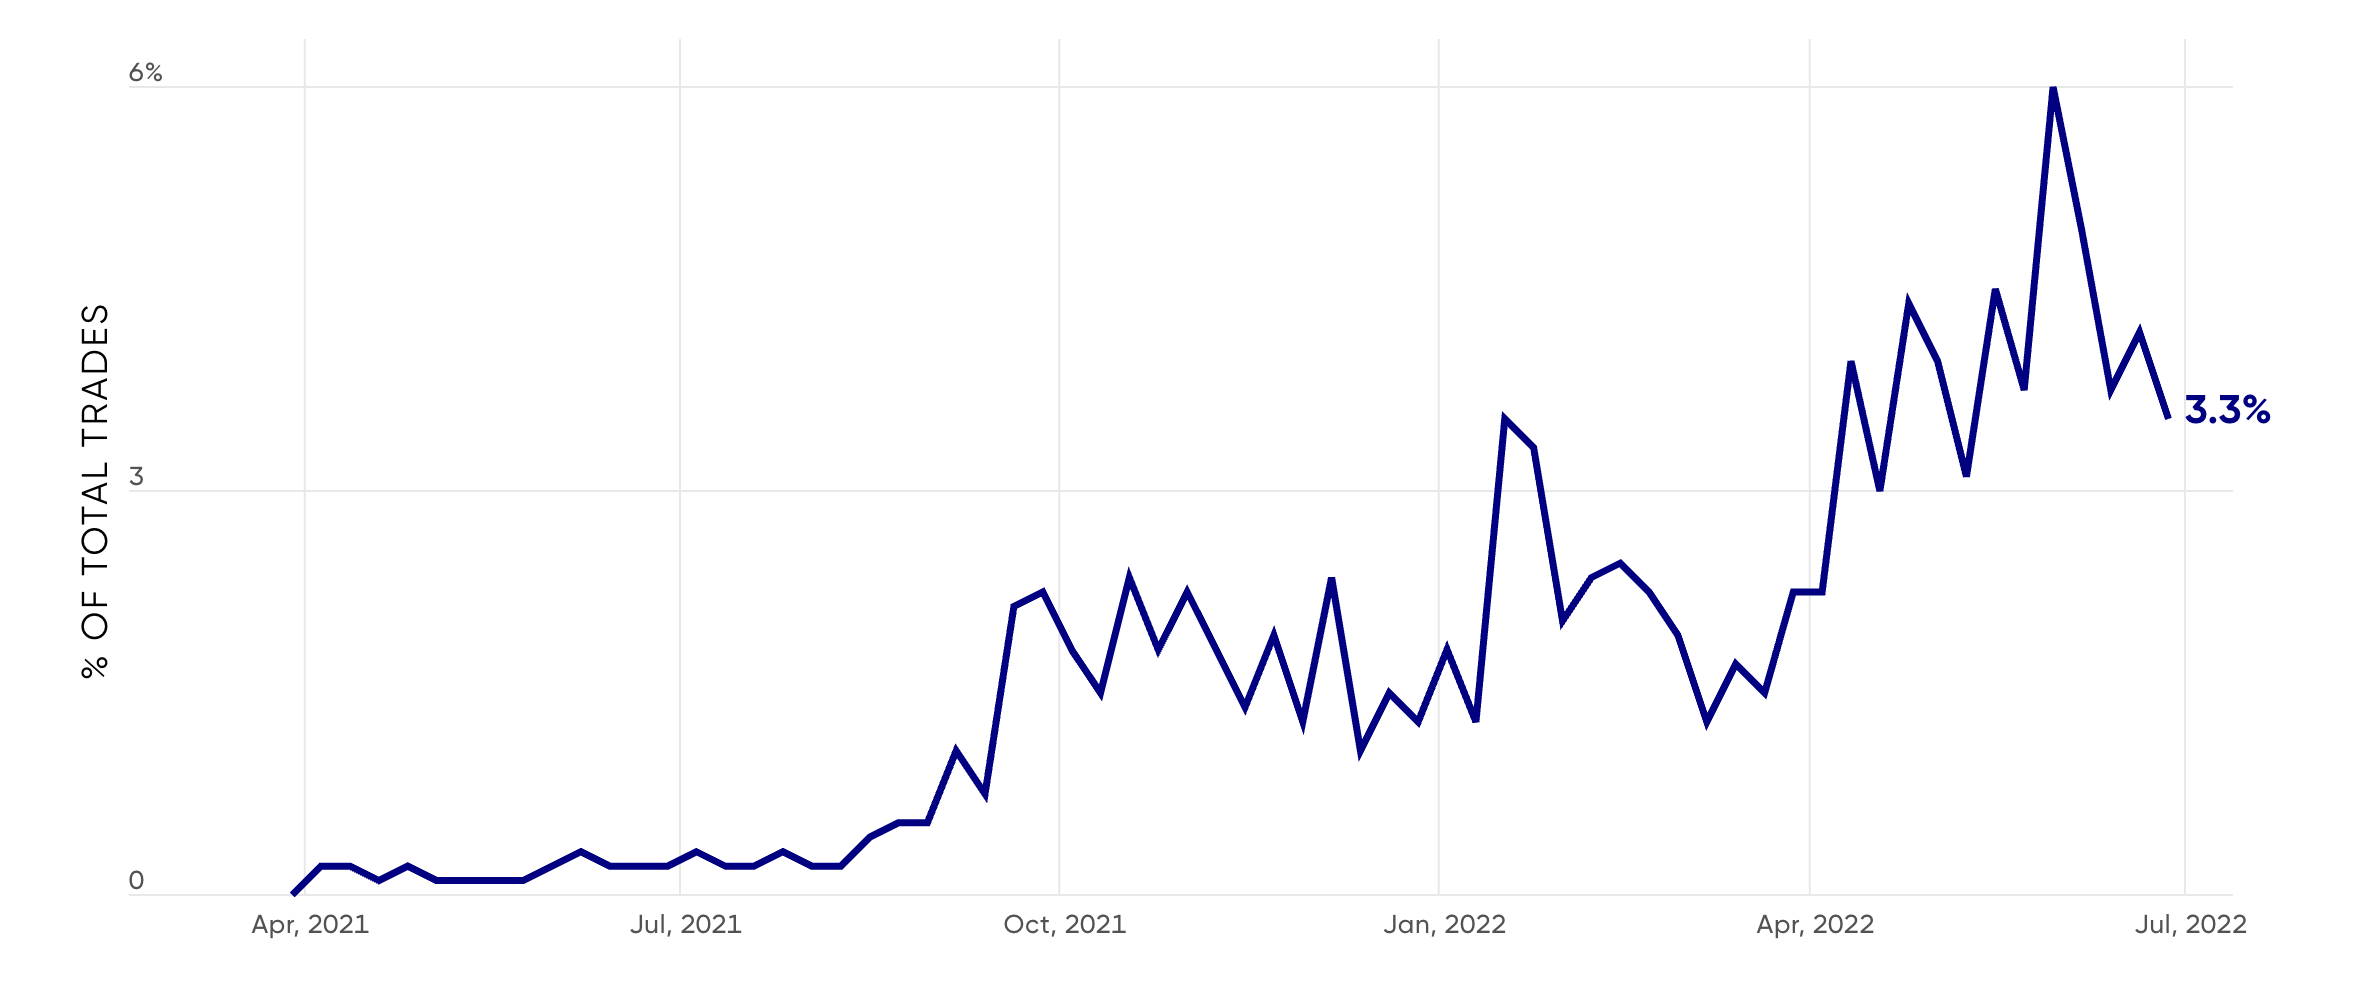
“It’s been an incredible year so far for natural gas – the price had soared by 240% for the year, by the second week of June. In the past this energy market’s popularity has been overshadowed by crude oil. But with so much discussion on Europe's dependency on Russian gas, following the Russian invasion of Ukraine, it is perhaps not surprising that it has caught traders’ attention,” David Jones, chief market strategist at Capital.com, said.
Plus, the volatility has been off the scale – and we know that this is always attractive to our clients. This is part of the reason that longs and shorts have been equally profitable. Natural gas is a market that can reverse direction very quickly and what looked like a solid trend can suddenly evaporate, often driven by those geo-political concerns.”
Jones noted that due to volatility natural gas can be an unforgiving asset.
“In the last three weeks of June, the price dropped by more than a third, rewarding those who were still short but burning the fingers of those trying to catch a bottom. Given the continuing wild swings it’s likely to continue to prove a popular market into the third quarter,” Jones said.
David Jones
Capital.com Chief Analyst
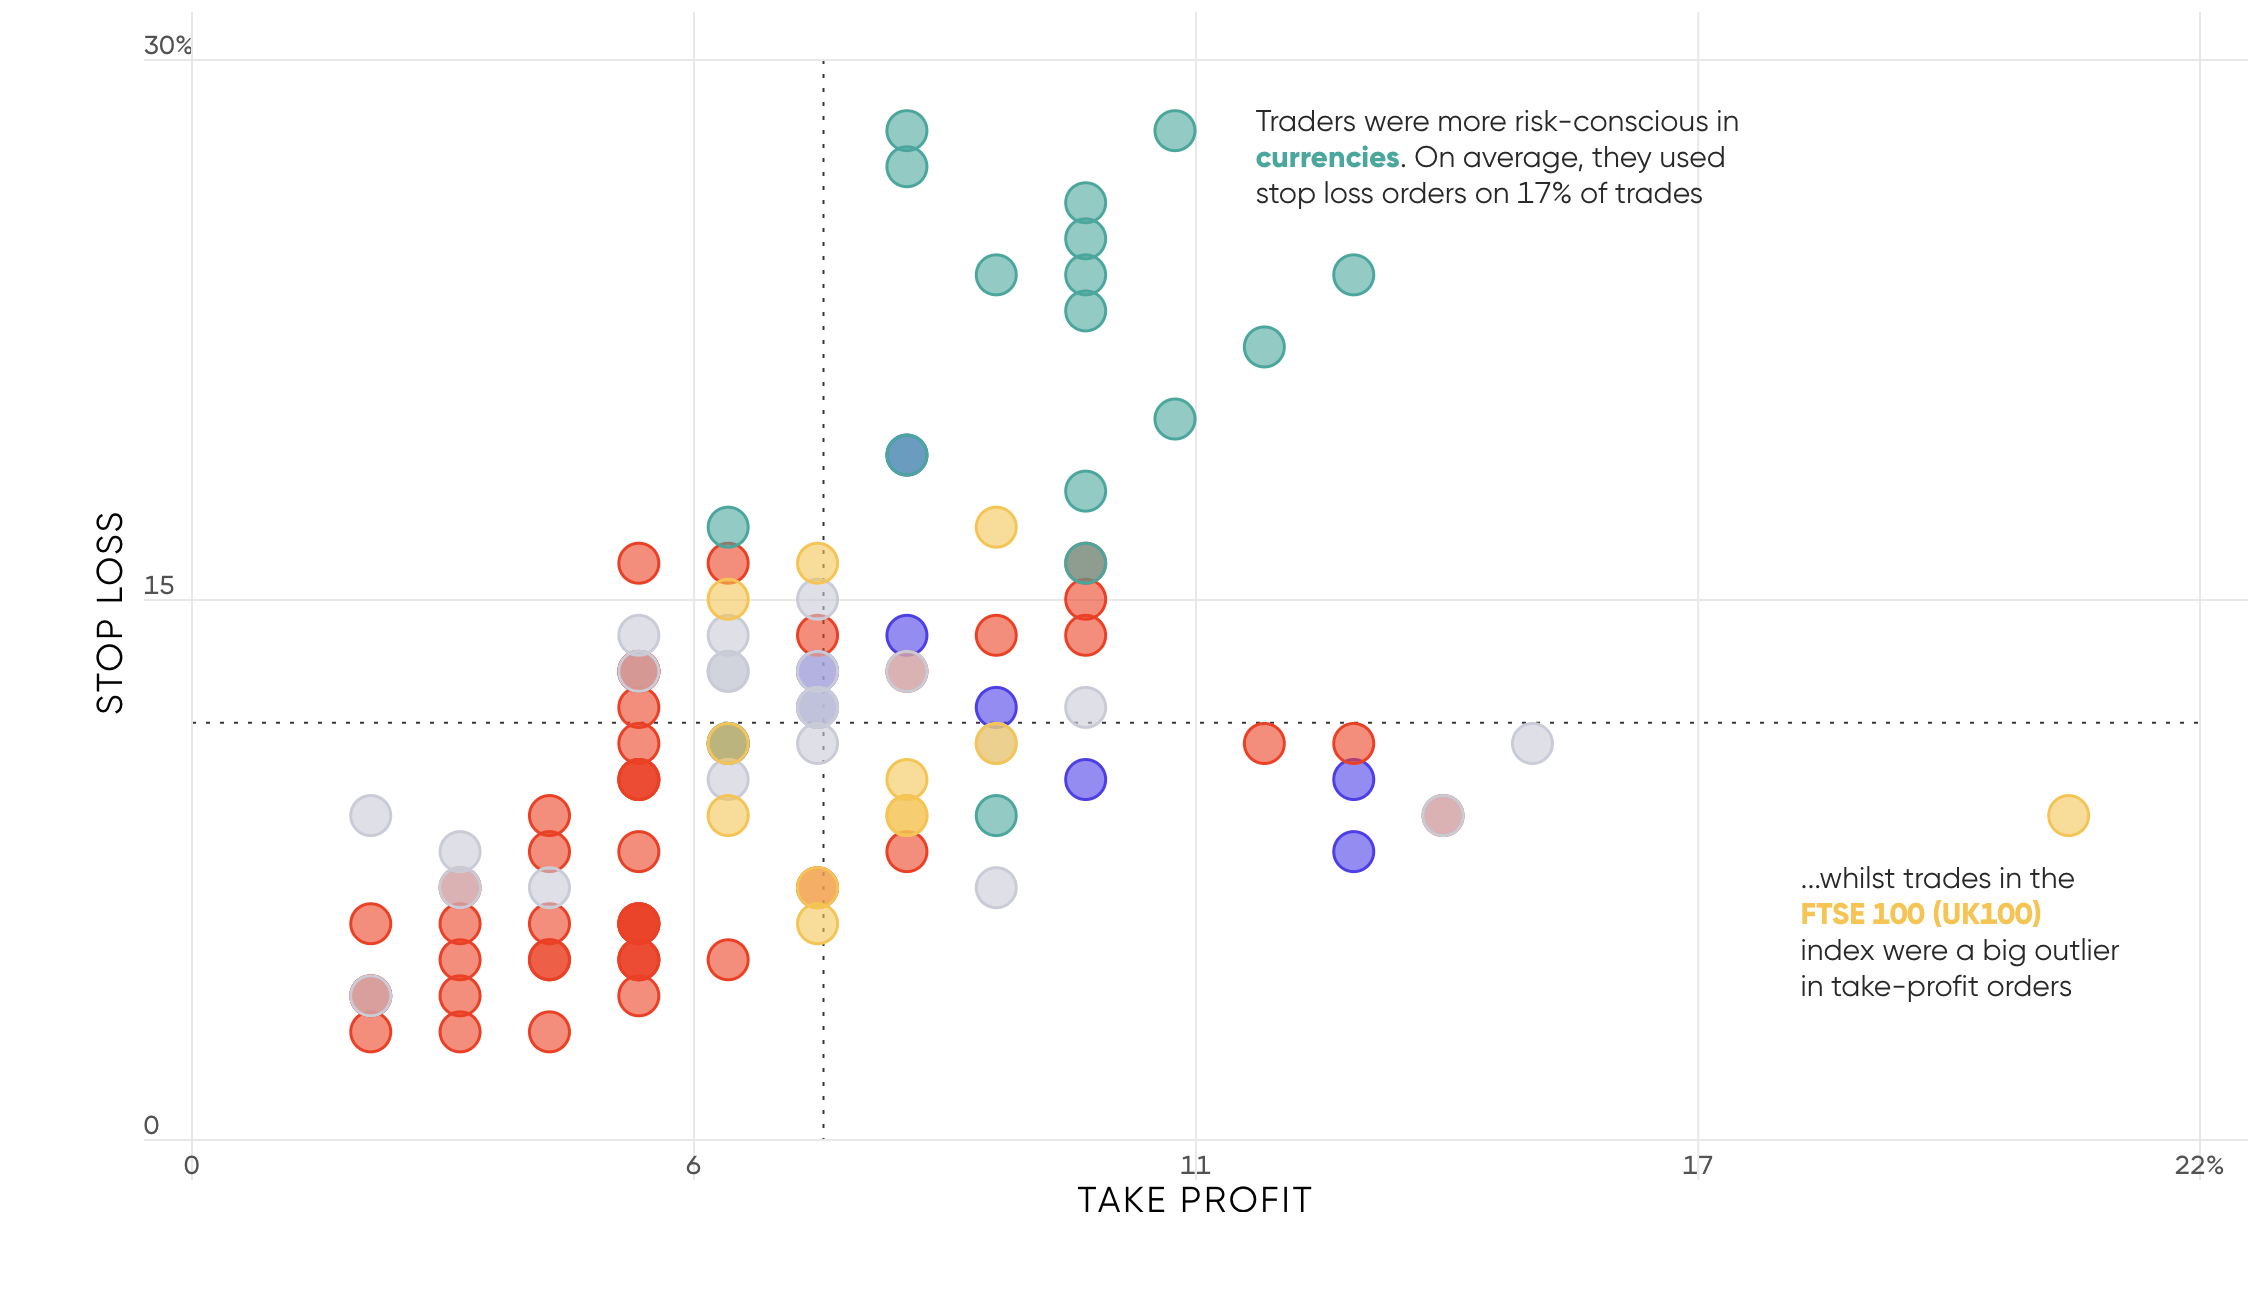
Use of take-profit and stop-loss orders
Take-profit and stop-loss orders can be valuable tools for traders. During 2021, there was a decline in the use of these risk management tools among Capital.com group traders. Since then there has been a sustained effort to provide guidance, education and training to traders, which has seen the decline halted and risk management tools become more popular in the last quarter.
Stop loss
Capital.com group traders’ use of stop-loss orders declined from 14% of trades to 8% between 2019 and Q2 2021. Since Q3 2021 usage has been slowly increasing, and in Q2 2022 some 11% of trades were covered by a stop-loss order. One area where traders were particularly risk-conscious was in currencies, where traders used stop loss orders on 17% of trades.
The three Capital.com group instruments with the highest use of stop losses in Q2 were all currency pairs: USD/CHF (24% of trades had a stop loss), EUR/AUD (24%) and USD/CAD (24%). The three instruments with the lowest use of stop loss were all cryptocurrency CFDs.
Take profit
The use of take-profit orders also declined in 2021, to 8% of trades in Q4 2021 and Q1 2022. In the latest quarter it climbed slightly to 9%. Take-profit orders are most often used by traders in commodities (11%) and least often by traders in equities (6%).
Trades in the FTSE 100 (UK100) index were a big outlier in take-profit orders, at 21% usage. Other instruments with high use of take-profit orders were Tesla stock CFD (TSLA, at 15%) and Snap stock CFD (SNAP, at 14%).
The FTSE 100 (UK100) saw the highest take profit usage across all markets
Percentage of stop loss and take profit in Q2, 2022.
Traders shorted the Nasdaq 100 as volatility spiked
The Nasdaq 100 index (US 100), which is made up of the most valuable technology companies in the United States, has had its second-worst quarter in 20 years and the worst quarter since the global financial crisis of 2008, losing nearly 20% in the past three months.
At the end of the first semester, the Nasdaq 100 (US 100) had lost around one-third of its highest value reached in November 2021. Prior to this, no other major stock index had outperformed the Nasdaq 100 (US 100) during the Covid-19 pandemic, as an unprecedented monetary stimulus drove up technology company valuations.
The Nasdaq 100 (US 100) suffered a heavy blow when the Federal Reserve reversed course this year and announced aggressive interest-rate hikes to tackle four-decade high inflation.
Nonetheless, increased market volatility has not deterred retail traders from trading tech stocks, and the Nasdaq 100 (US 100) was the most traded instrument on our platform in the second quarter, overtaking oil, which had dominated in the first quarter of the year.
The Nasdaq 100 has seen a tremendous surge in interest in both long and short trades, with the latter seeing a higher increase in volumes in the quarter.
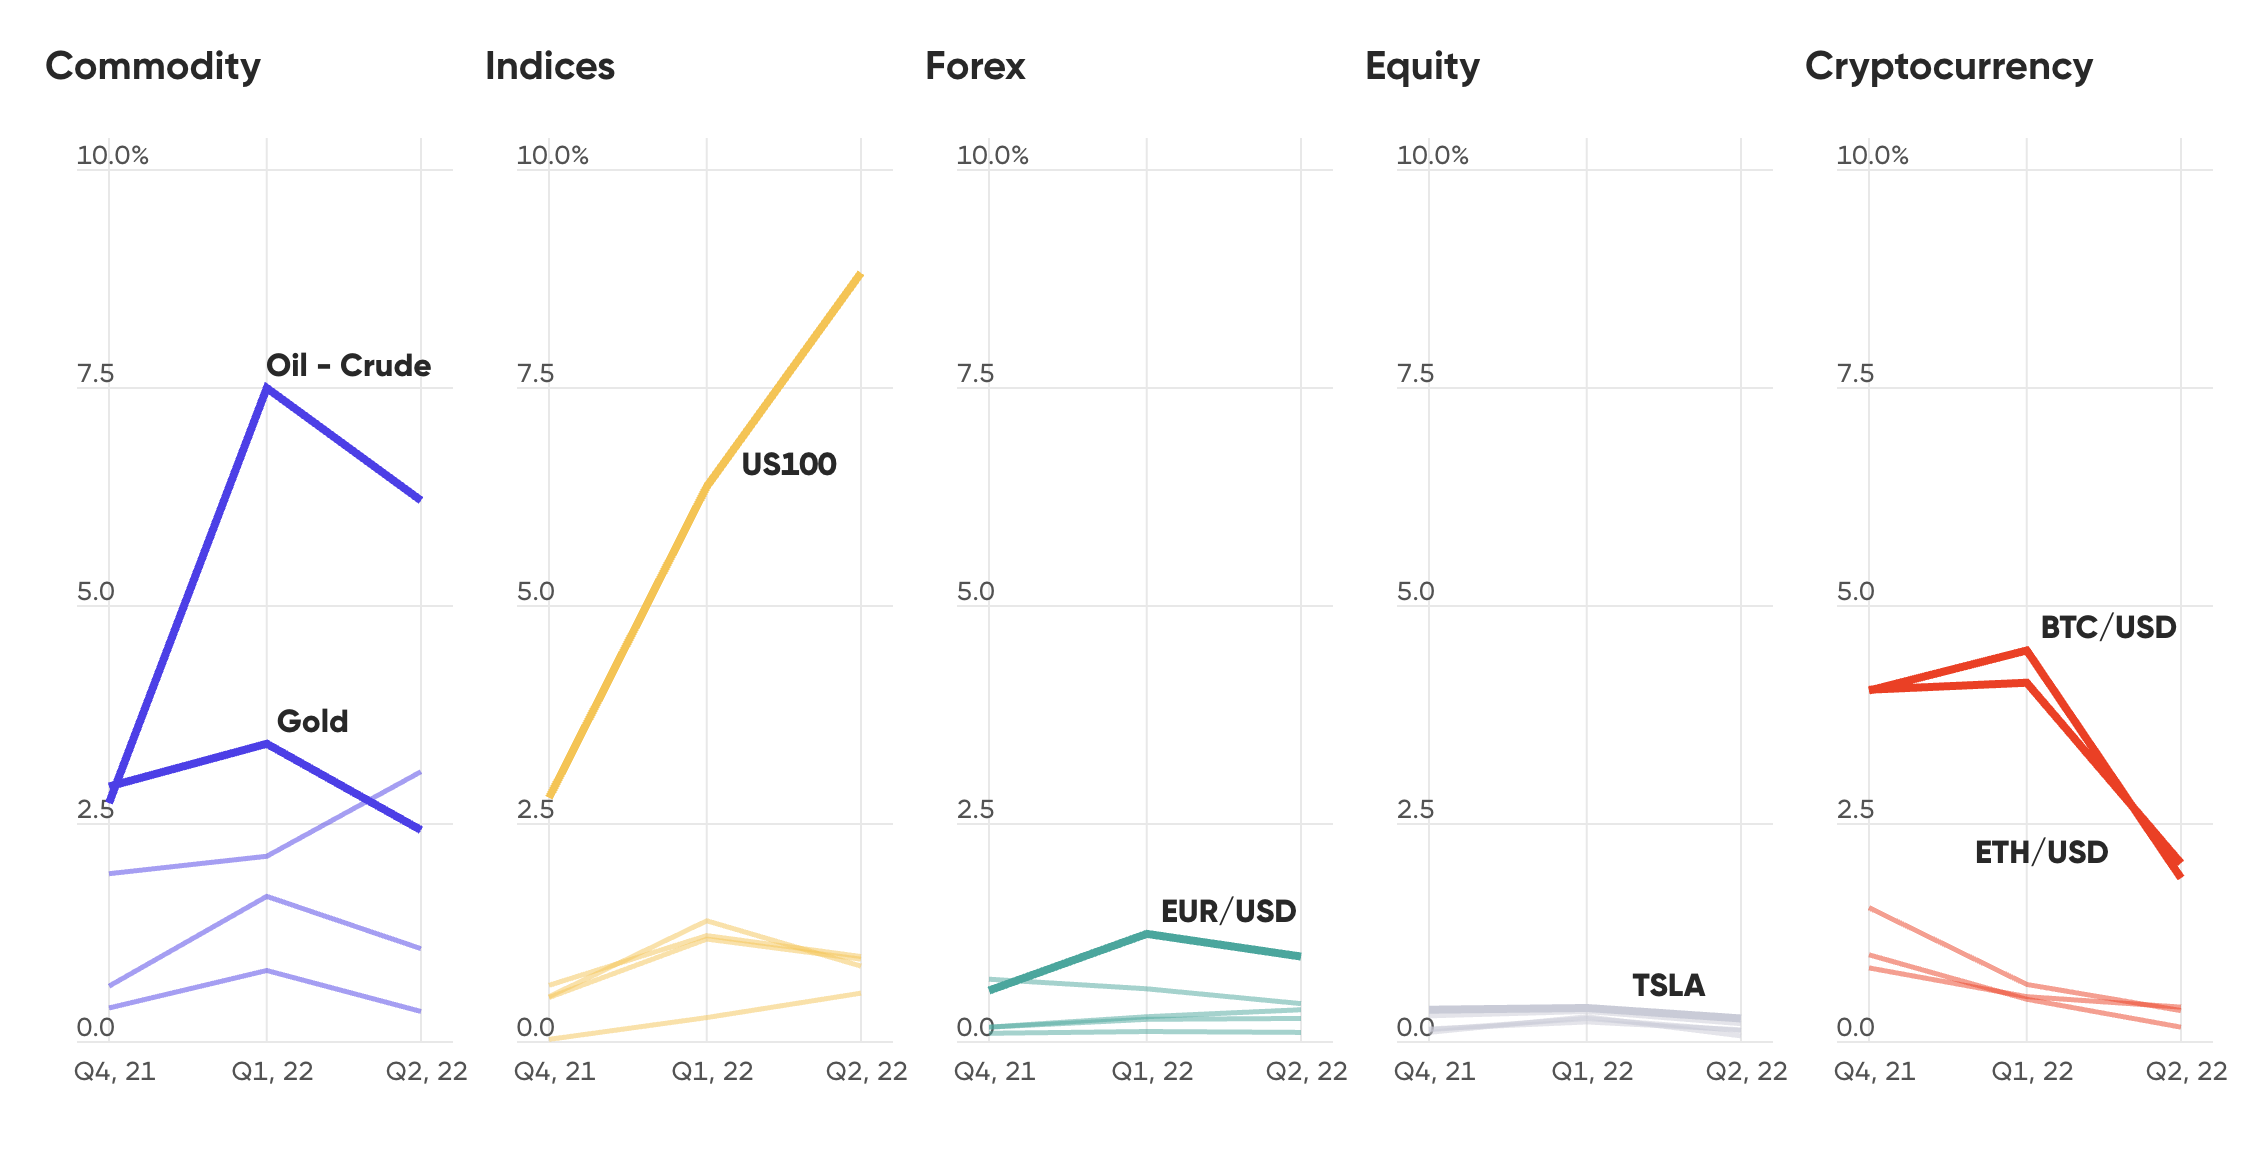
Trades of the Nasdaq 100 (US100) index are accelerating
Monthly percentage of total trades for top 5 instruments per market.
While Nasdaq 100 (US 100) bulls marginally declined from 22,190 to 21,943 during the quarter, bears surged to 15,196 from 14,151. The number of traders shorting the Nasdaq 100 index (US 100) is now 80% higher than in the fourth quarter of 2021.
Short positions also recorded a higher percentage of profits (33.7%) than long positions (32.6%), confirming the trend already observed in the previous quarter.
Flight from Oil
Will benchmark crude oil rates drop over the next three months? Capital.com group traders believe they may, as is evident from the increase in short positions in the quarter through to June.
Crude oil short positions increased in the three months through 30 June. In Q2 41% of all oil traded on the Capital.com group platform were short, up from 35% in Q1.
Oil has rocketed more than 500% from its lows in April 2020 and the global commodity index (S&P GSC) has more than doubled its value.
Has crude oil peaked?
A global commodities supercycle is defined as a synchronised and sustained price increase lasting more than five years, such as the one that occurred in the early 2000s and concluded with the 2008 financial crisis.
The current oil supercycle has delivered a 511% return from April 2020 to the end of June 2022, according to Capital.com’s analysis. Such a performance has not been seen since the end of the last crude supercycle from 2002 to 2008.
Capital.com analyst Piero Cingari comments:
Oil trades have declined
Crude oil trading volumes on Capital.com are down 22% in the quarter ended 30 June, data shows. Global benchmark Brent’s trading volumes are also down, by 36% quarter on quarter, following the first quarter spike in late February/early March 2022.
This massive, temporary increase in oil trading is depicted in the chart below.
Interest in crude oil is declining
Monthly percentage of total trades.
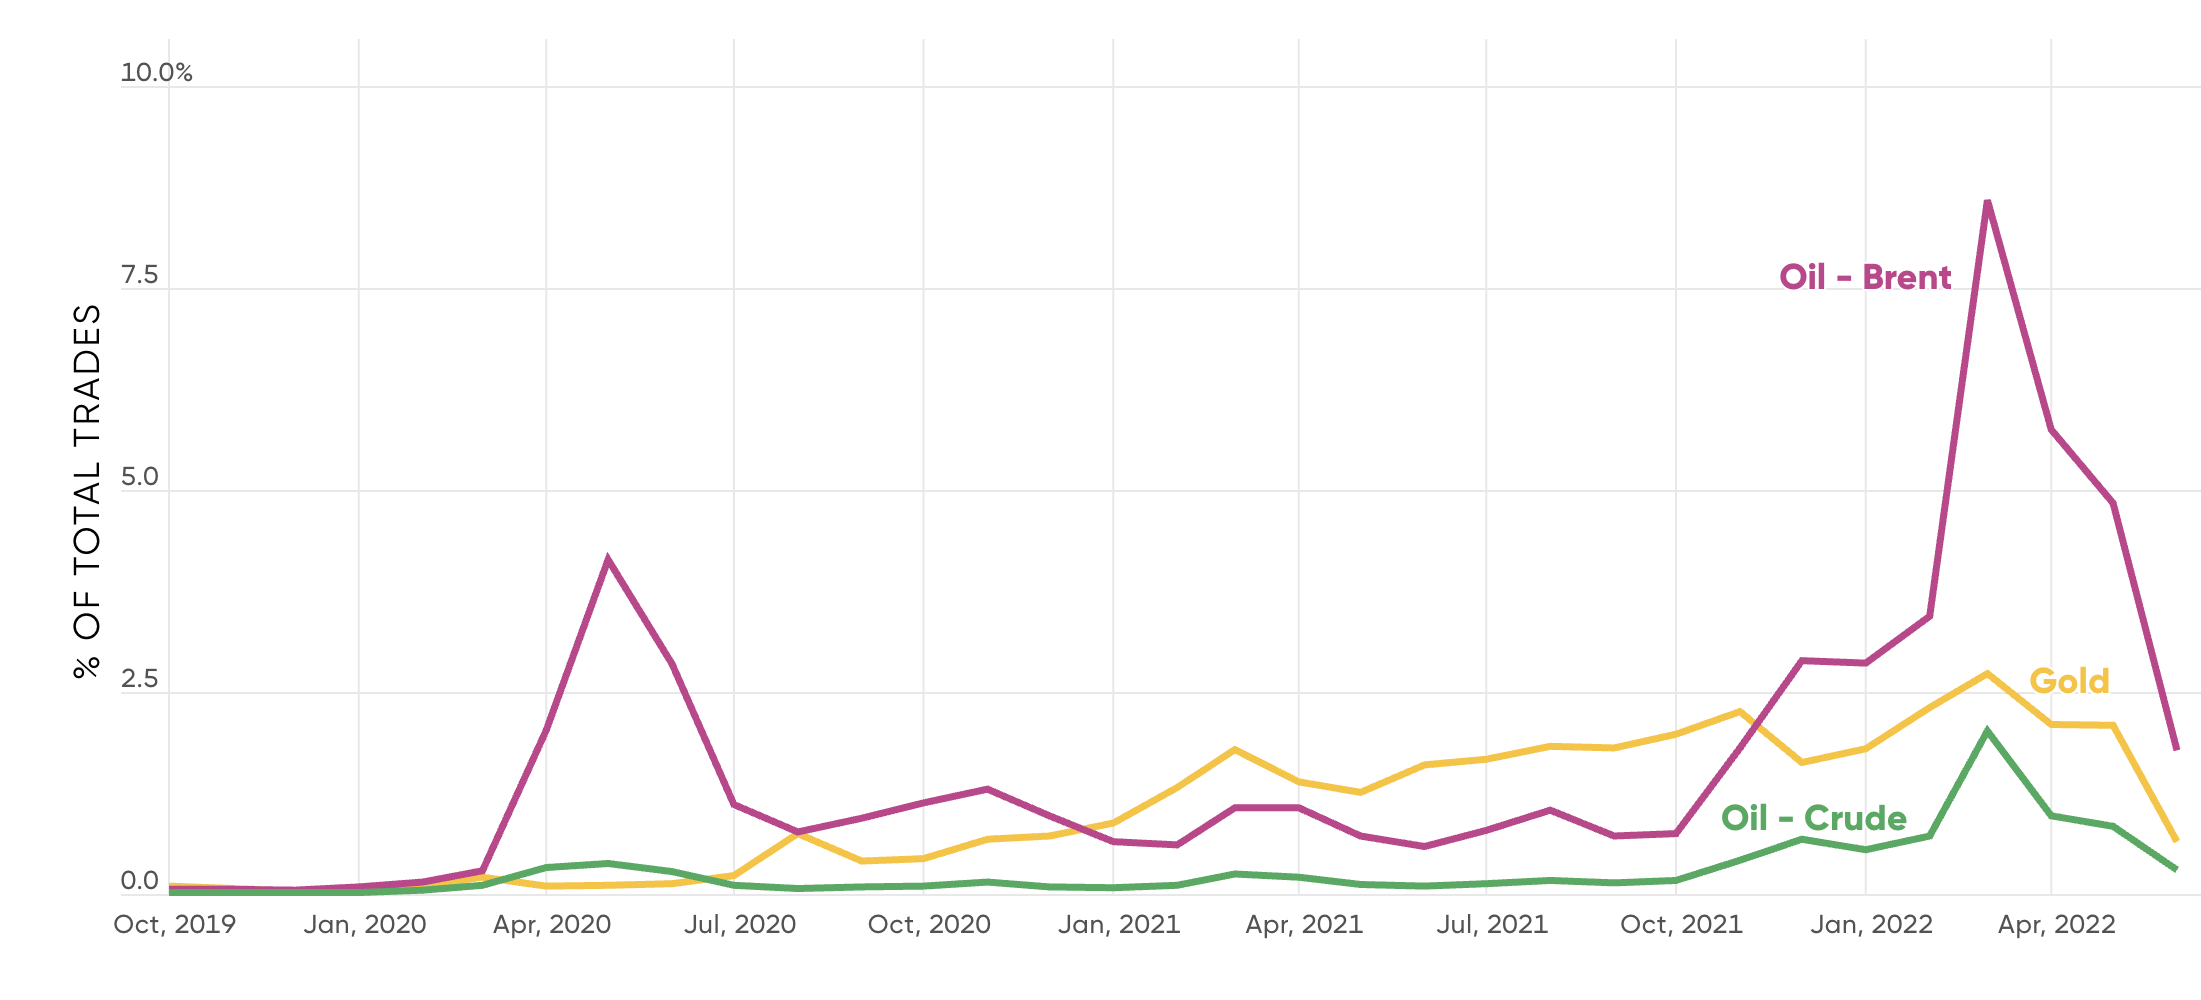 Total oil trades during the first quarter surged to more than 2.5 million, Capital.com group data shows, suggesting that investors jumped into crude oil in droves as market response to the Russian invasion of Ukraine proved explosive.
Gold in comparison
Trading activity for gold did not increase as dramatically as for oil since the start of this year, as can be seen in the chart above.
Geo-political tensions typically boost the yellow metal’s safe-haven standing. However, the precious metal has lagged in the global commodity price rise since the coronavirus pandemic.
Gold rates have appreciated by just 5% by the end of June, compared with April 2020’s prices. It has also performed worse than in previous super cycles, most notably, the one witnessed from 2002 to 2008.
Scepticism on the Dollar
Although a contrarian view, there was a significant increase in the volume of short selling on the dollar index (DXY), suggesting many Capital.com group traders believed dollar strength was reaching – or had reached – a peak.
Volumes on short DXY increased by 10% in the second quarter compared to the first three months, and the percentage of short trades increased by 10% to 39%.
Short selling profitability on the DXY was 21% – a reasonable result considering the upward direction of the US currency for much of the quarter – but paling beside the 34% profitability of shorting the euro (EUR/USD) or the Nasdaq 100 (US100).
So, what likely prompted this response? Shorting the dollar against yen, euro and sterling looked like one-way bets for much of the quarter.
Shorting of USD/JPY is rising
Percentage of short positions.
Nothing goes one-way forever
Jones adds that whilst selling short a market like this is going against the major trend, and the less stressful trade has been to go long on the dollar, no market runs in one direction forever.
Could the dovish BoJ pivot?
So, what of the yen? Bank of Japan (BoJ) governor Kuroda has remained steadfast against tightening monetary policy as inflation is benign in Japan compared with the US, where the Fed has embarked on its aggressive rate hike cycle.
But more recently, the 'one-way' upward movement in USD/JPY has periodically stalled. This happened during most of May as fears grew that the Fed’s aggressive tightening policy could throw the US economy into recession.
Between 2 May and 25 May, the dollar fell back nearly 2% against the yen. On 2 May, it might have looked like the dollar had topped, but by the end of the month the dollar was back in the ascendency.
And, indeed, speculation against the yen was popular during the quarter: Capital.com group data showed that all regions in its survey had a currency pair as most-shorted instrument, and for all regions – except UK and Africa – this was the US dollar versus the Japanese yen.
But, that's not to say shorting the dollar is a bad move. Much of the Fed's well-signposted future rate hikes are likely priced in by markets. Any future hawkish pivot from the Bank of Japan, therefore, could drive the yen higher in the coming months.
The joke carries on for memecoins
The dog-themed cryptocurrency, DogeCoin (DOGE), which started out as a joke by two software engineers in 2013, has turned into something much more serious. Data from Capital.com’s online brokerage platform in Q2 shows that retail traders are continuing to back it, and similarly canine-themed rival Shiba Inu (SHIB).
SHIB burst on the scene in 2020, casting itself as the ‘DOGE Killer’. When its value soared by 400% in just one week in April last year it sparked an explosion of – mainly dog themed – rivals. The total number of memecoins stood at 134 by October 2021, according to CoinMarketCap.
Baby Doge Coin, the meta-titled Dogeelon Mars, Corgi Coin and Goat Coin all attempted to surf the memecoin wave but ended up battling over the scraps, with DOGE and SHIB the clear leaders of the pack. DOGE has slipped back from its peak 12 months earlier when it had a market capitalization of more than $85bn and sat firmly in the list of the top five coins. Since then overall market interest in memecoins has waned.
According to data from CoinMarketCap, DOGE has slipped to 13th place while SHIB is at 17th. Capital.com group traders, however, have continued to favour the pair. Platform data shows that Capital.com group traders decreased their exposure to ETH and BTC while levels for DOGE and SHIBA trades were at similar levels in the second quarter, compared with the first three months of 2022. This shows that across all crypto trades, preference has shifted towards DOGE and SHIB.
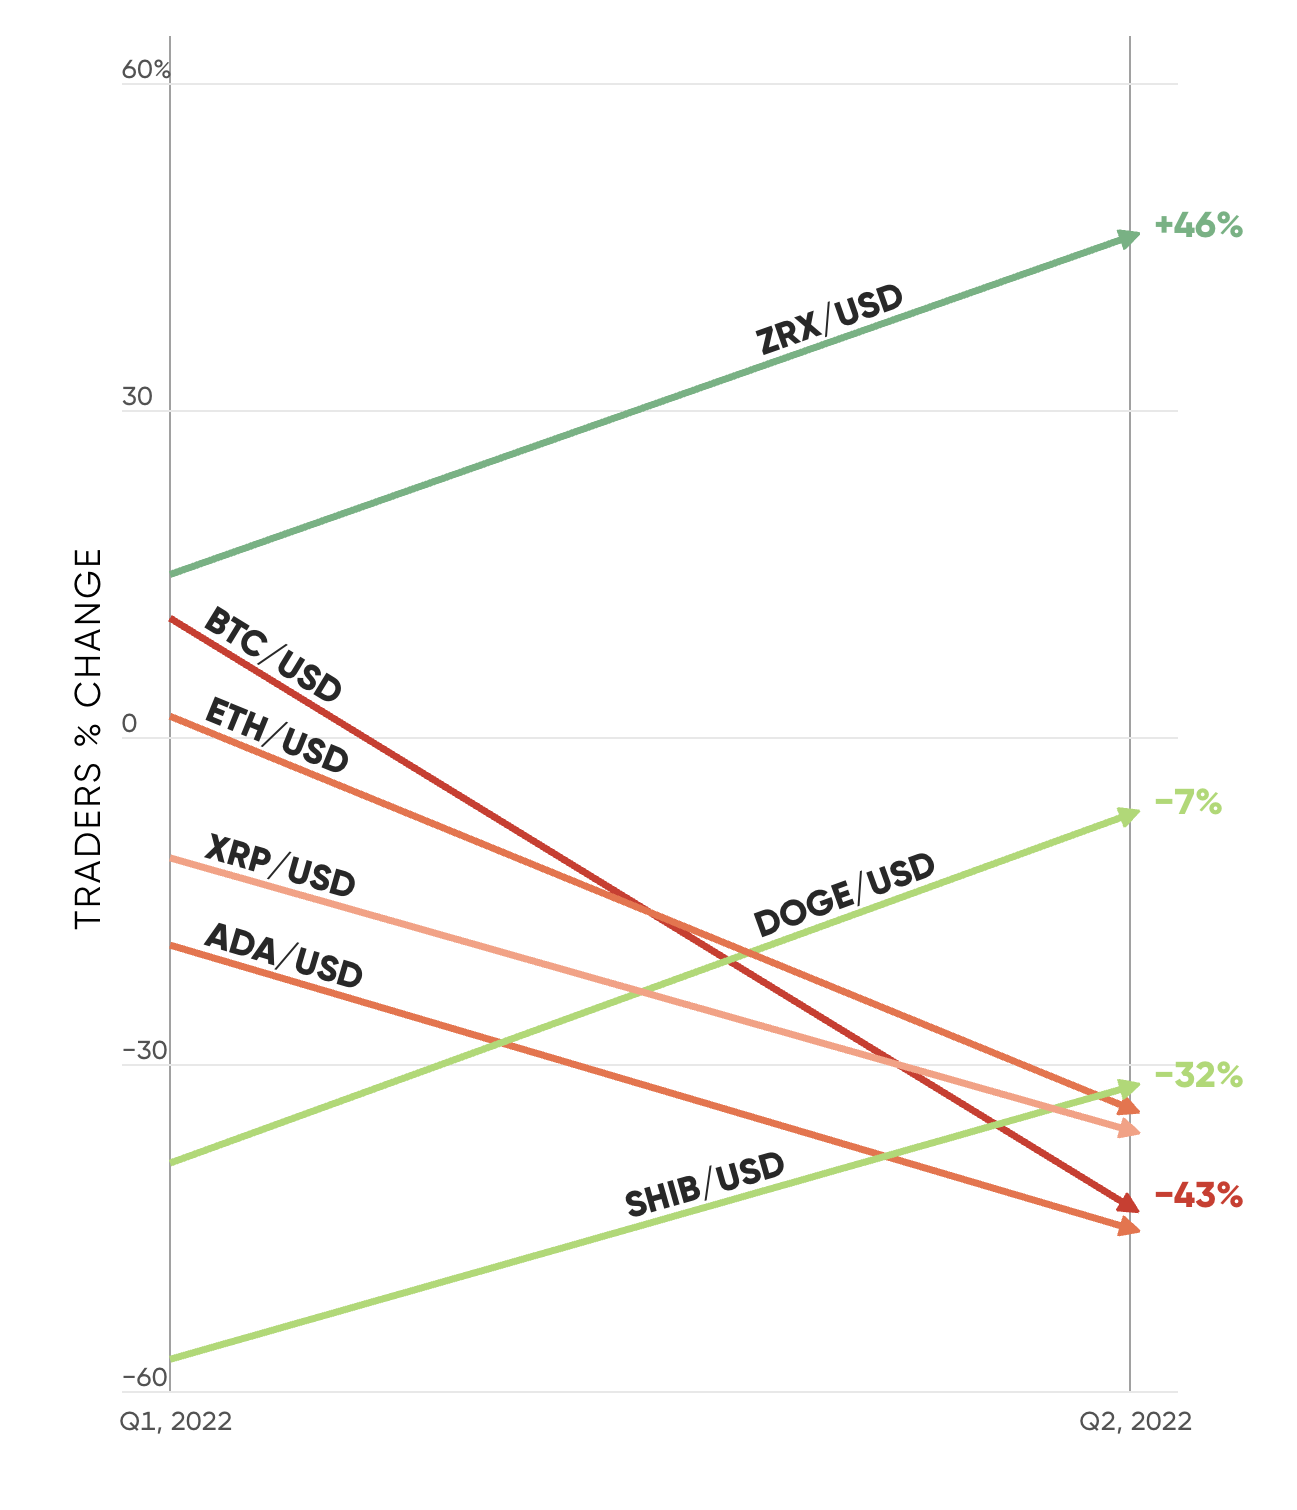
ZRX/USD shows biggest increase in traders this quarter
Traders percentage change from the previous quarter. Including data for the top cryptocurrency instruments by the number of trades in the last 3 quarters.
Musk boosts DOGE (again)
DOGE again received a boost from Musk on 25 April, when its price jumped 13% in a day following reports that he was aiming for a $43bn hostile takeover of Twitter and rumours circulated that the token would then be accepted by the social media giant. Given the nature of the memecoin sector it is unsurprising that Musk’s intervention drove a spike of +383% increase in memecoin traders on Capital.com’s group platform that day.
More intriguingly Capital.com group traders increased their exposure to both meme tokens following the early May collapse of the Terra network, as both the algorithmic stablecoin UST and its associated token Luna saw their value evaporate.
The so-called stablecoin UST had a market capitalization of $18bn on 7 May but despite each unit of the token supposedly being pegged at one dollar its value started to collapse. Two days later it was changing hands at 35 cents a go, before essentially becoming valueless. Simultaneously Luna fell from $80 to a handful of cents by the middle of May.
LUNA crash lifts meme coins
The reverberations of UST and LUNA’s collapse are still being felt across the crypto sector. Bitcoin’s price has fallen back some 55% from its November 2021 peak while its nearest rival ETH is trading just over $1,100 compared with a maximum value of close to $5000.
But as the market got serious Capital.com’s group traders showed persistent interest in more frivolous crypto projects. Capital.com group data shows that since 7 May our traders have maintained their relative exposure to SHIB and DOGE. An outlier is ZRX, the only popular crypto coin with a major increase of 46% in active traders during Q2.
DOGE may indeed have started as a joke but it can process transactions ten times faster than bellwether crypto bitcoin, and it and SHIB are both still in the top twenty digital tokens by market cap. They have certainly captured the attention of Capital.com group’s traders.
Beyond bitcoin
While bitcoin is the biggest crypto by far with a market capitalization (as of 24 June) just shy of $400bn, Capital.com group traders are showing similar interest in rival ethereum since Q1 2022.
Whether it's the smart contract potential of the younger crypto or greater faith in the ETH’s Ethash algorithm versus BTC’s SHA-256, BTC trading volume has decreased by 20% from Q1 to Q2 2022 - while ETH and altcoins increased by 11% and 8% respectively.
Conclusion
Data from the second quarter of 2022 offers some key insights into the behaviour of Capital.com’s global retail traders during a period of exceptional upheaval. The period has been marked by supply chain shocks from the war in Ukraine and lockdowns in China, and swingeing rate hikes from the central banks in charge of some of the world’s major economies. Inflation around the world has reached multi-decade highs, and there is speculation that recession and stagflation may soon be widespread.
But questions have increasingly arisen as to whether there can be further movement from these events. Can the dollar really keep going up? Will oil prices remain high?
The world’s retail traders swiftly lost interest in crude oil following the huge impacts of the first quarter, but seem to consider that there are still opportunities in the world’s other critical fossil fuel – natural gas, which Europe in particular is heavily reliant upon not only as a thermal energy source but for electricity generation.
The third quarter edition of this report will show whether these are enduring trends, or comparatively short term ones.
About our data
This proprietary report captures data on all executed trades on the Capital.com group platform between 1 April 2022 and 30 June 2022.
General
Traders active in multiple markets contribute to each market’s total number of traders.
Sentiment is based on the percentage of short positions for a given market or instrument.
Technology and cloud-based stocks are filtered by market cap as specified by Finviz.
Markets
Product types include CFD, stockbroking and spread betting (available for FCA clients) unless stated otherwise.
Markets covered include CFDS on commodities, cryptocurrencies, currencies, indices and equities.
Demographics
Regions are determined by the registered location of residence. Inaccurate data is corrected within 14 days by Capital.com group.
Regions covered include Africa, Asia, Australia, Latin-America, Middle East, Europe, North-America and the United Kingdom.
Profitability
Trades of less than $1 are excluded from the calculations
Profitability represents the percentage of profitable trades by realised profit/loss excluding any adjustments following the transaction