

Gold struggles as oil rebounds: yields, Fed policy and geopolitics
Geopolitics, rising yields, and Federal Reserve policy are shaping the outlook for gold and oil.
Gold and crude oil are currently telling two very different stories about the macro backdrop. Gold remains under pressure near $4,100–4,150, weighed down by elevated Treasury yields, a firm dollar and a Federal Reserve that remains reluctant to declare victory over inflation. Brent, meanwhile, has climbed back above $100, with renewed attacks on shipping in the Gulf rebuilding part of the geopolitical premium that had faded as US-Iran negotiations showed signs of progress.
Gold: safe-haven demand vs yields
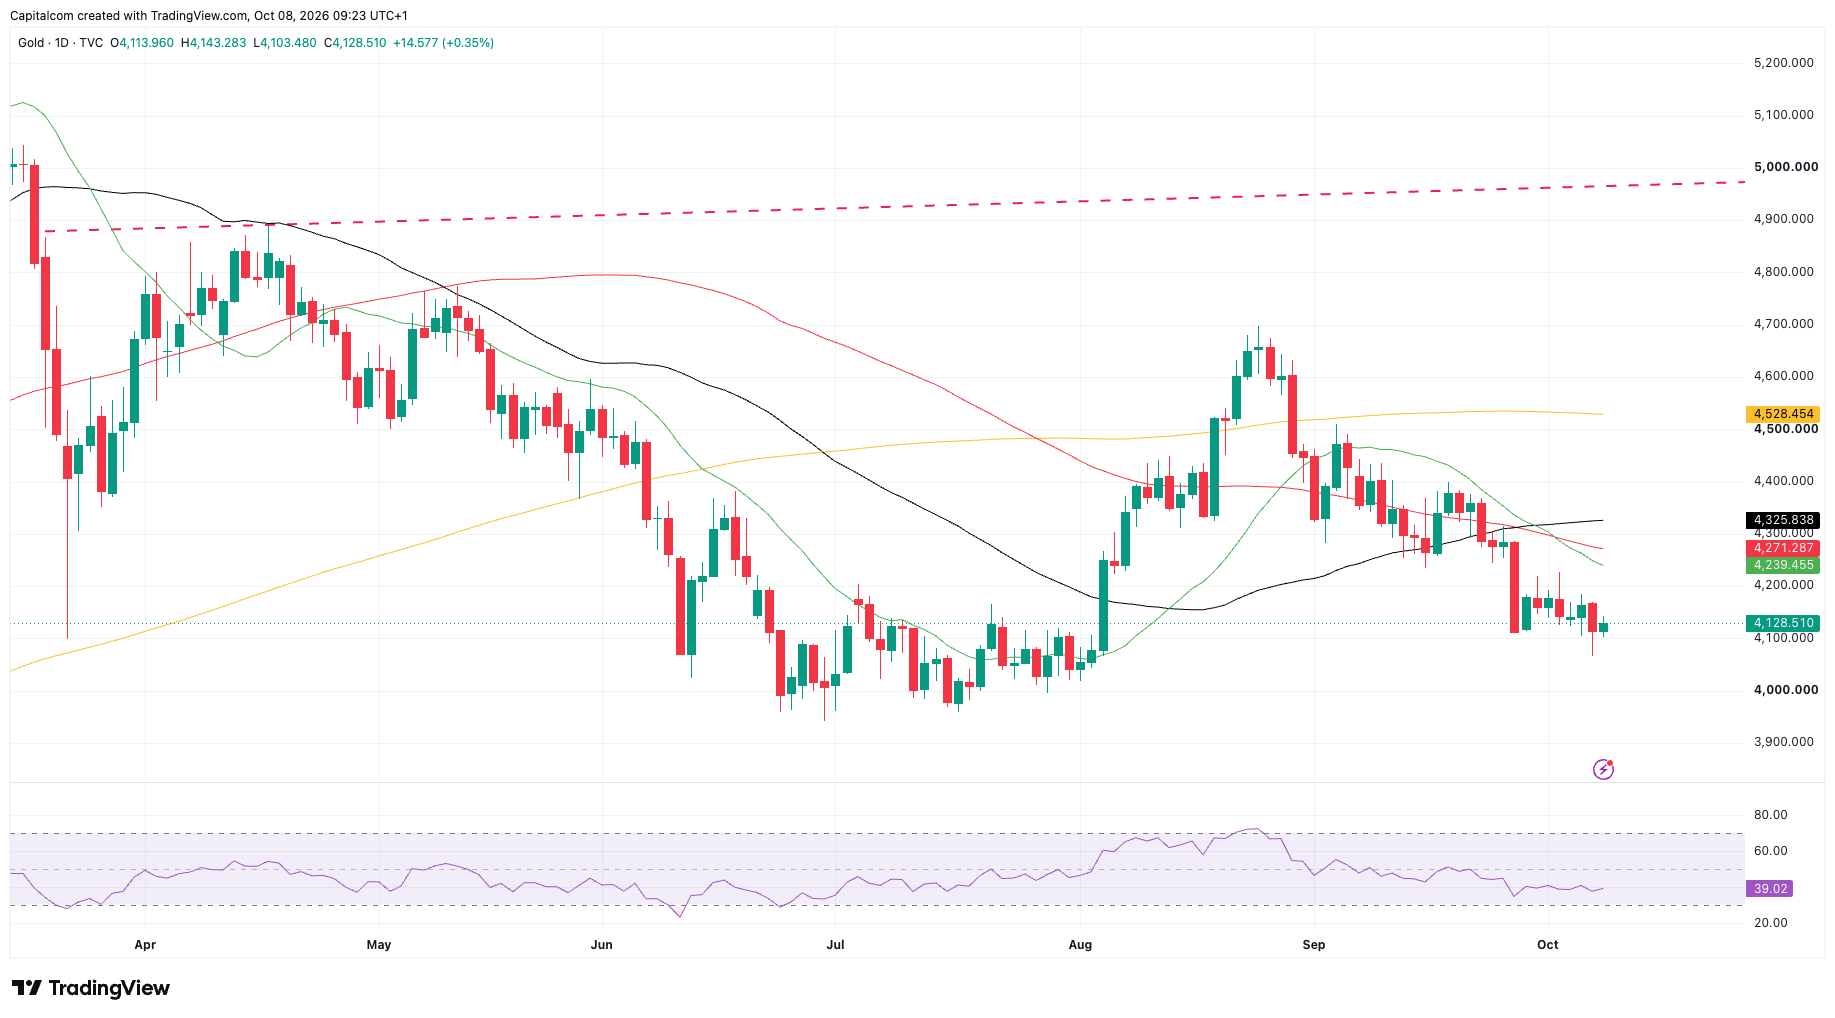
Gold has struggled to find sustained support despite an increasingly complicated geopolitical backdrop. Prices are trading around $4,130, close to their lowest levels since August and significantly below the late-August peak around $4,650.
The main problem is the bond market. The US 10-year Treasury yield remains around 5.3%, while the 30-year is close to 5.7%. More importantly for gold, real yields are exceptionally high: the Federal Reserve's latest data put the 10-year inflation-indexed yield around 2.9%. That significantly raises the opportunity cost of holding a non-yielding asset such as bullion. For many investors, Treasuries can now fulfil part of the defensive role traditionally occupied by gold while simultaneously offering a substantial real return. That helps explain why geopolitical uncertainty has not translated into the kind of sustained gold rally normally associated with an escalation in the Middle East.
Fed hawkishness adds another headwind. Wednesday's Federal Reserve minutes reinforced the hawkish position. The September meeting produced a unanimous 25bp hike to 3.75–4.00%, and the minutes showed broad agreement that inflation remains too high. The disagreement was less about whether inflation was a problem and more about why rates needed to rise: some policymakers viewed the hike as insurance against energy and other supply shocks, while a more hawkish group worried that price pressures were increasingly becoming demand-driven.
Gold technical outlook
The technical picture reflects that deterioration. Gold is trading below its 20-, 50-, 100- and 200-day moving averages, keeping the broader near-term bias under pressure. RSI is around 39, which points to weak momentum but does not yet signal an extreme oversold condition. The immediate area to watch is $4,100. A sustained break beneath that level could expose the psychological $4,000 area, which provided important support through the summer.
Gold (XAU/USD) daily chart
Past performance is not a reliable indicator of future results.
On the upside, gold first needs to reclaim approximately $4,240–4,270, where several short-term moving averages are clustered. The upside case would become stronger if Treasury yields begin falling materially, the dollar weakens or geopolitical stress intensifies enough to overwhelm the rates headwind. Conversely, another leg higher in real yields would leave $4,000 vulnerable.
Oil: geopolitical risk returns
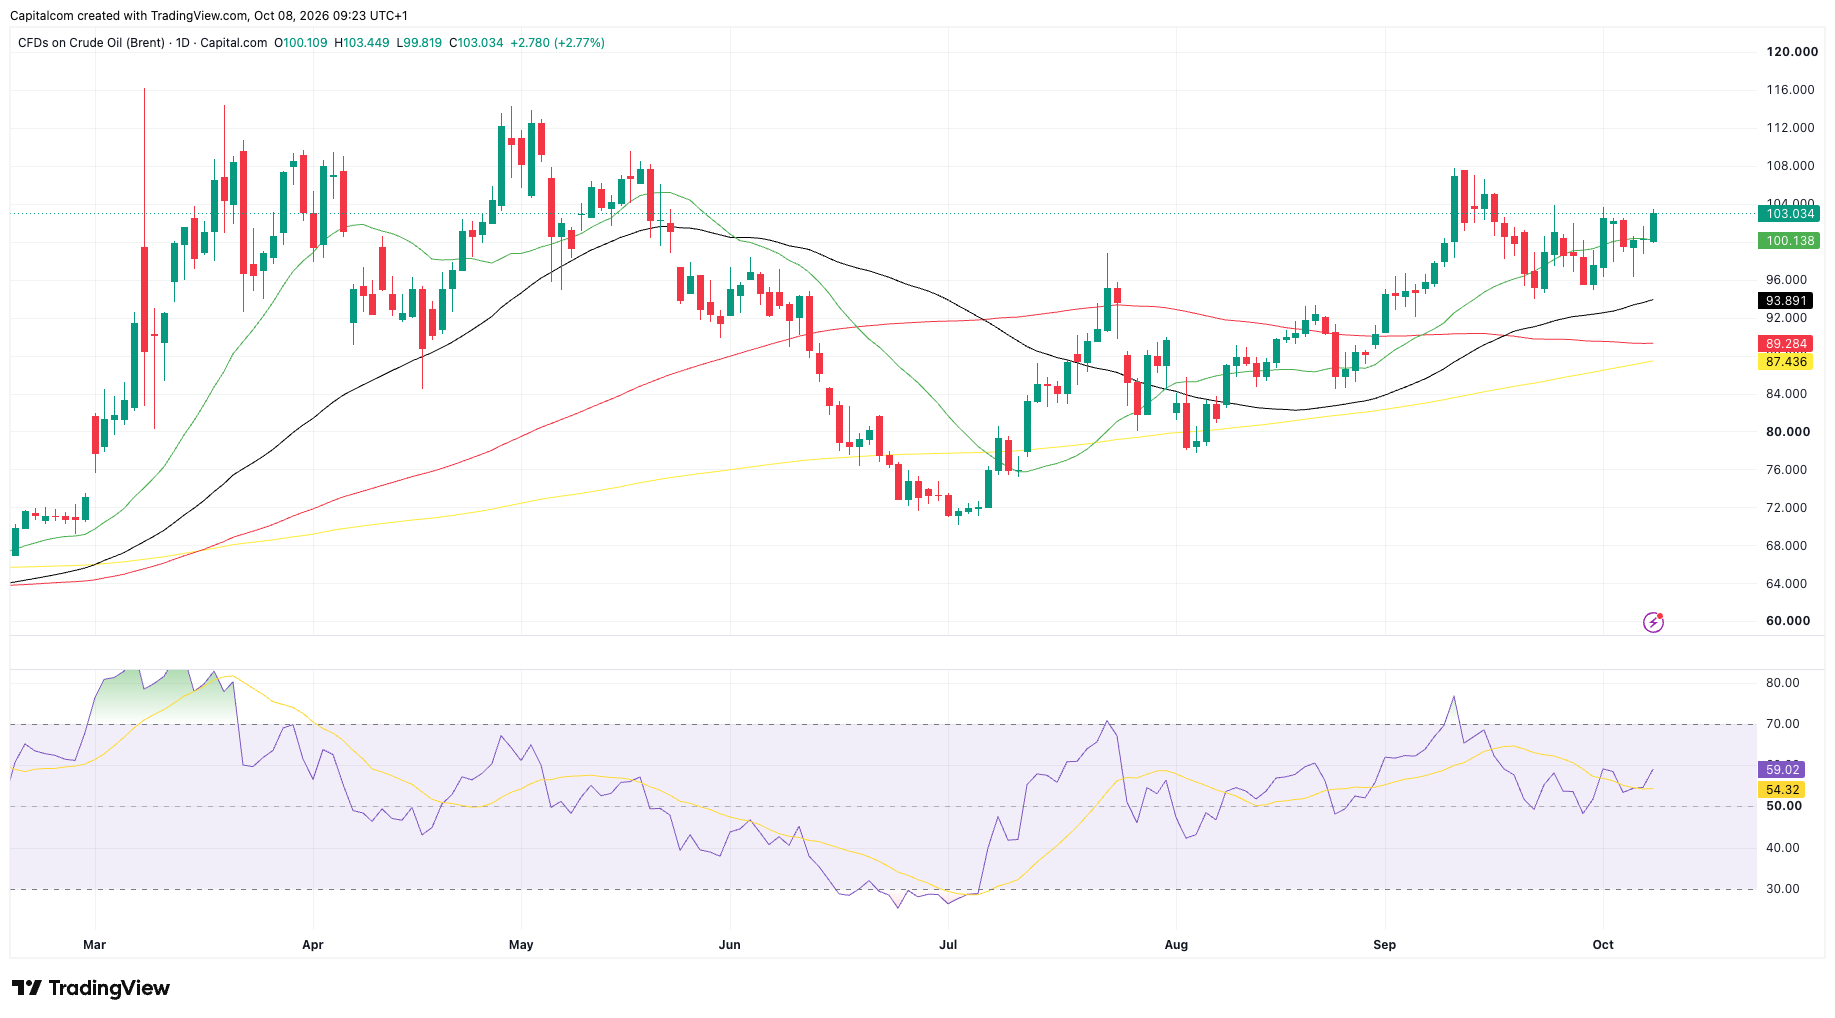
Crude has moved in the opposite direction. Brent is trading back around $103, up sharply as renewed attacks on commercial shipping in the Gulf challenge the assumption that Middle Eastern supply risks were fading. A tanker was struck off Qatar on Thursday, while shipping attacks around the Gulf and Strait of Hormuz have increased significantly. Iran has also threatened alternative routes being used to circumvent restrictions in the Strait.
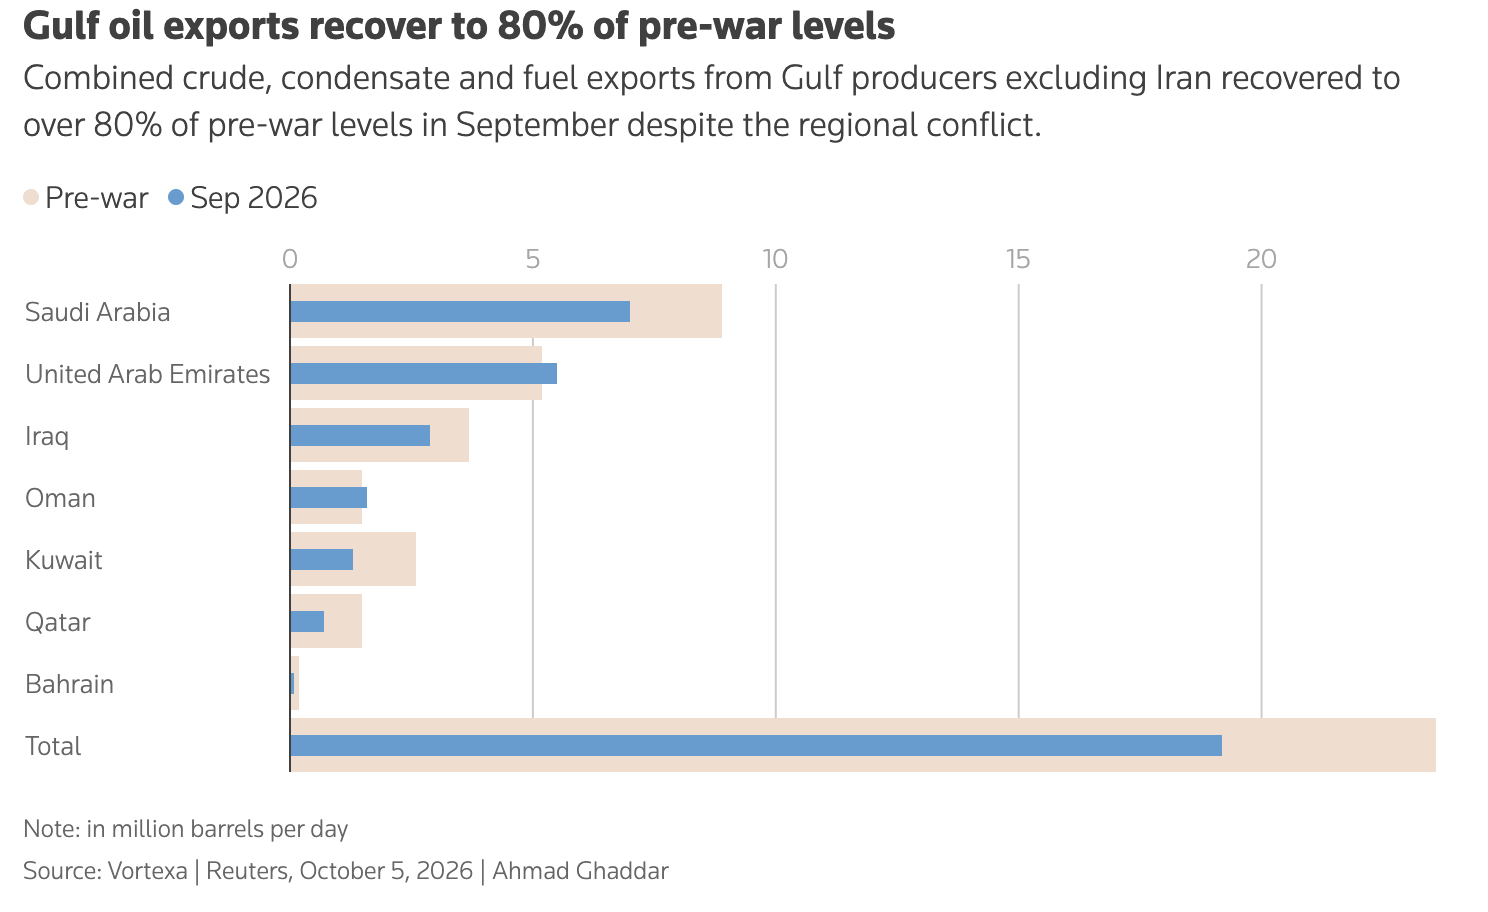
This is a key difference with September, when markets were increasingly focused on diplomatic progress, the reopening of Saudi Arabia's East-West Pipeline and the recovery in physical exports. The diplomatic channel has not disappeared, but the negotiations and physical security are two different things. Even if Washington and Tehran remain engaged, tanker operators, insurers and commodity traders have to price the possibility of further attacks today.
However, Saudi Arabia's East-West Pipeline remains an important alternative to Hormuz, Gulf exports have improved materially from their August lows and emergency stock releases have provided another cushion. The International Energy Agency has also accelerated the release of strategic inventories and prioritised diesel supplies in response to disruptions. That means the physical market is better supplied than it was during the worst phase of the conflict. This is probably why Brent is trading around $103 rather than returning immediately towards the $110–115 region seen earlier this year. The market is pricing renewed disruption risk, but it is not yet pricing a complete breakdown in Gulf supply.
Oil technical outlook
Price is trading above all of the major moving averages and the RSI around 59 indicates positive momentum without suggesting the market is excessively overbought. The immediate upside area is around $104–105. A sustained move through that region could reopen the September highs near $107–108, followed by the more significant $110–112 zone. On the downside, $100 remains the obvious first support level.
Brent crude daily chart
Past performance is not a reliable indicator of future results.
What to watch next
For gold, the most important variables remain real yields, the dollar and the Fed's reaction function. Another deterioration in inflation data or a further increase in long-term Treasury yields would keep the metal under pressure. Softer inflation, weaker economic data or a meaningful pullback in yields would provide a much cleaner bullish catalyst.
For oil, the focus remains overwhelmingly geopolitical. The key questions are whether attacks on tankers intensify, whether flows through Hormuz continue recovering and whether diplomacy between Washington and Tehran produces anything tangible.