GBP/USD tests 2024 highs as momentum consolidates
GBP/USD consolidates further towards 2024 highs as the dollar struggles to attract buyers as tariff uncertainty continues
GBP/USD delivered another strong performance on Monday, rallying over 1% to reach 1.3443, testing its highest levels since September 2024. Back then, a wave of U.S. dollar strength triggered a sharp three-month decline in the pair, dragging it down to 1.21 before a recovery began at the start of this year.
GBP/USD daily chart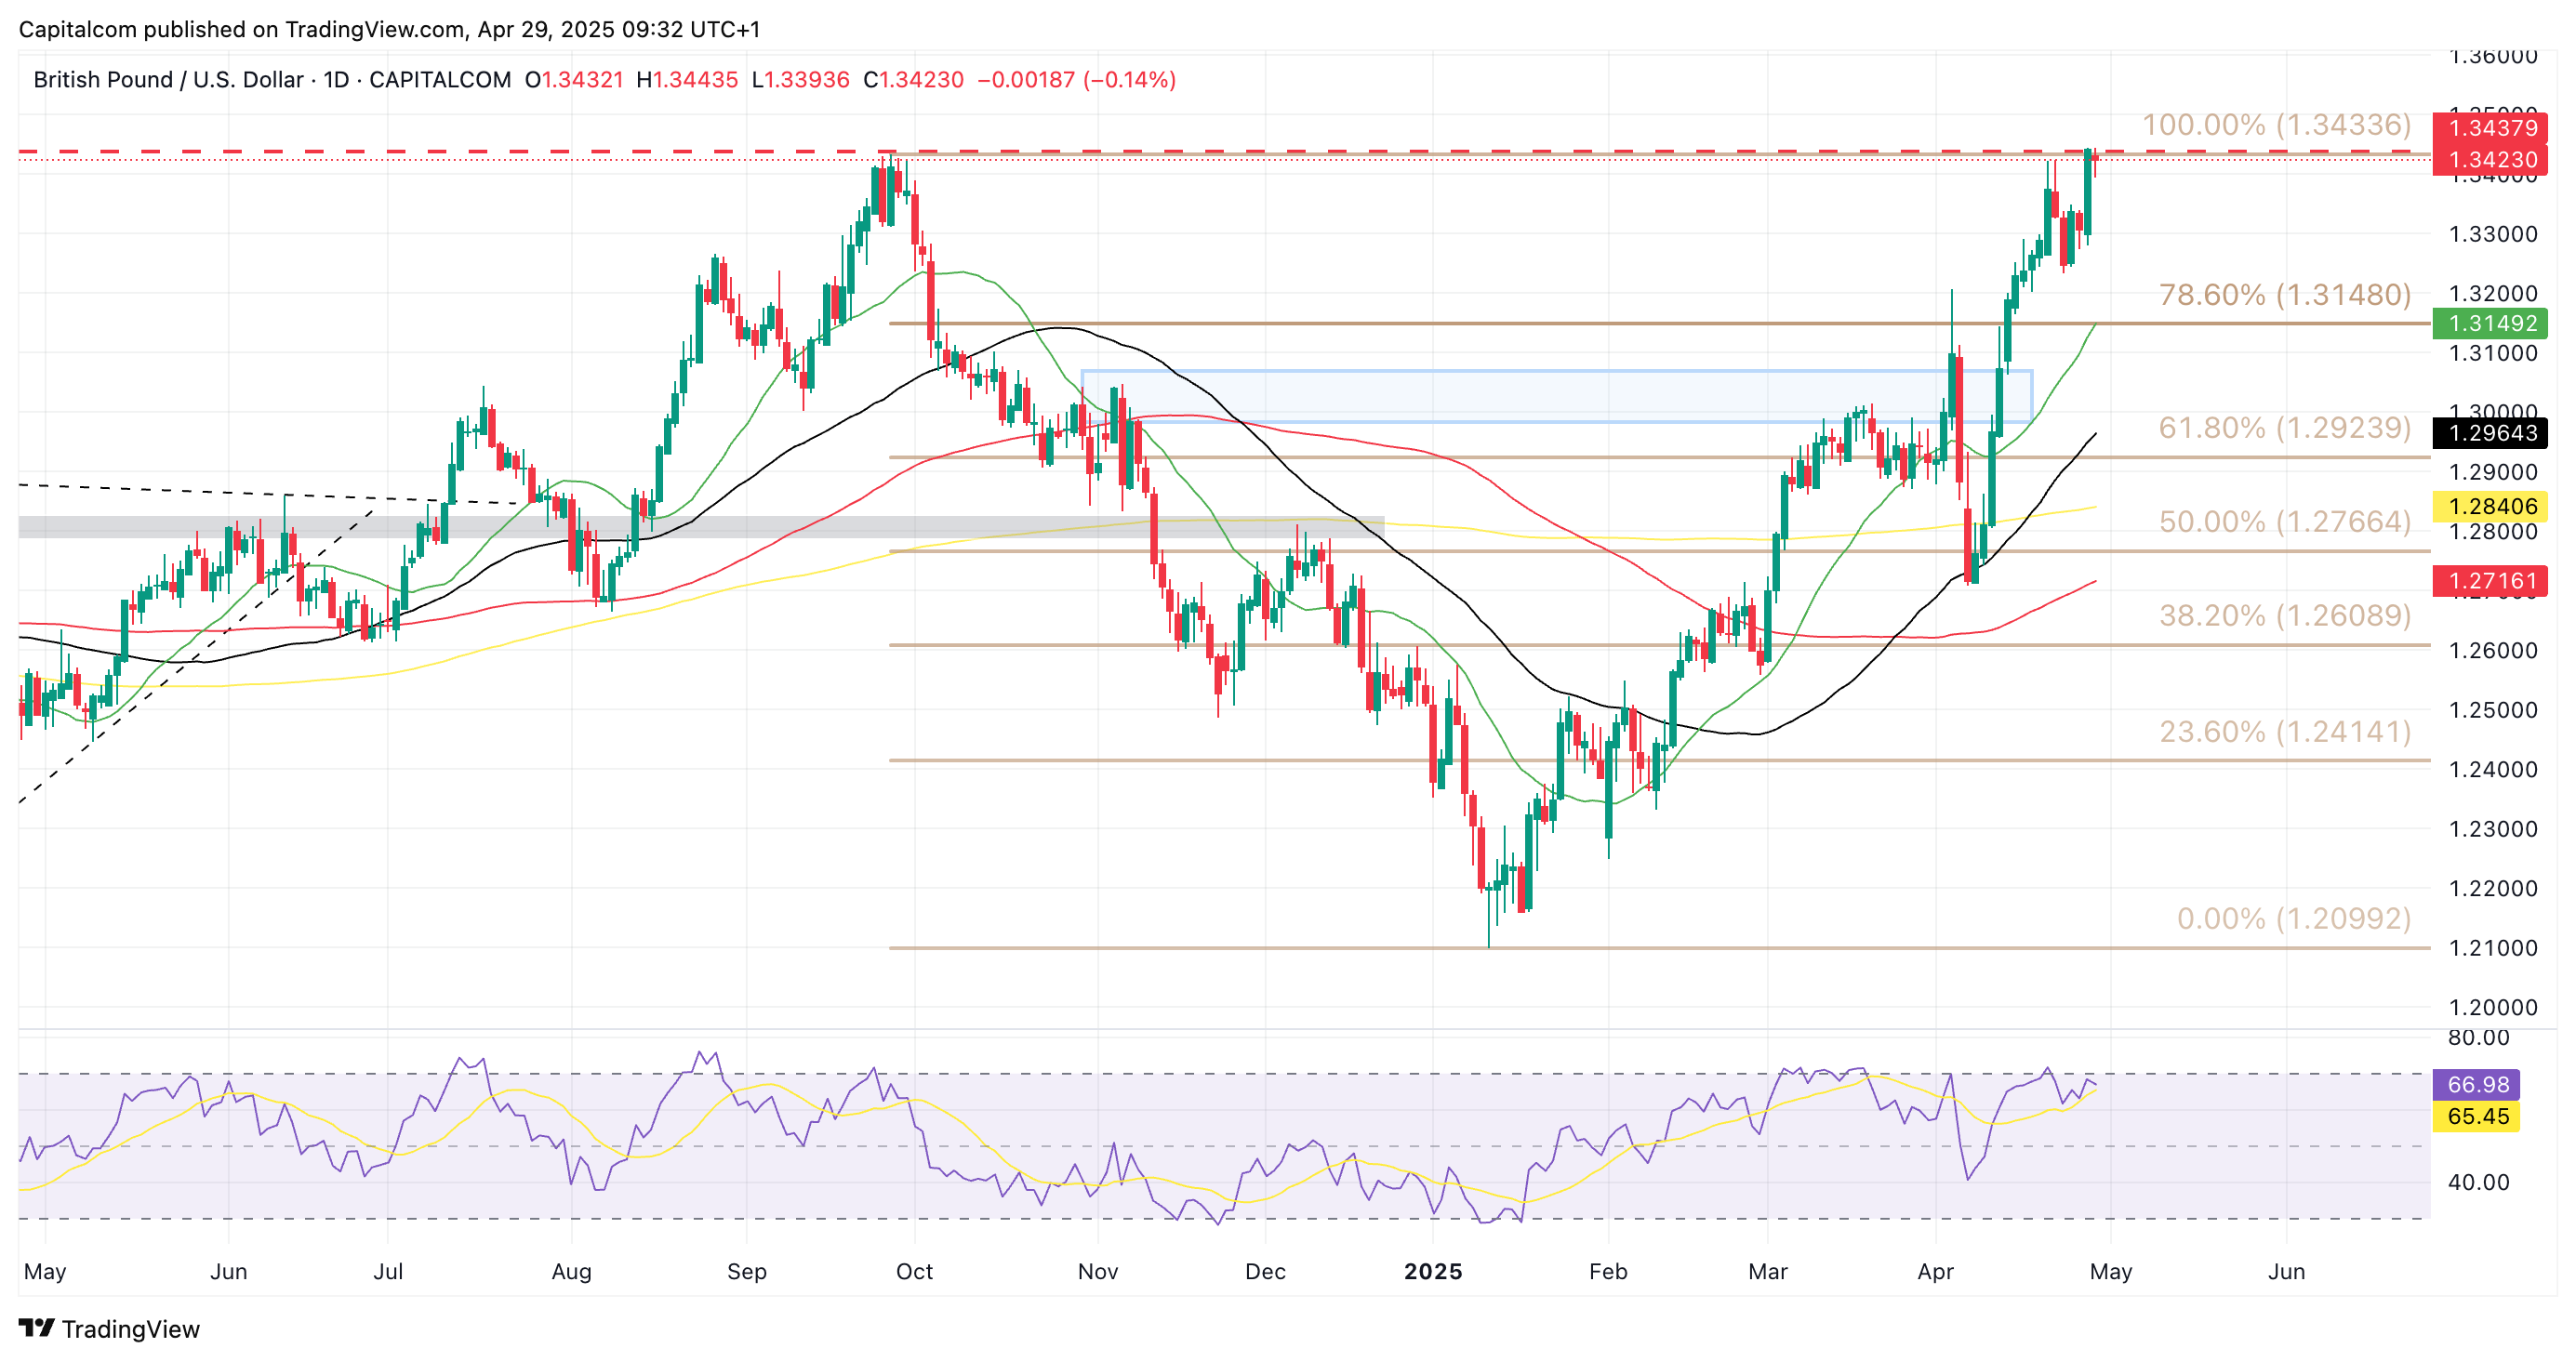
Past performance is not a reliable indicator of future results.
Dollar weakness remains the driving force
The continued hawkishness of the Federal Reserve toward the end of 2024 had been a key pillar supporting the U.S. dollar, bolstered by widening FX and yield differentials. However, President Trump’s aggressive tariff policies and a broader retreat from the "U.S. exceptionalism" narrative have reversed sentiment, pushing the dollar down to three-year lows against a basket of major currencies.
Currency markets remain highly sensitive to tariff developments. While Trump’s recent remarks suggested progress toward a potential deal with China, cooler responses from Beijing and U.S. Treasury Secretary Bessent have tempered optimism, keeping traders cautious.
Focus shifts to Bank of England signals
On the sterling side, attention turns to an upcoming speech by Bank of England official Dave Ramsden, scheduled for Tuesday morning. The BoE is set to meet next Thursday, and markets are heavily pricing in a 25-basis-point rate cut, with a 97% probability currently factored into expectations.
Traditionally, monetary easing tends to weigh on a currency by narrowing its yield advantage. However, amid heightened global uncertainty, currencies backed by policies emphasizing growth stability — such as the euro under the ECB — have been rewarded. In this context, a BoE rate cut could actually strengthen market confidence in sterling, potentially supporting a further rally in GBP/USD
Key Technical Levels to Watch
GBP/USD weekly chart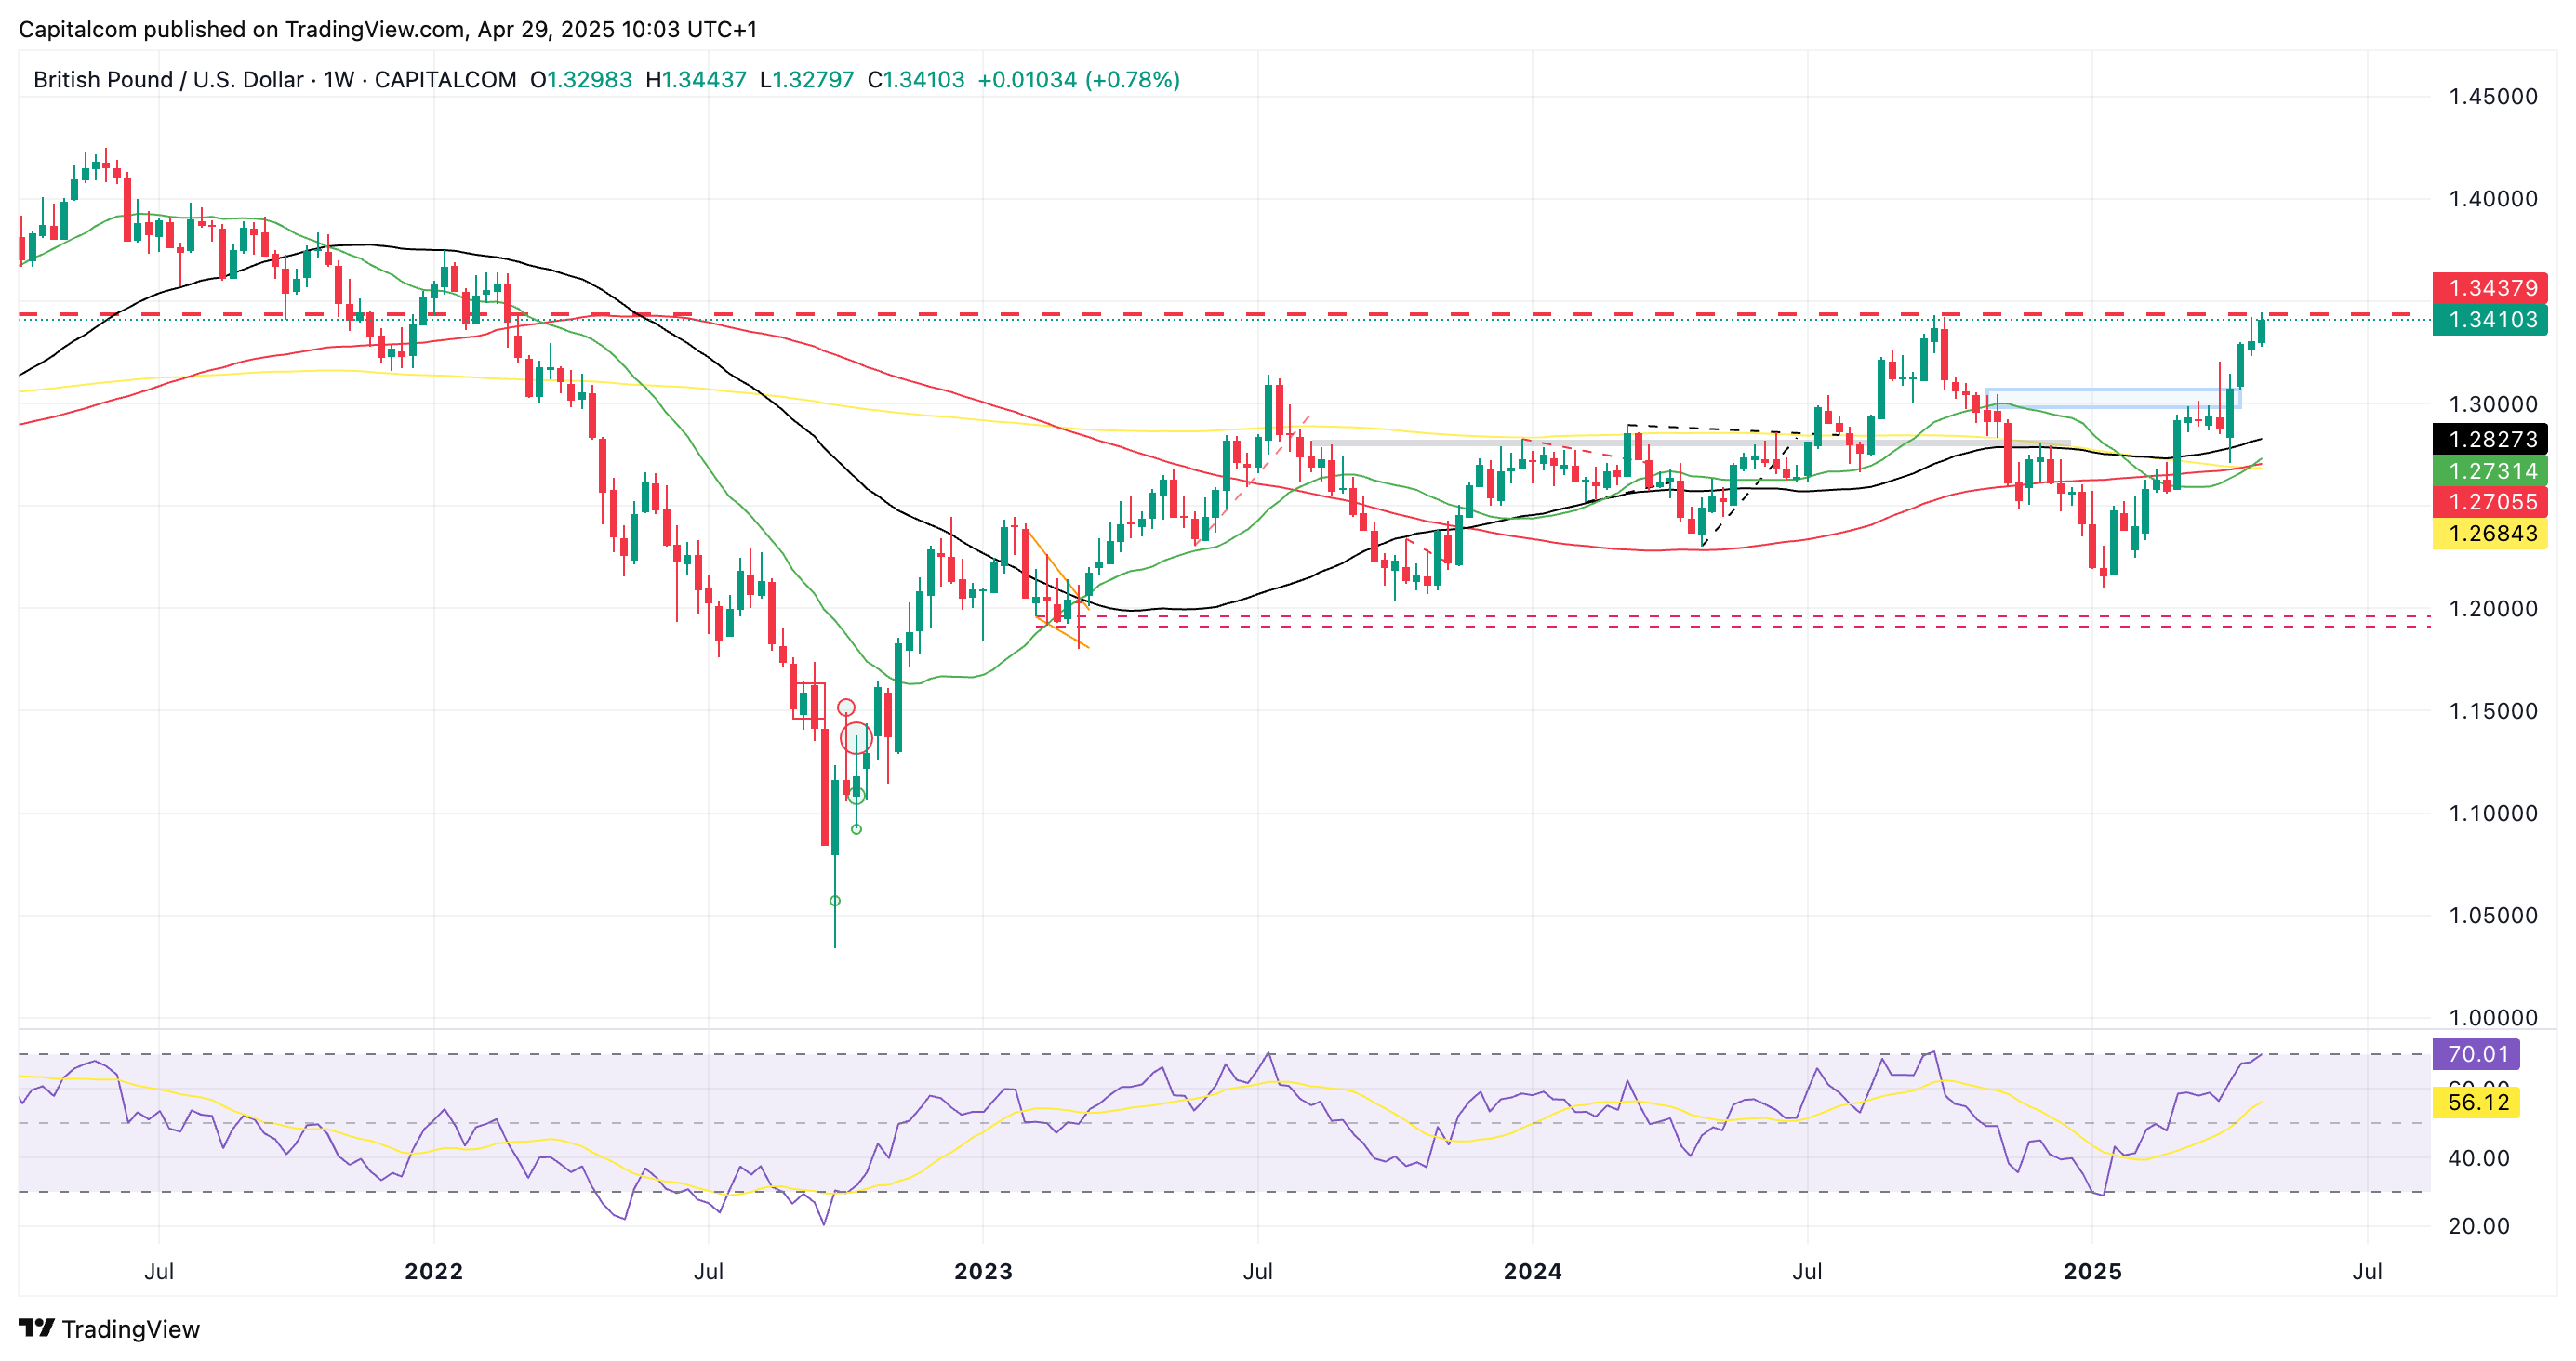
Past performance is not a reliable indicator of future results.
For now, GBP/USD is encountering resistance at the 2024 highs. Whether bullish momentum can extend beyond this level, or a double-top formation emerges remains to be seen. Should a pullback materialize, a correction toward the 1.30 area is likely in the coming weeks.
The weekly chart shows the Relative Strength Index (RSI) approaching overbought territory after three consecutive weeks of gains and another strong start this week. If momentum persists, the next major resistance zone could be around 1.3645