

Michael Kramer: How to Analyse Bank of America Before Earnings
Bank of America’s market capitalisation has risen from roughly $199 billion in October 2023 to a 2026 peak of roughly $453 billion in August and now sits at about $376 billion as of 2 October.
Revenue comes from four business segments: Consumer Banking, Global Wealth & Investment Management, Global Banking, and Global Markets.
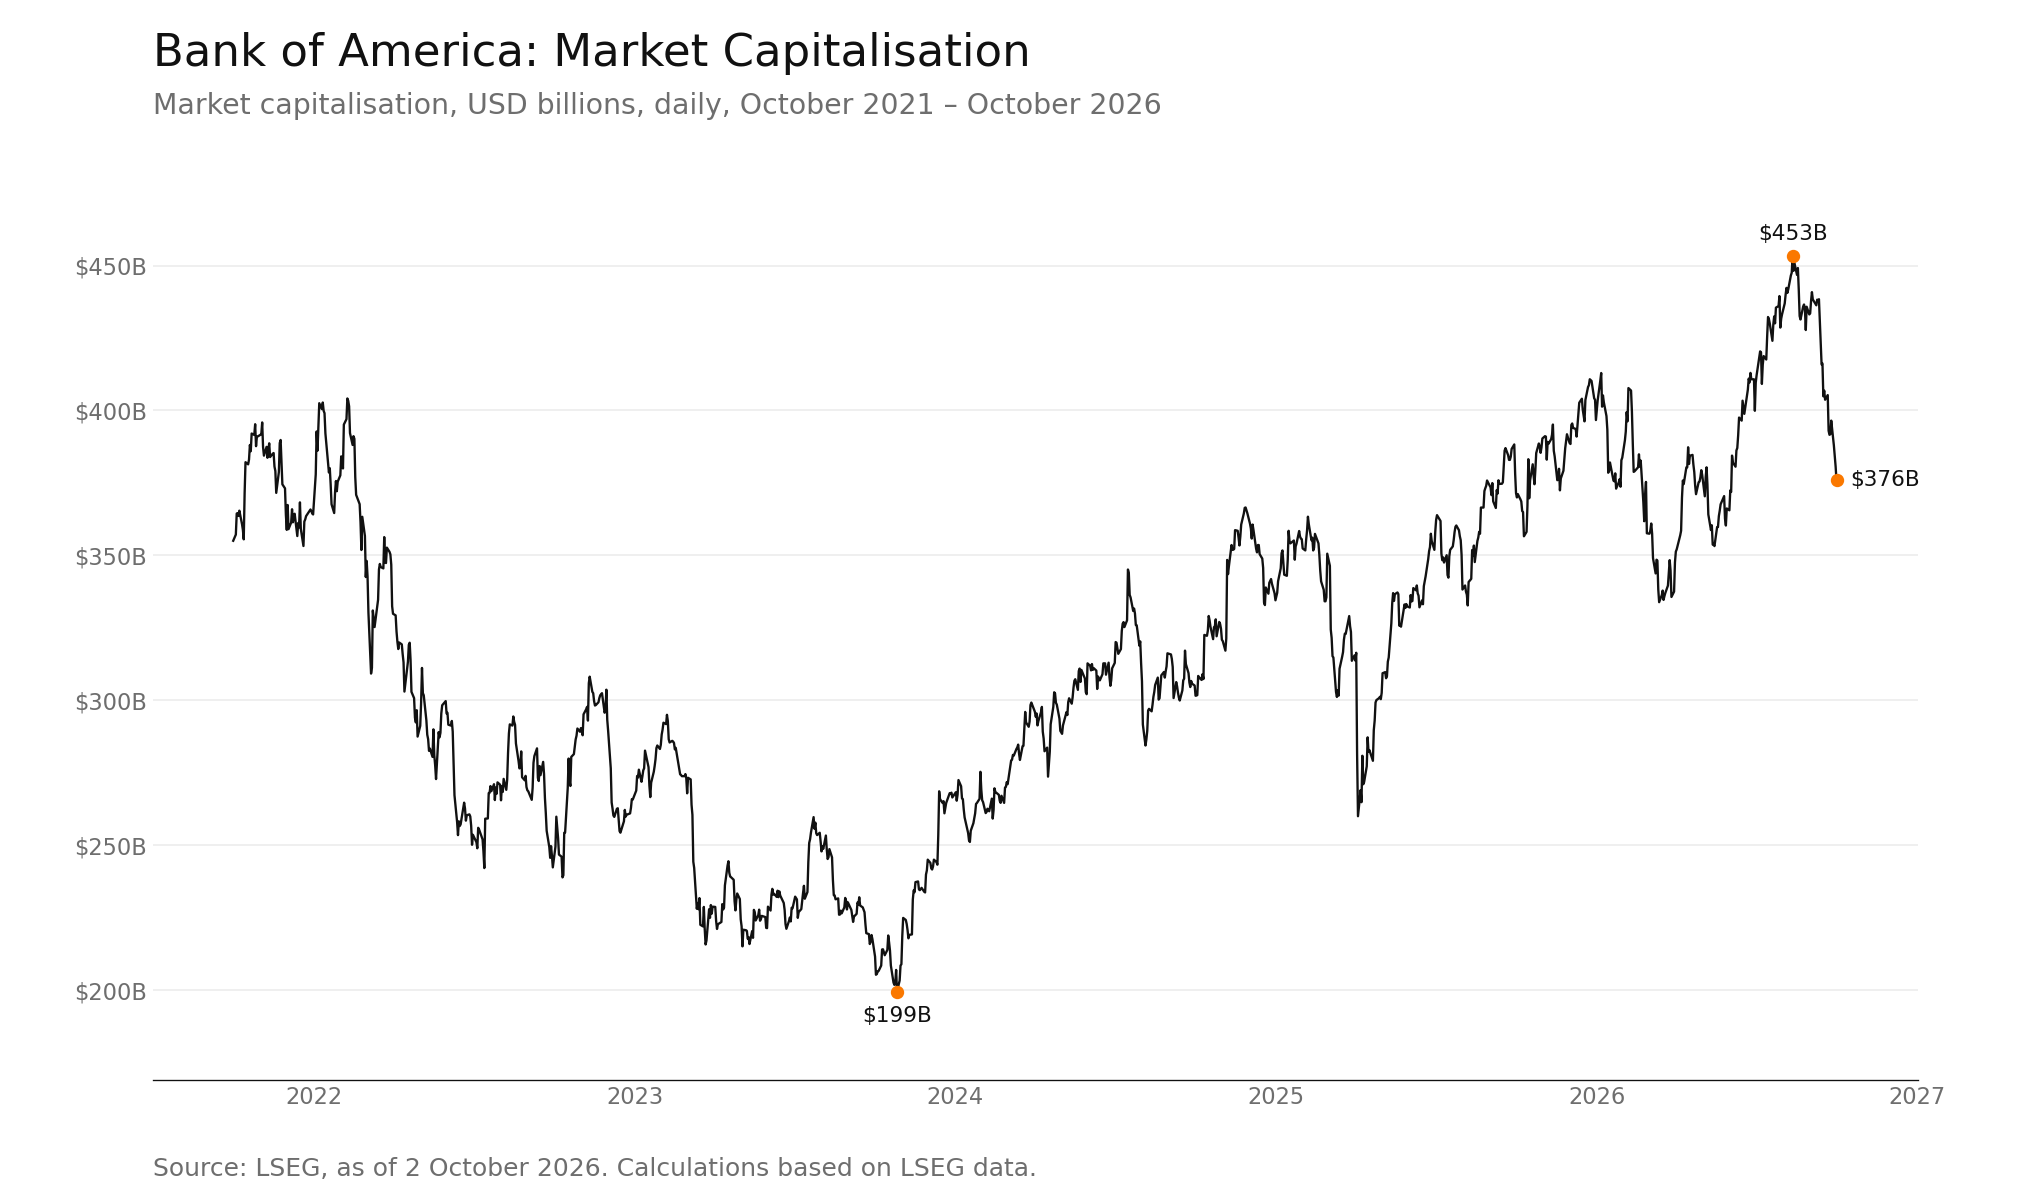
(Source: LSEG, as of 2 October 2026. Calculations based on LSEG data)
(Past performance is not a reliable indicator of future results)
Earnings History
Across the 21 quarters shown, Bank of America’s EPS exceeded analysts’ consensus mean estimate in all 21 quarters, while revenue exceeded the consensus mean estimate in 17. Among the positive surprises, EPS averaged 7.7% above consensus, while revenue averaged 2.1% above consensus.
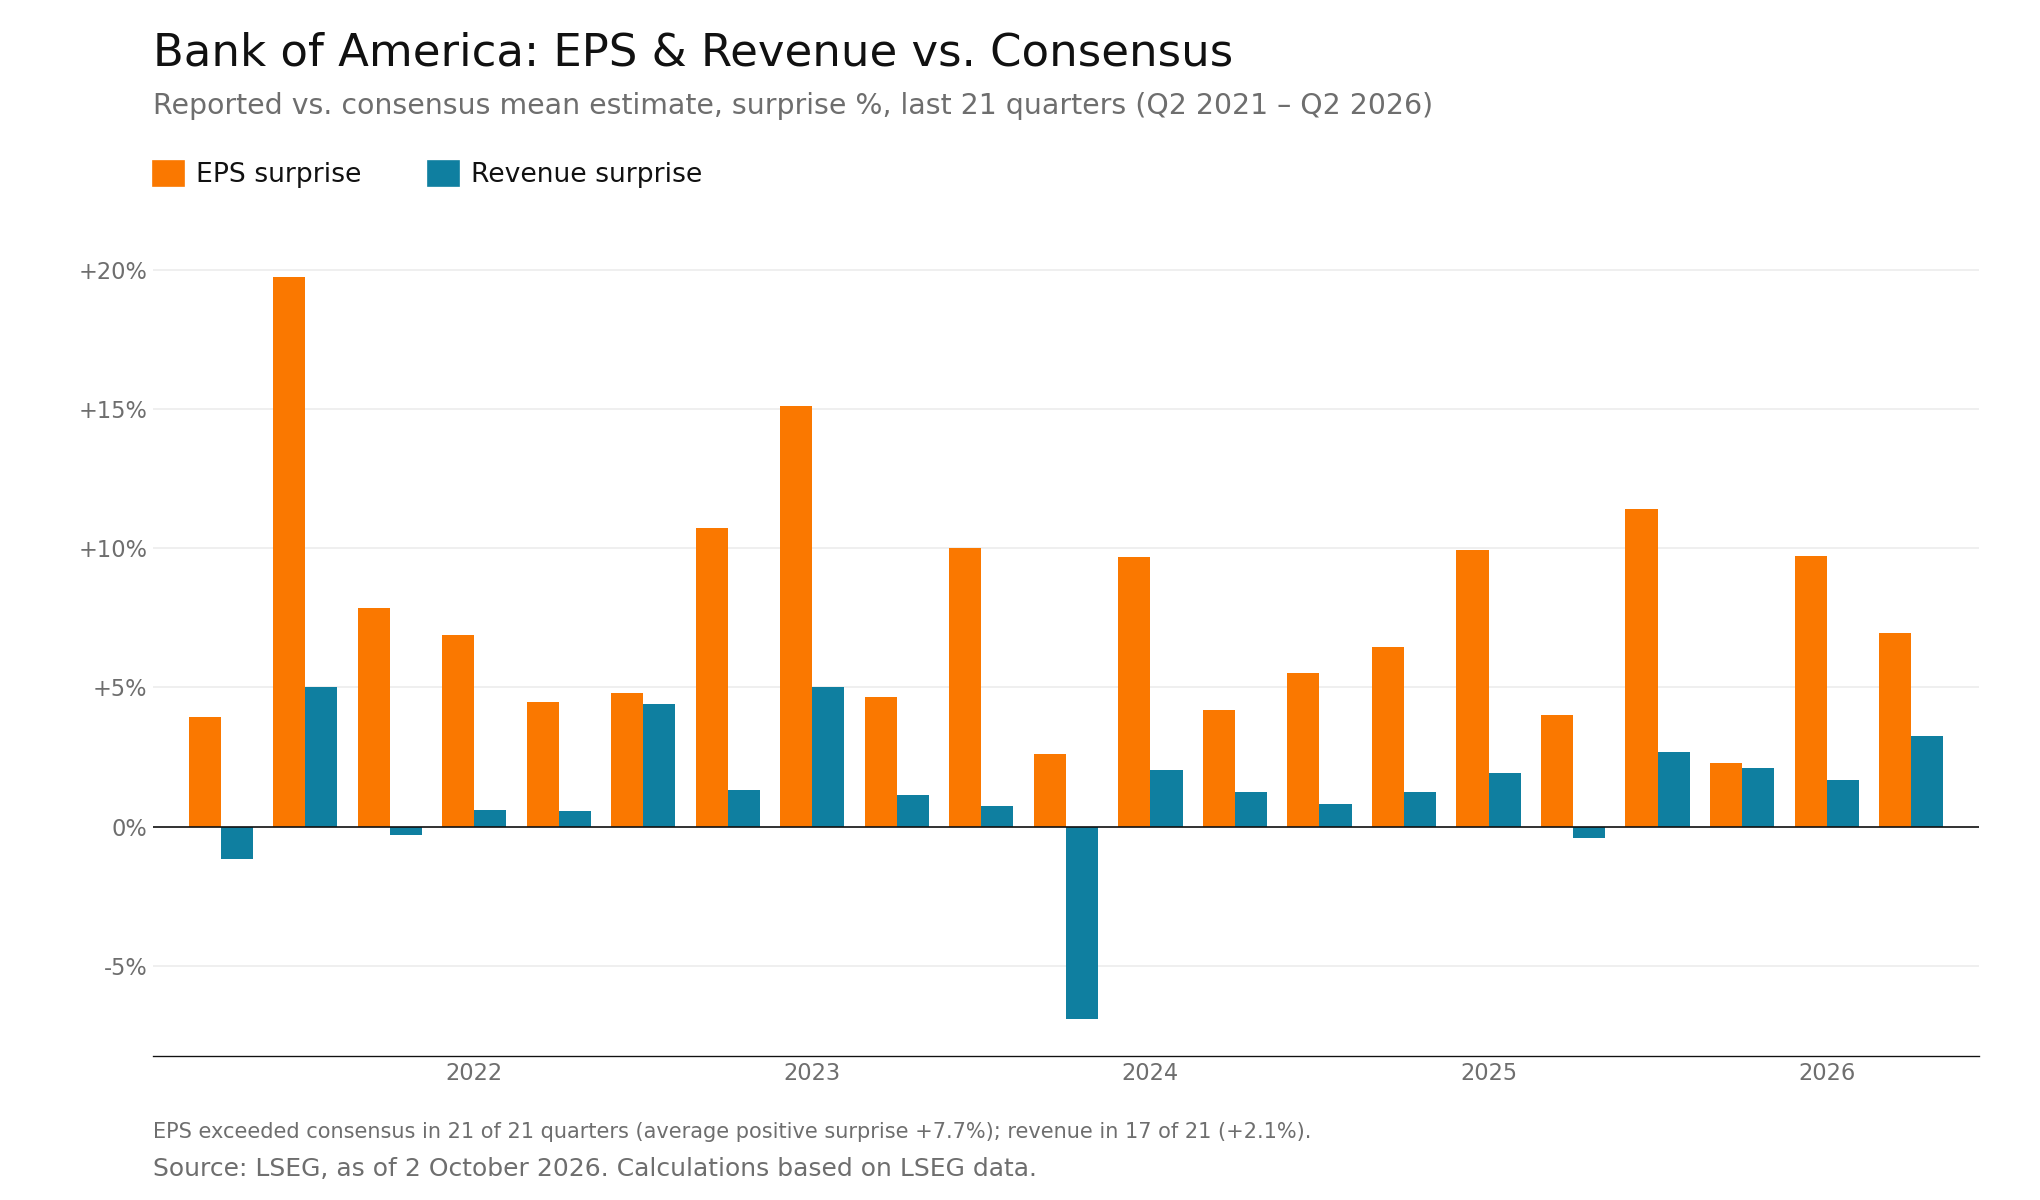
(Source: LSEG, as of 2 October 2026. Calculations based on LSEG data)
(Past performance is not a reliable indicator of future results)
Revenue Mix
Net interest income was $16.0 billion in the second quarter of 2026 and noninterest income was $15.6 billion, compared with $14.8 billion and $11.8 billion a year earlier. Noninterest income rose 32.0% year on year in the second quarter and accounted for about 49% of total revenue, up from about 44% a year earlier.
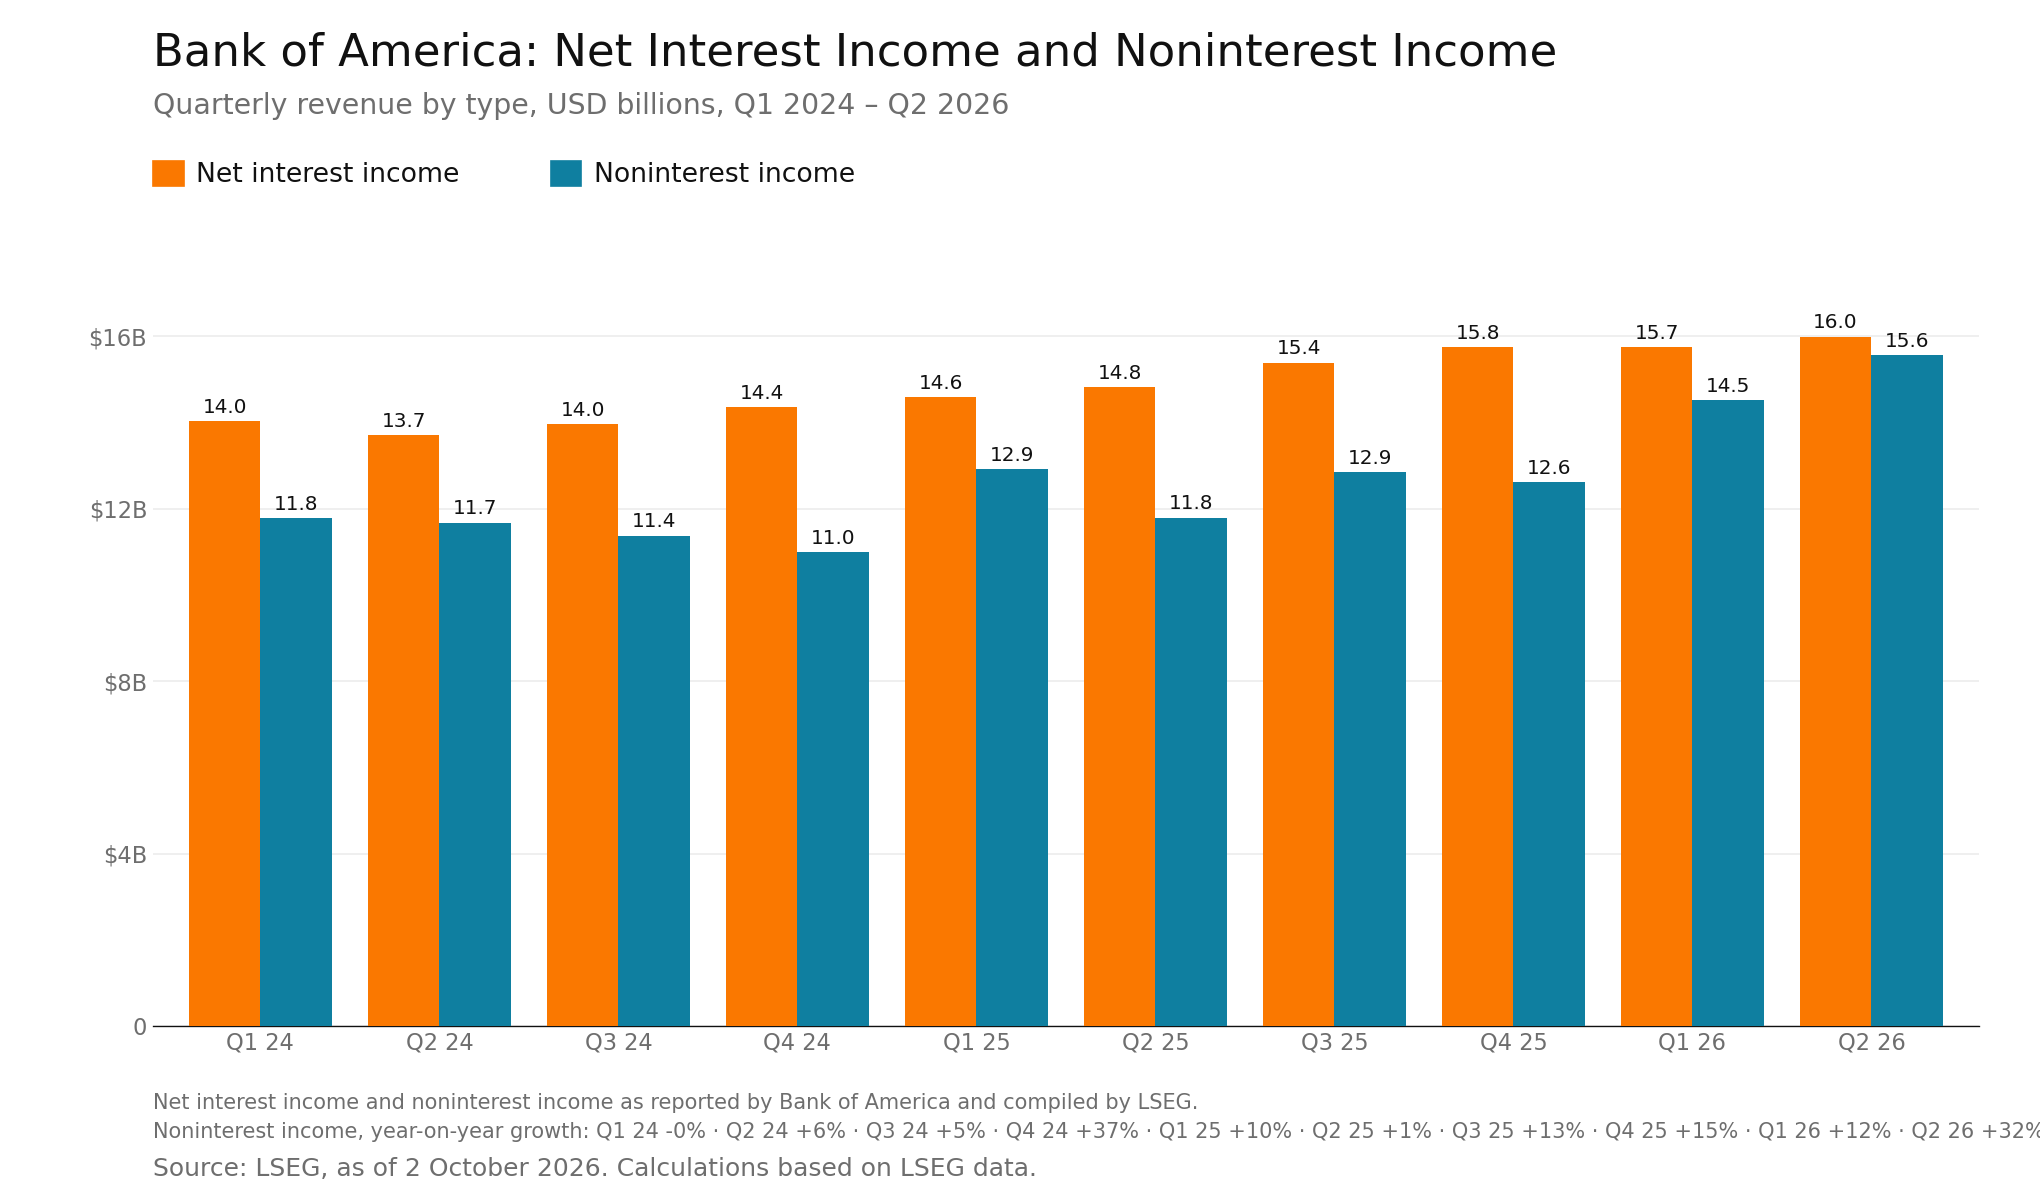
(Source: LSEG, as of 2 October 2026. Calculations based on LSEG data)
(Past performance is not a reliable indicator of future results)
Trading Income and Fees
Trading income was $4.2 billion in the second quarter of 2026, up 32.5% from $3.2 billion a year earlier and the highest quarterly figure in the period shown. Across the ten quarters from the first quarter of 2024, trading income ranged from $2.1 billion in the fourth quarter of 2025 to $4.2 billion in the second quarter of 2026, with the fourth quarter the lowest in both 2024 and 2025. Trading income accounted for between 7% and 15% of total revenue over the period.
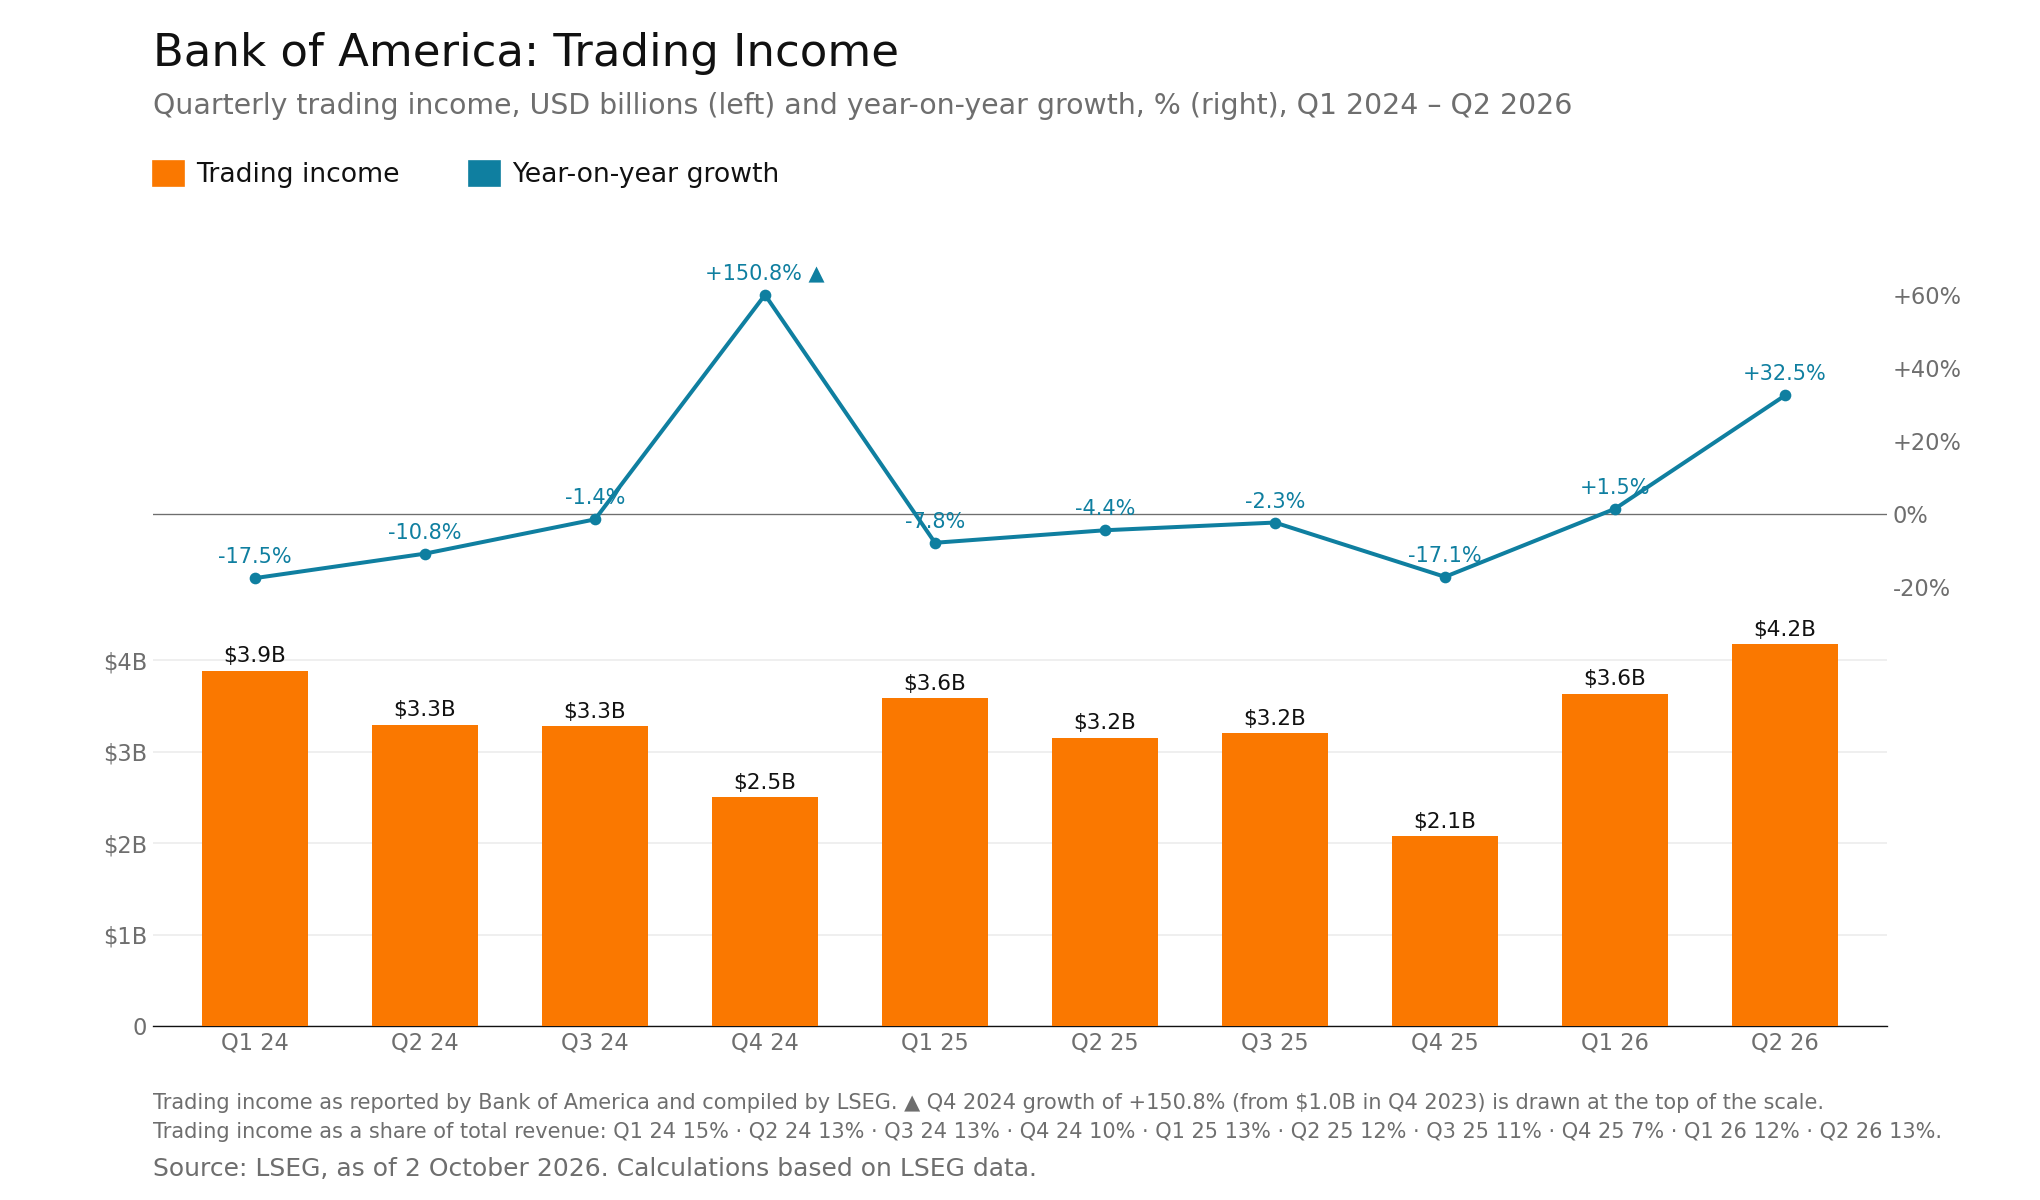
(Source: LSEG, as of 2 October 2026. Calculations based on LSEG data)
(Past performance is not a reliable indicator of future results)
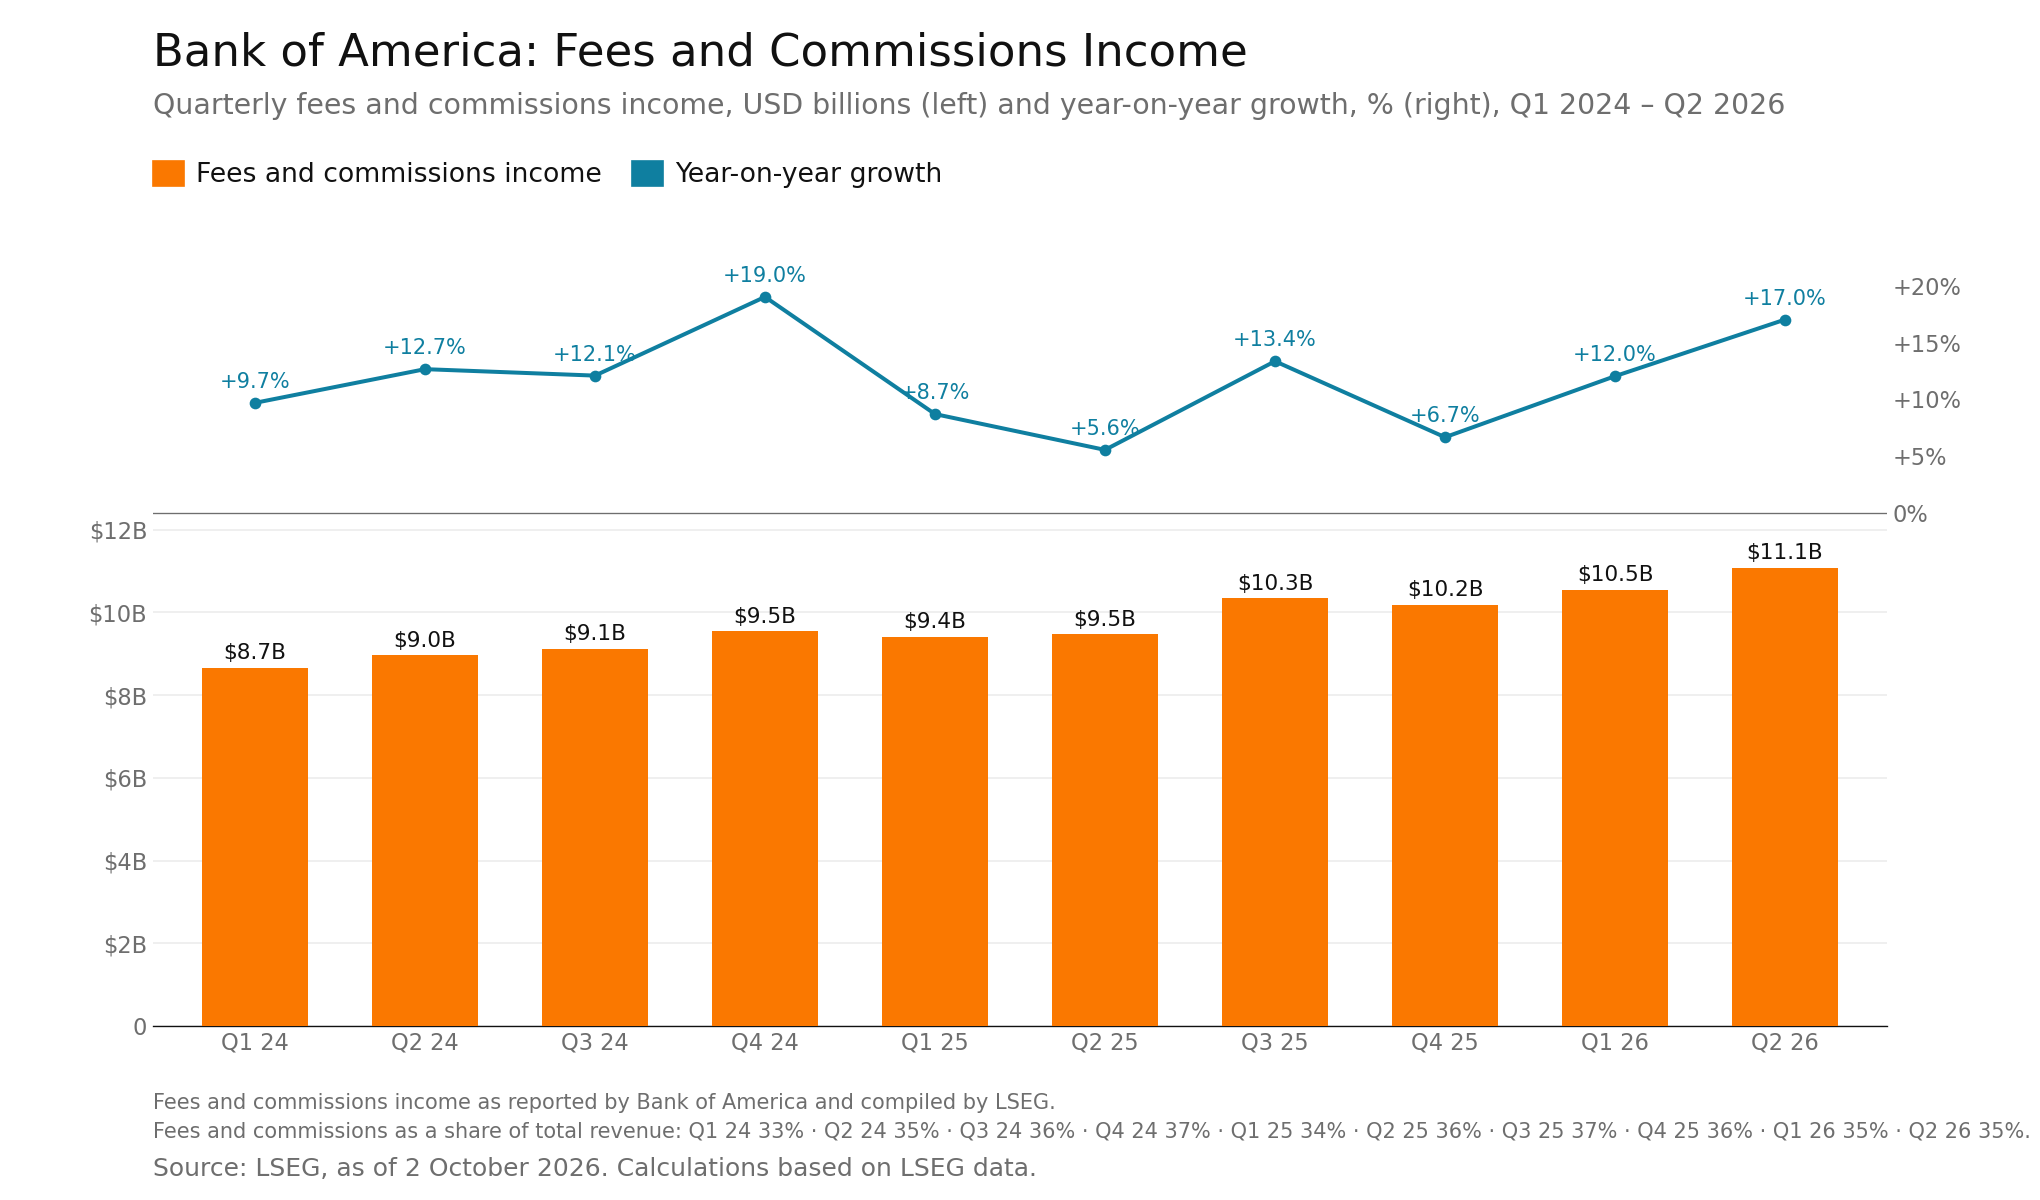
Fees and commissions income was $11.1 billion in the second quarter of 2026, up 17.0% from $9.5 billion a year earlier. It has risen from $8.7 billion in the first quarter of 2024, with year-on-year growth positive in each of the ten quarters shown, and accounted for between 33% and 37% of total revenue over the period.
(Source: LSEG, as of 2 October 2026. Calculations based on LSEG data)
(Past performance is not a reliable indicator of future results)
Net Interest Income
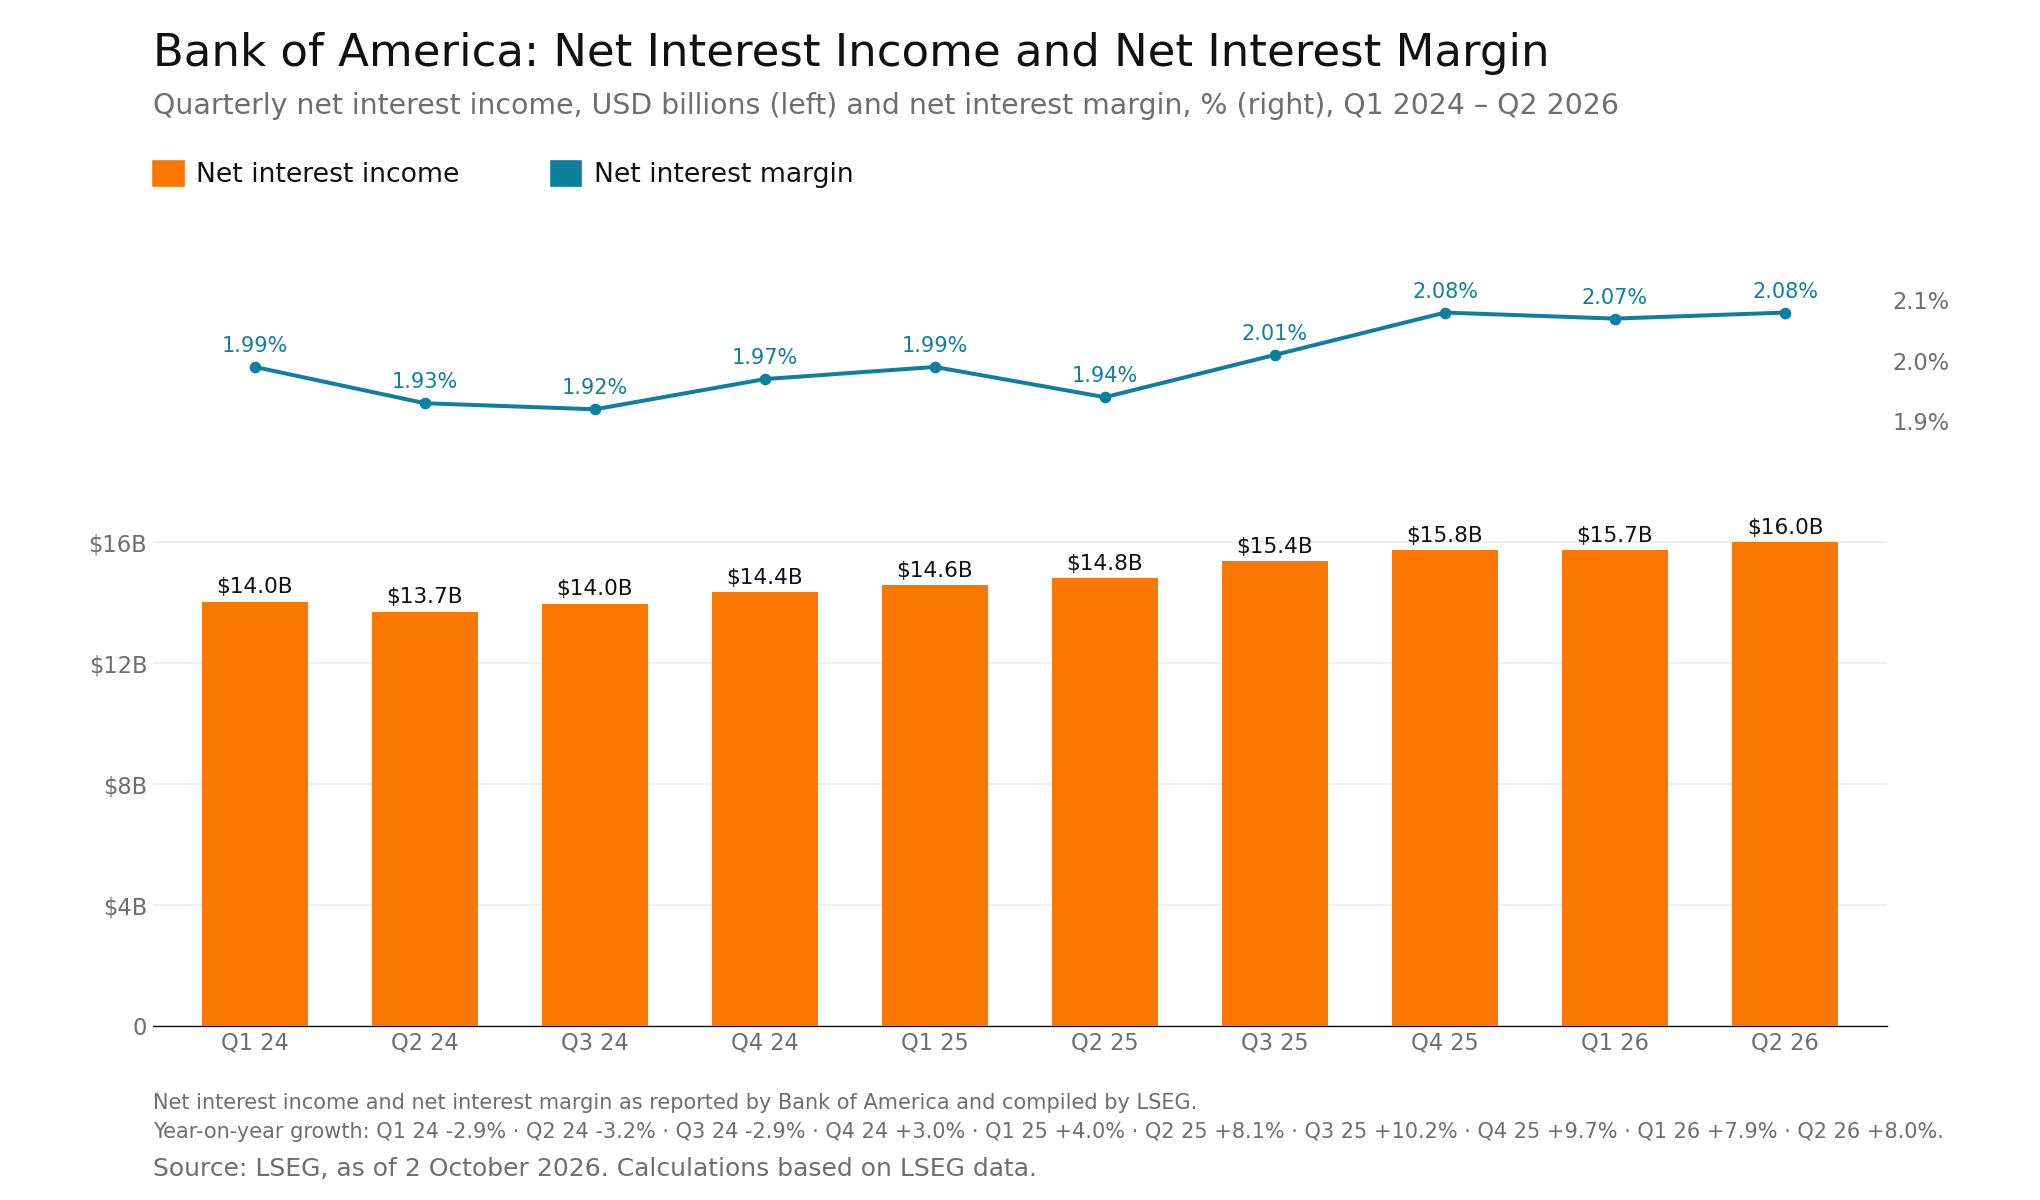
Net interest income was $16.0 billion in the second quarter of 2026, up 8.0% from $14.8 billion a year earlier. Net interest margin was 2.08%, compared with 1.94% a year earlier and 1.92% in the third quarter of 2024.
(Source: LSEG, as of 2 October 2026. Calculations based on LSEG data)
(Past performance is not a reliable indicator of future results)
Book Value
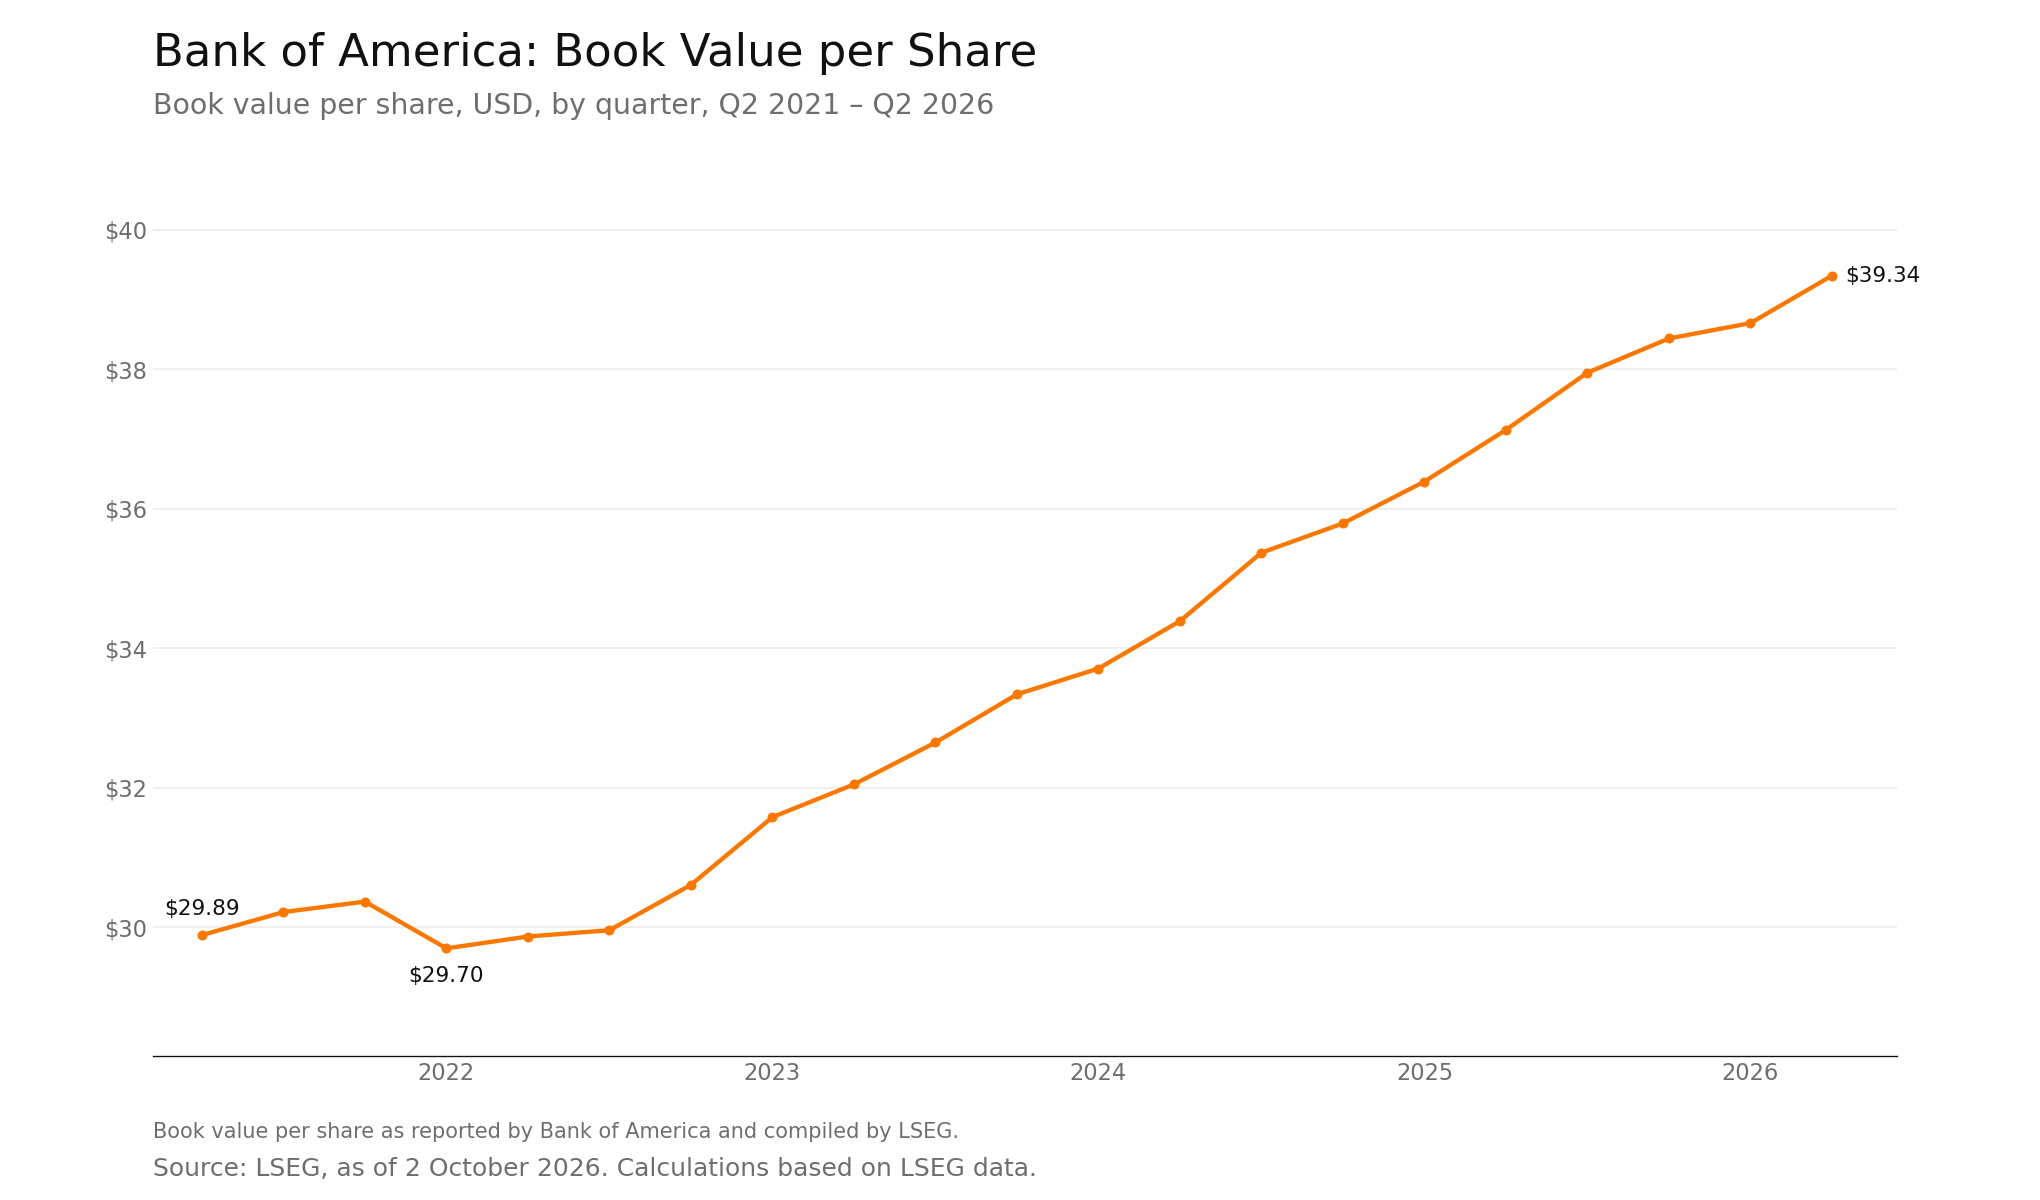
Book value per share is common shareholders’ equity divided by common shares outstanding, representing the net assets recorded on the balance sheet for each common share. It is a common reference point for banks because loans and securities make up much of their balance sheets, although these assets are not all recorded at market value. Book value per share was $39.34 in the second quarter of 2026, up 6.0% from $37.13 a year earlier. Over the full period shown, it has risen from $29.89 in the second quarter of 2021.
(Source: LSEG, as of 2 October 2026. Calculations based on LSEG data)
(Past performance is not a reliable indicator of future results)
Options-Implied Earnings Range
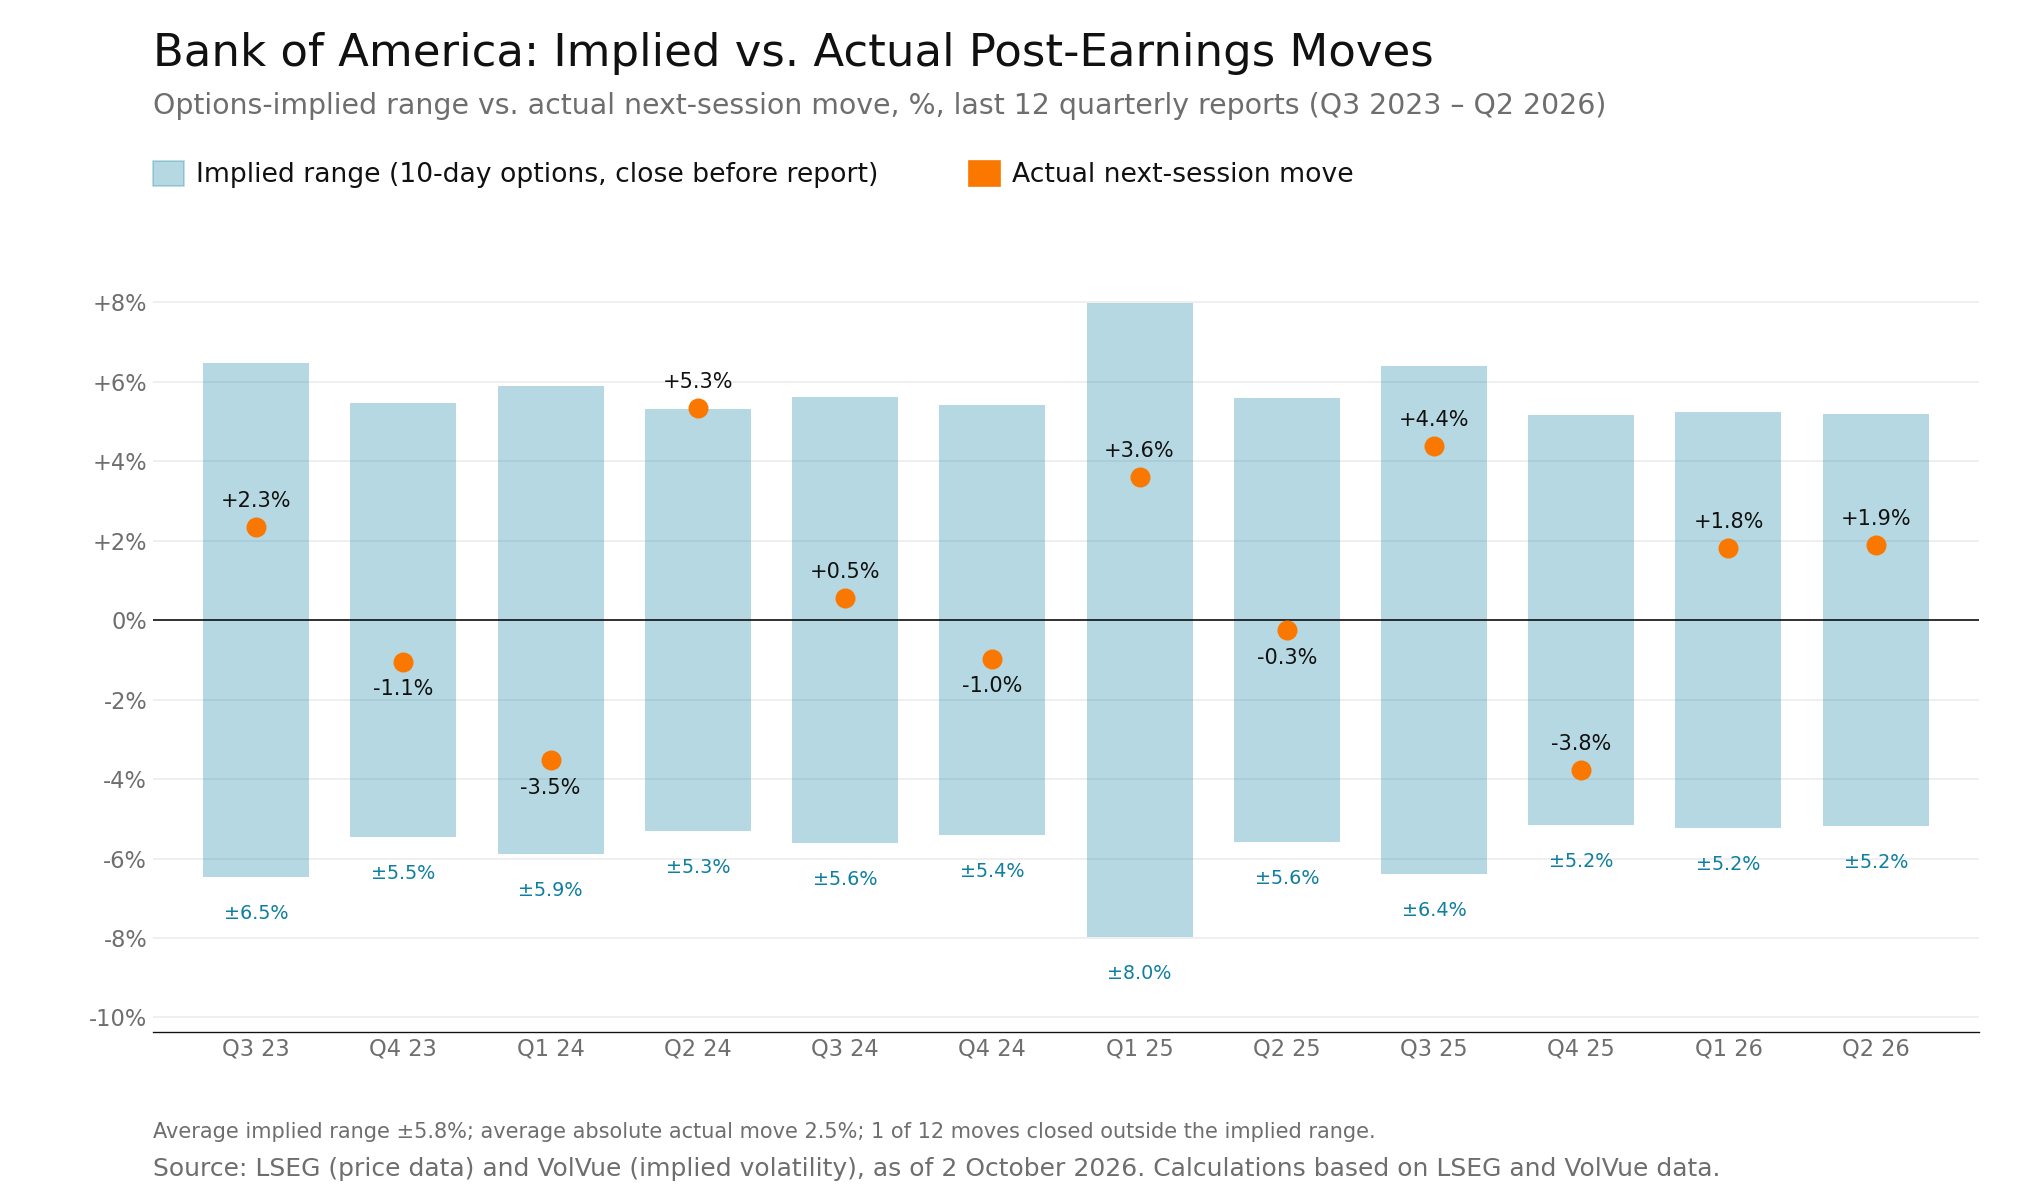
Option prices can be used to calculate an implied trading range around an earnings announcement. Across the 12 announcements shown, 10-day at-the-money implied volatility produced an average one-standard-deviation range of ±5.8%, while the average absolute realised next-session move was 2.5%. The next-session share-price move remained within the calculated range in eleven cases and was outside it in only one.
The implied range was estimated using the 10-day at-the-money implied volatility observed at the last close before each report, scaled to the option’s 10-day term using implied volatility × √(10/365) and applied to the share price. This produces a one-standard-deviation range derived from option prices. It does not represent a forecast or indicate the direction of the share-price move.
(Source: LSEG (price data) and VolVue (implied volatility), as of 2 October 2026. Calculations based on LSEG and VolVue data)
(Past performance is not a reliable indicator of future results)
Valuation Metrics
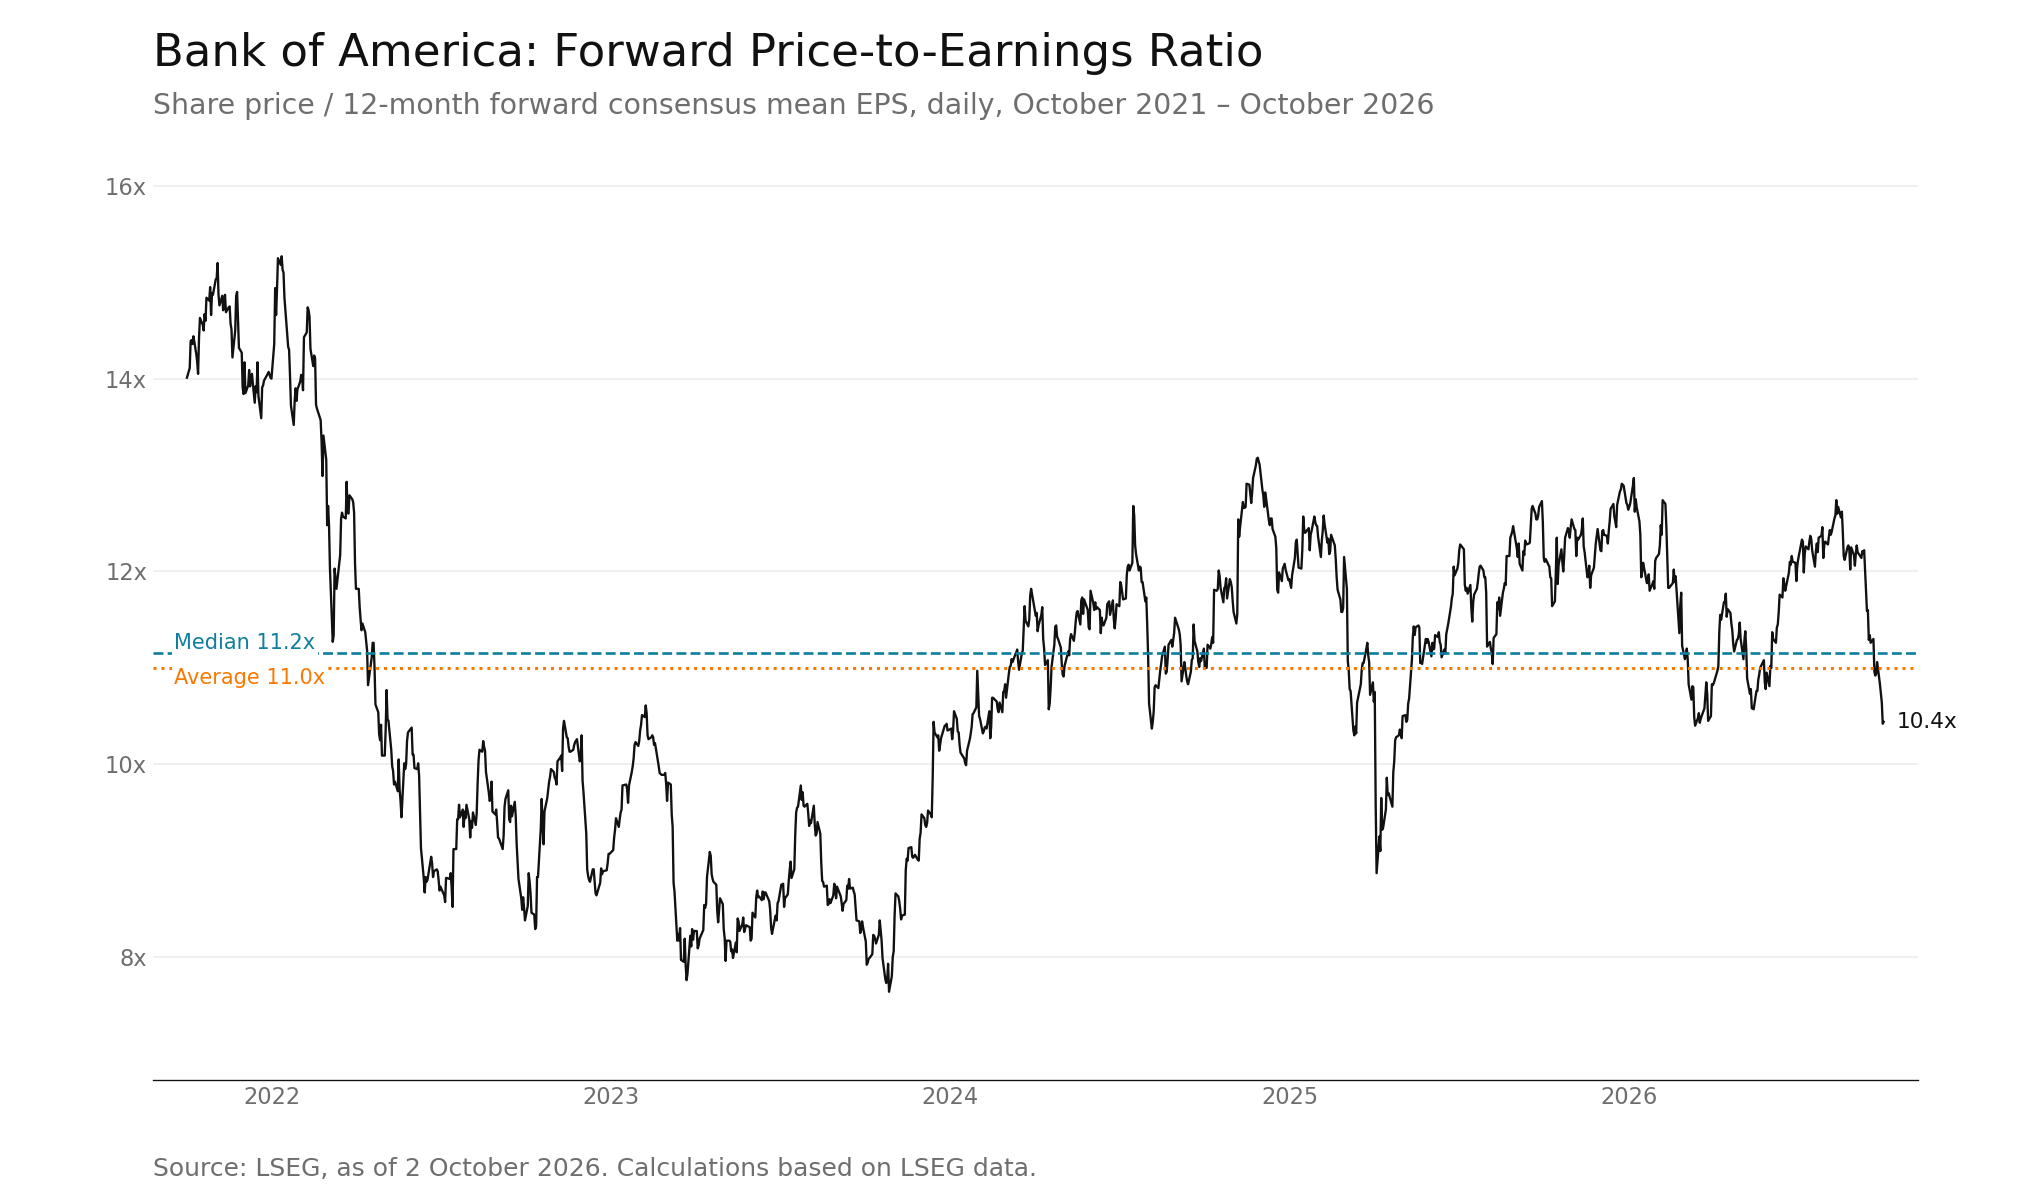
As of 2 October 2026, Bank of America’s forward price-to-earnings ratio, based on analysts’ estimates for the next 12 months, was 10.4. From October 2021 to October 2026, the average P/E was 11.0, and the median was 11.2, placing the 2 October observation below both measures for the period.
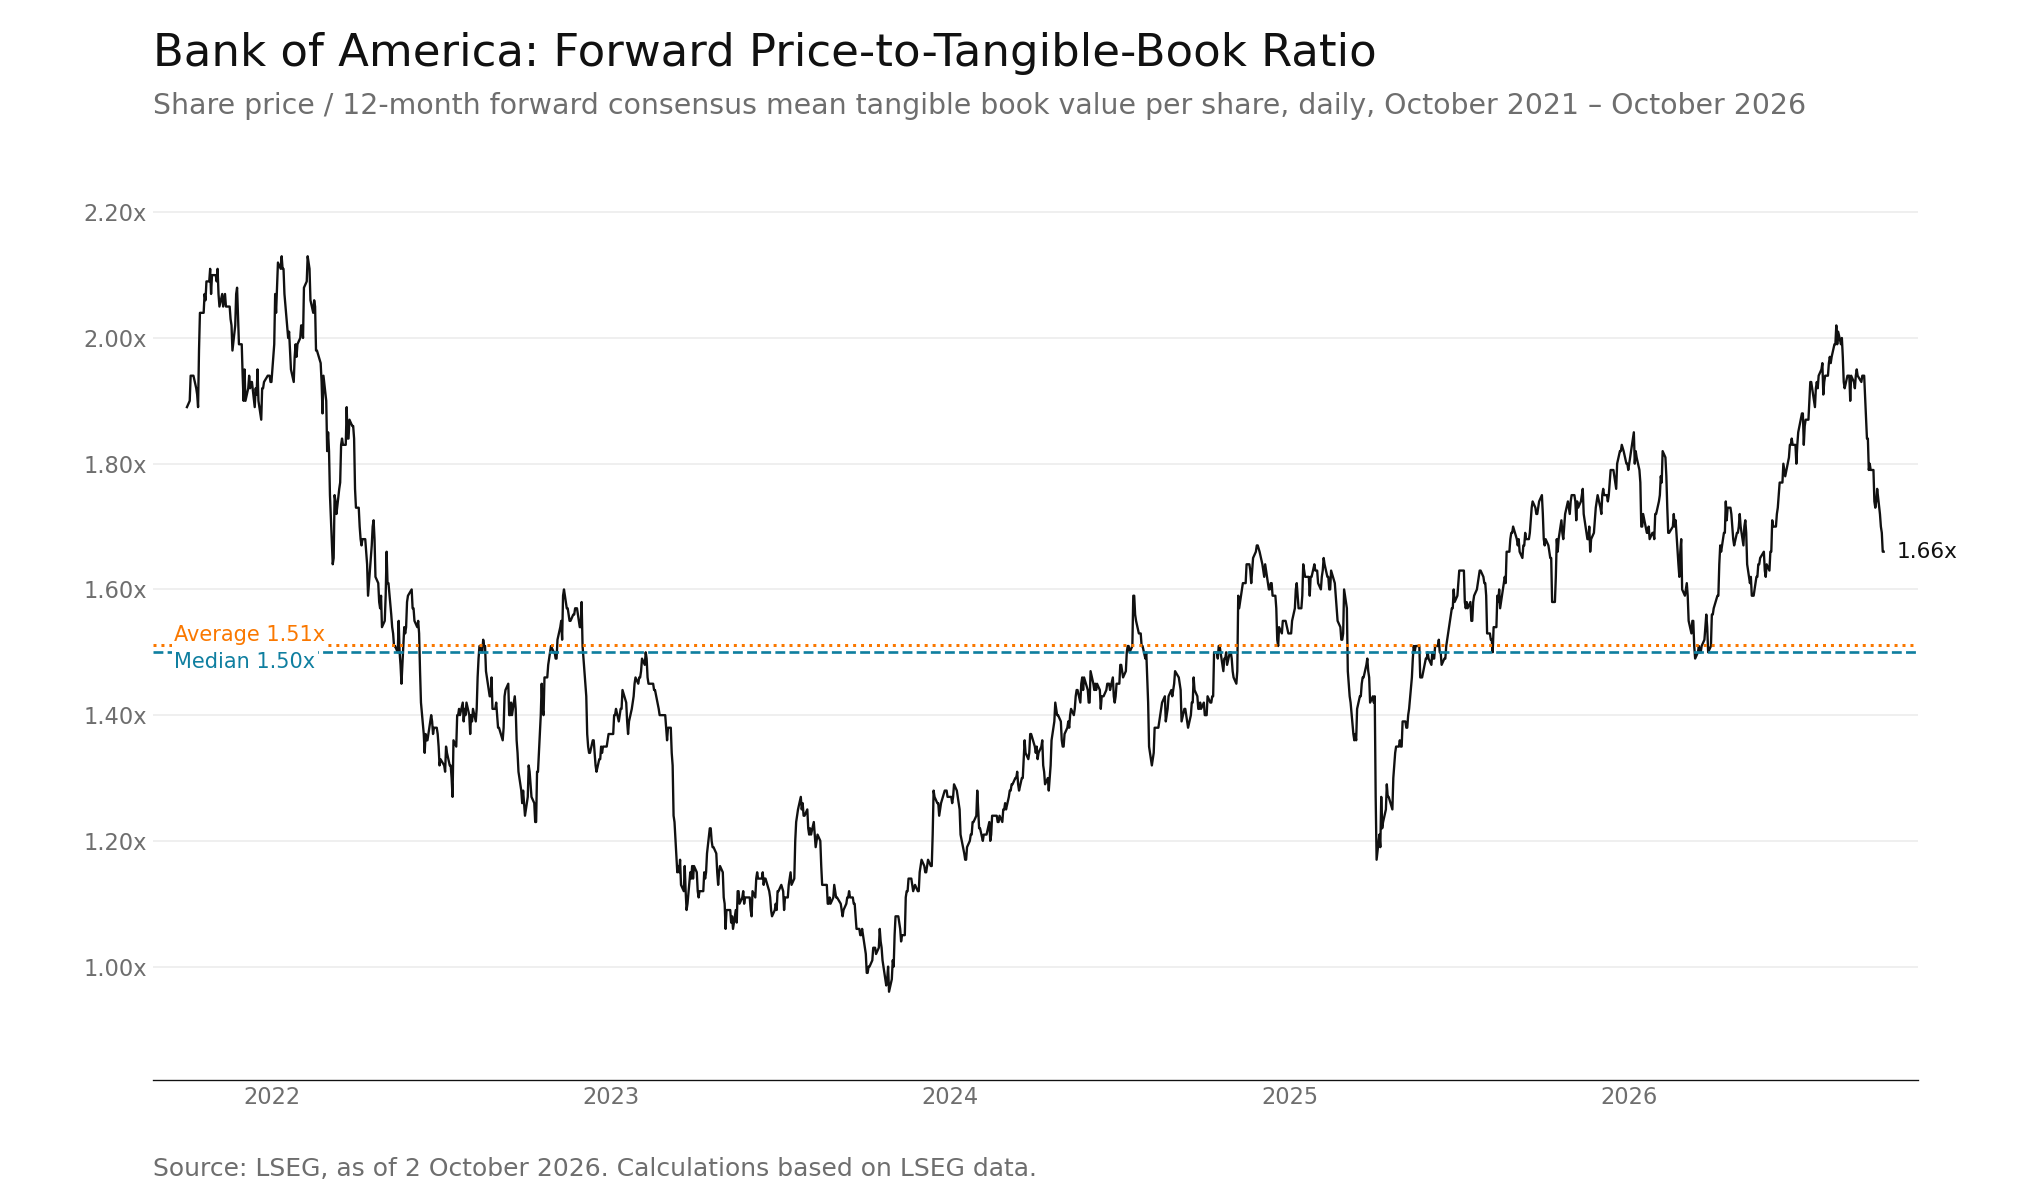
Historical valuation multiples provide context for how the market has priced the company over time. These comparisons do not indicate whether the shares are currently overvalued or undervalued.
(Source: LSEG, as of 2 October 2026. Calculations based on LSEG data)
(Past performance is not a reliable indicator of future results)
As of 2 October 2026, Bank of America’s forward price-to-tangible-book ratio, based on analysts’ estimates of tangible book value per share for the next 12 months, was 1.66. From October 2021 to October 2026, the average ratio was 1.51, and the median was 1.50, placing the 2 October observation above both measures for the period.
(Source: LSEG, as of 2 October 2026. Calculations based on LSEG data)
(Past performance is not a reliable indicator of future results)
Conclusion
Bank of America’s earnings history, revenue mix, trading income, fees and commissions, net interest income, book value, options-implied ranges and valuation multiples provide historical context.
As of 2 October 2026, Bank of America’s forward P/E ratio was below its historical average and median for the period shown, while its forward price-to-tangible-book ratio was above both measures. These measures reflect historical observations and do not forecast the next earnings announcement. Past performance is not a reliable indicator of future results.