Hunting for Trend Days Part 1: The Holy Grail

Imagine a world where a single day of price action can make or break your month. Well, if you’re a momentum-focused day trader, this world is not too far from reality.
Day traders tend not to hold overnight risk, a strategy that aligns with their preference for quick, intraday trades. This approach means they must enter and exit positions swiftly, often multiple times within the same trading day. For trend-following day traders, this typically involves capitalising on incremental price movements, taking slices of profits from small swings within the market as they adhere to the prevailing trend.
However, once or twice a month, the game changes. A day will emerge where trading timeframes and styles converge to develop a sustained day of directional movement – a trend day. For this reason, trend days are revered as the Holy Grail, creating the opportunity to capitalise on multi-day trends within a single session.
Let's delve into the intricacies of trend days and explore key characteristics and tools for recognising them early.
Understanding Trend Days
Trend days are trading sessions characterised by a strong and sustained directional movement in the market. Unlike choppy or range-bound days, where prices fluctuate within a confined range, trend days exhibit a clear and decisive movement in one direction, providing the ideal environment for trend focused day traders and a nightmare scenario for day traders for profit from reversals.
Regardless of your trading style, it’s well worth your while understanding the key characteristics of trend days and recognising them as early in the session as possible.
3 Key Characteristics of Trend Days
- 1. Minimal Intraday Retracements: On trend days, price retracements are minimal compared to normal market conditions. Instead of oscillating back and forth, the market maintains a consistent direction, allowing traders to capitalise on the trend without being frequently stopped out by counter-moves.
- 2. Increased Volume:Trend days are often accompanied by higher-than-average trading volume. This surge in volume reflects increased participation from traders and institutions, confirming the strength and validity of the prevailing trend.
- 3. Closing Near Extremes:At the end of a trend day, prices typically close near the high or low of the session. This closing behaviour reinforces the conviction behind the trend and sets the stage for potential follow-through in the subsequent trading sessions.
Examples of Trend Days
Forex:
In the 24-hour forex market, trend days can occur across the various timezones. However, the trend typically kicks into gear during early European trading and accelerates into the New York closing bell.
EUR/USD 5min Candle Chart
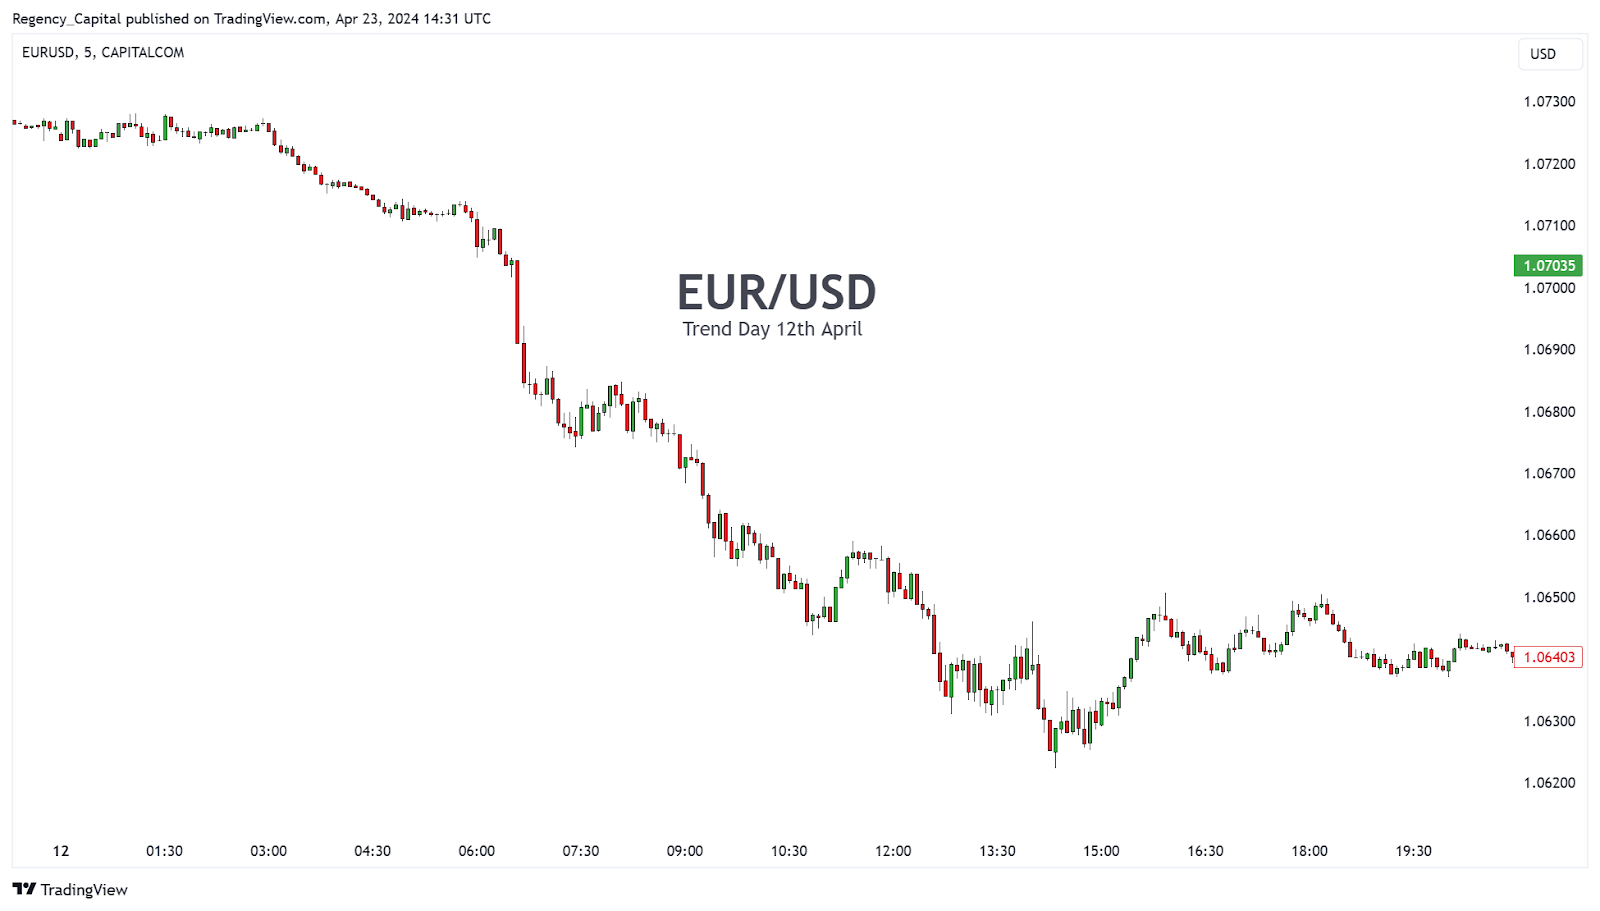
(Past performance is not a reliable indicator of future results)
Stocks:
Stocks experiencing trend days may exhibit pronounced price movements driven by earnings reports, corporate announcements, or sector-wide developments. It is not unusual to see prices gap higher at the open on a trend day.
Apple (AAPL) 5min Candle Chart
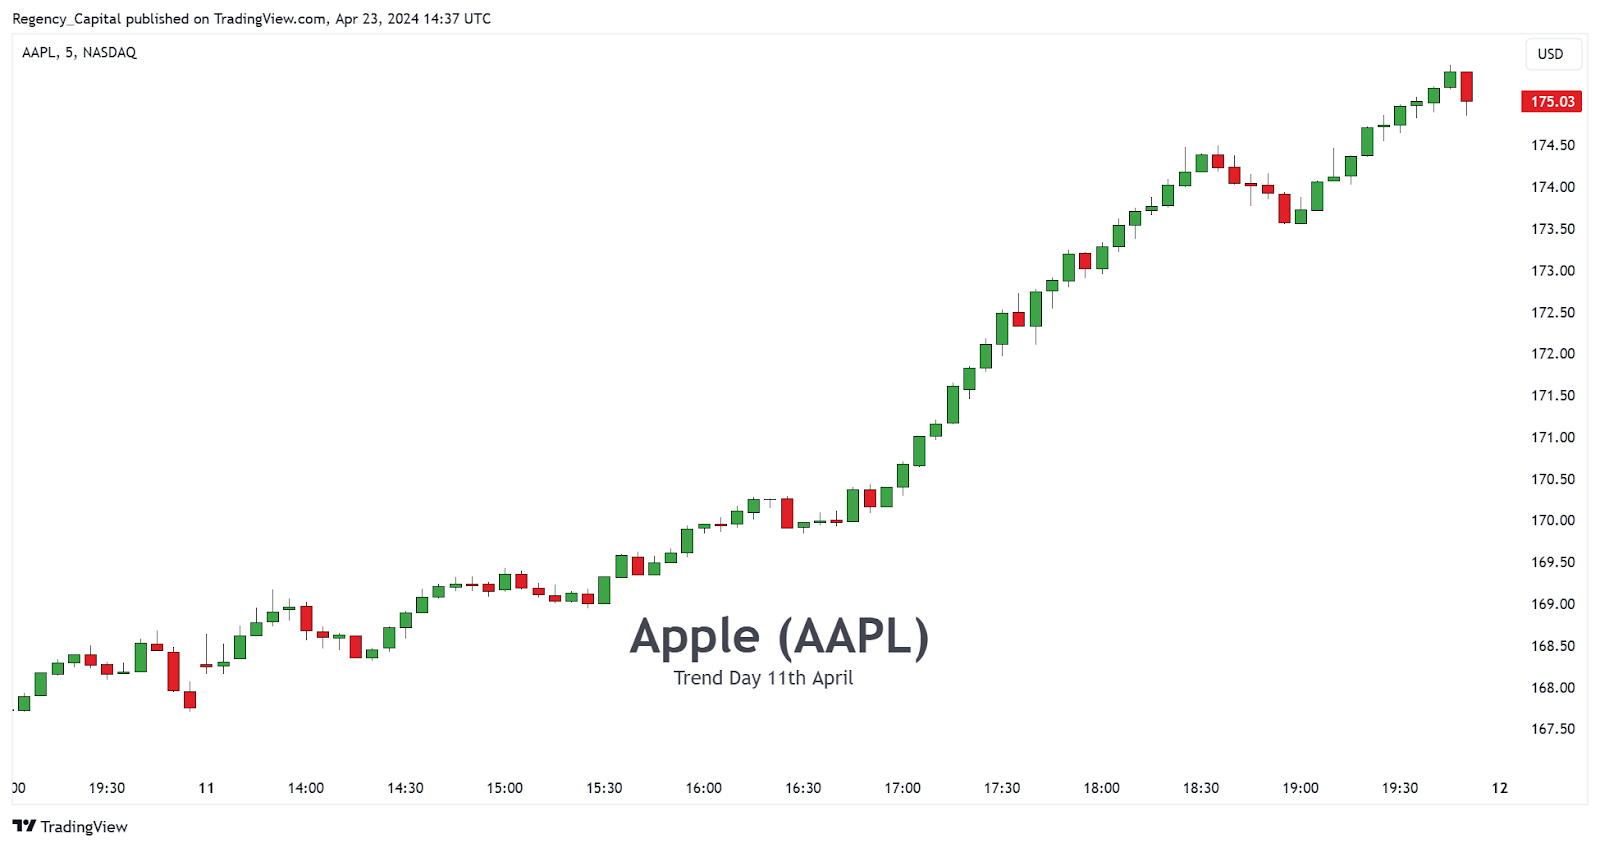
(Past performance is not a reliable indicator of future results)
3 Tools for Identifying Trend Days Early
- 1. Volume Weighted Average Price (VWAP):VWAP calculates the average price of a security weighted by trading volume. A rising VWAP suggests bullish sentiment, while a declining VWAP indicates bearishness. On trend days, prices tend to hold on one side of VWAP for the entire day.
- 2. Previous Day’s High / Low (PDH/PDL):PDH and PDL serve as key reference points for day traders, offering insights into market sentiment and potential reversal zones. On trend days, the market often breaks and holds above/below the PDH/PDL early in the session.
- 3. 9 Period Exponential Moving Average (EMA):The 9-period EMA is a popular moving average for day traders looking to identify short-term trends. On trend days, the market will trend to spend considerable periods trending above the 9-period EMA. This indicator has more nuance for identifying trend days than VWAP or PDH/PDL, but it can be a valuable addition to your day trading tool box, especially when it comes to timing pullbacks on trend days.
Examples
USD/JPY 15th April 2024
Notice how USD/JPY’s early price action broke and held above the PDH and volume remained elevated for most of the day. Also notice how the VWAP is upward sloping and how price action stayed above the VWAP all day.
USD/JPY 5min Candle Chart
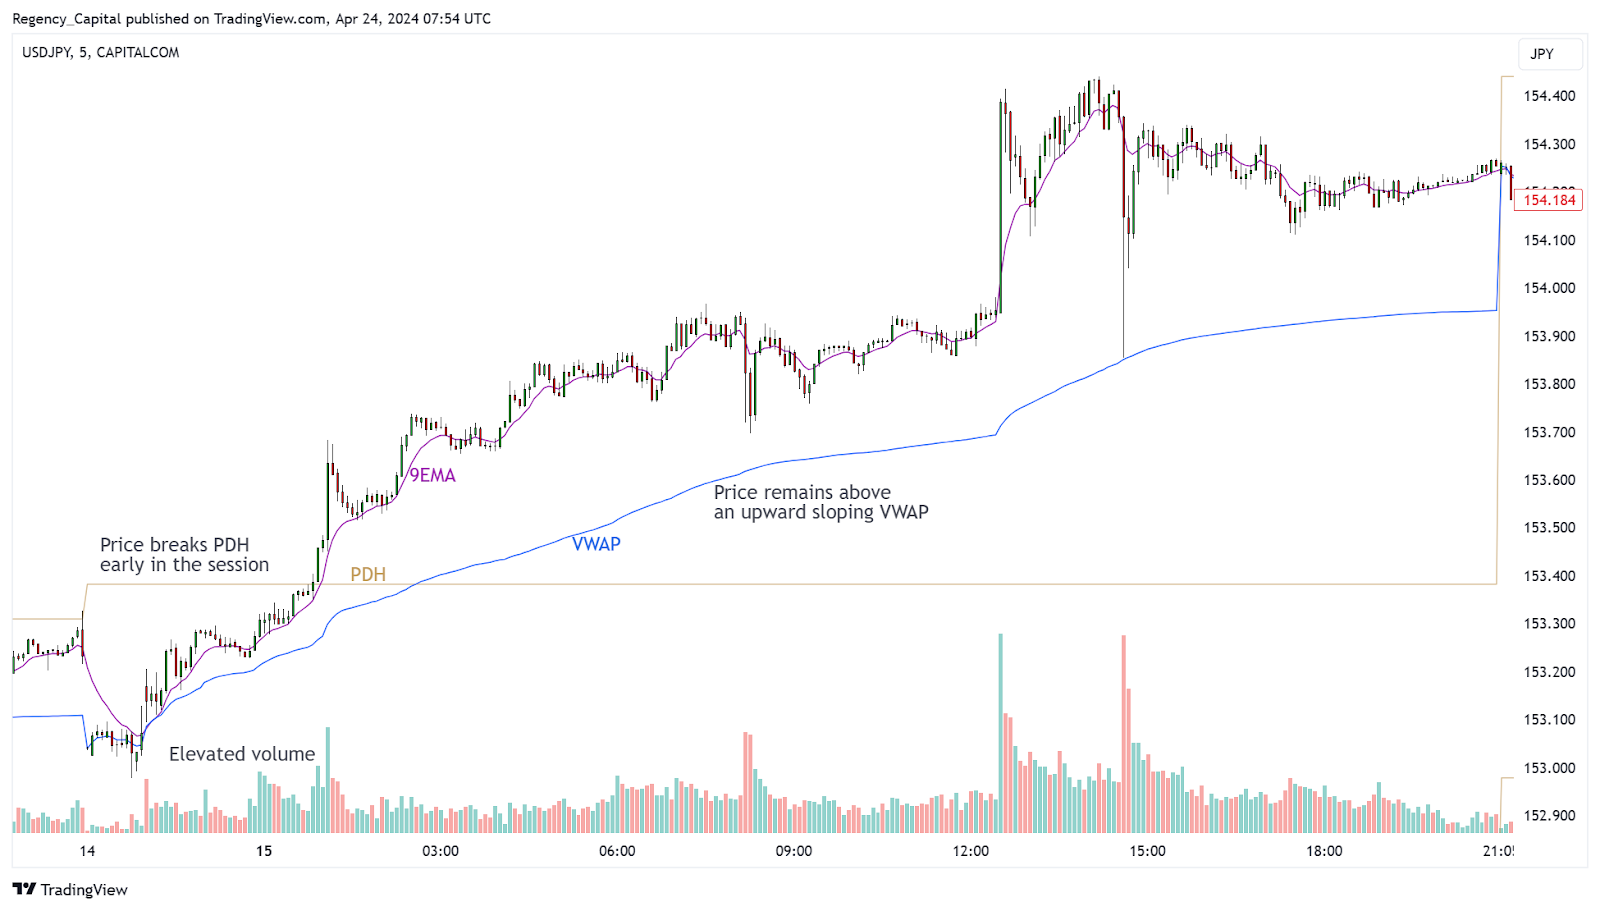
(Past performance is not a reliable indicator of future results)
S&P 500 1st March 2024
Again, note the early break above PDH on elevated volume. Note the smooth trending moves higher which respect the 9 period EMA, and the one-sided VWAP bias. These are all early signs that a trend day may be developing.
S&P 500 Daily Candle Chart
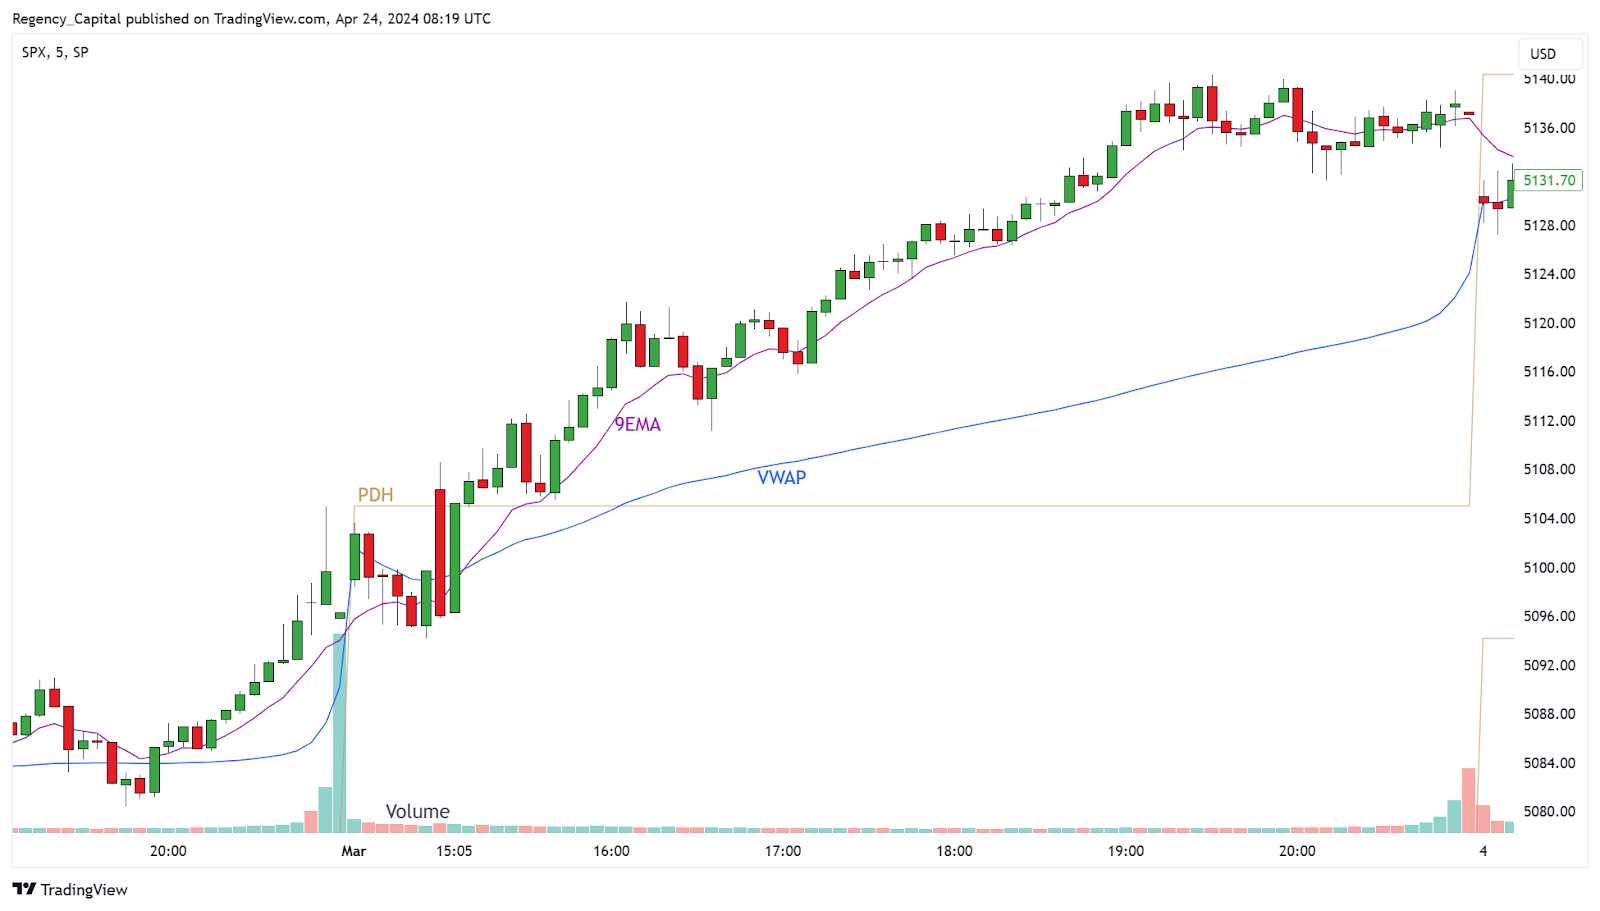
(Past performance is not a reliable indicator of future results)
Conclusion
Mastering the art of identifying trend days is a cornerstone of successful day trading. By recognising the key characteristics of trend days and utilising powerful tools such as VWAP, PDH/PDL, and the 9-period EMA, traders can position themselves to capitalise on trend trading opportunities.
In Part 2, we'll explore advanced strategies for hunting trend days and explore optimum methods for entering and managing trend day trades.