What is the risk and reward ratio?

Understanding the concept of risk/reward ratio is central to trading. Learn more about what the reward to risk ratio is, why it’s important and how to calculate it.
What is risk and reward in trading/financial markets?
Risk and reward are central concepts to CFD trading, and financial markets in general. Risk is the likelihood of incurring losses on a given position if the market goes against you, while reward refers to the potential gains (profit) if the market goes in your favour. They are integral to planning and calculating trades based on what you stand to profit if successful, or what you might lose if you’re not.
It’s crucial to strike a balance between risk and reward and identify opportunities where the potential rewards outweigh the associated risks. This means you can maximise your chances of profiting while managing the level of risk you take on. When your risk is higher than normal, it also makes sense to diversify your portfolio to include lower-risk positions to balance your overall risk profile and manage your exposure.
Why are risk and reward important?
Risk and reward are important because they underpin your trading strategy and help you make informed decisions that maximise your chance of profiting, while also preserving your capital. Assessing the risk of a trade before you make it allows you to understand whether the trade aligns with your plan and predetermined risk tolerance level.
Being especially sensitive to risk and reward also enables a well-balanced trading portfolio. Diversifying across assets may mitigate the impact of adverse events on individual markets and improve the performance of your overall portfolio. For example, let’s say you hold a position on a share that has demonstrated high volatility in recent times according to the VIX measure. Based on price action, you might expect this market to present considerable risk. For balance, you may also want to hold a position in gold, traditionally viewed as a safe haven.
How do you calculate the risk vs reward ratio?
The risk/reward ratio of a position is calculated by dividing the potential profit of the trade by the potential loss. So if your profit goal is £60 and you’re risking £20, your risk/reward ratio is 60/20 = 3, or 3:1.
To calculate the potential profit, subtract the entry price from the target price. Similarly, to calculate the potential risk, subtract the stop-loss price from the entry price.
An example of risk/reward ratio
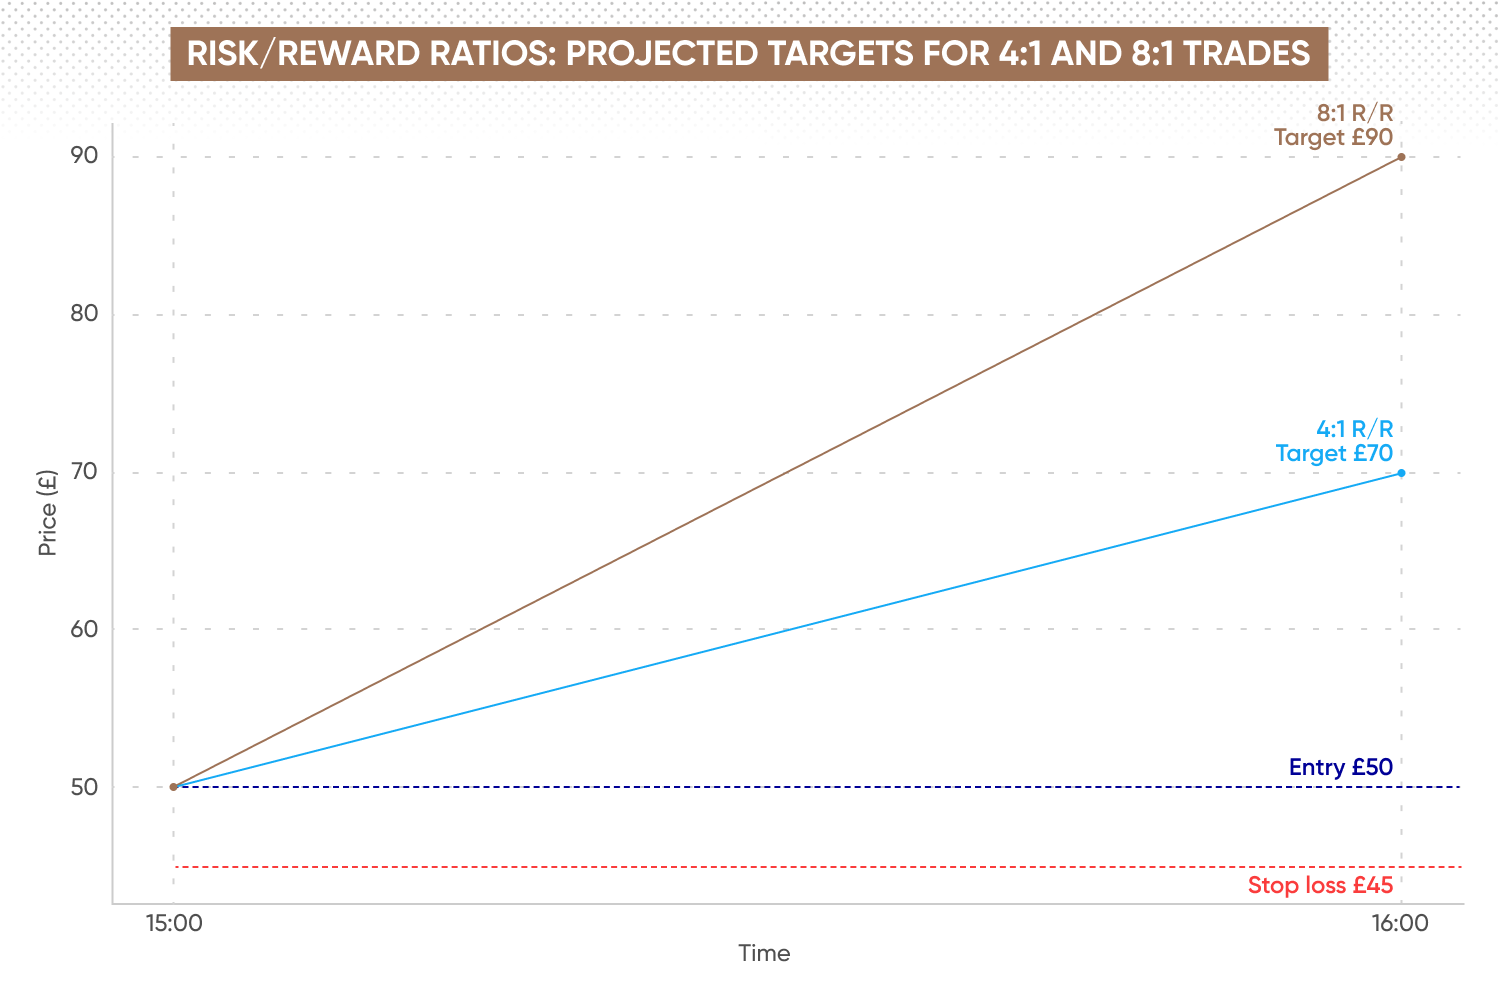
- You’re trading a share where the entry price is £50, the target price is £70 and the stop-loss price is £45.
- The potential reward is £70 - £50 = £20.
- The potential risk is £50 - £45 = £5.
In this example, the risk-reward ratio is 4:1, (£20/£5) meaning for every £1 of risk, there's the potential to gain £4. Traders often look for risk-reward ratios that are favourable to justify taking a trade, aiming for ratios where the potential reward outweighs the potential risk.
What is a ‘good’ risk/reward ratio?
What constitutes a ‘good’ risk/reward ratio depends on your trading goals, risk tolerance, and market conditions. The main goal should be to aim for a favourable risk/reward ratio where the chance of profit outweighs the risk. A risk/reward ratio less than 1:1 may not offer attractive enough returns, while a ratio of 10:1, for example, might be considered overly ambitious, as the market is less likely to move so drastically compared to the 1:1 example.
However, in markets that have demonstrated recent volatility, for example one impacted heavily by an important fundamental driver or key technical support level, a high risk/reward ratio may be appropriate. That said, taking such a position should be accompanied by careful risk management practices, including appropriate position sizing, considered stop-loss placement and an understanding of how to approach trading psychology.
FAQs
What is the risk/reward ratio?
The risk/reward ratio is a measure used by traders to assess the potential profit of a trade relative to its potential loss. It's calculated by dividing the potential reward of a trade by the potential risk. For example, if you're considering a trade where the potential reward is £300 and the potential risk is £100, the risk/reward ratio would be 3:1. A higher risk/reward ratio suggests that the potential reward outweighs the potential risk, making the trade potentially more attractive.
What is an example of risk/reward?
An example of risk/reward can be illustrated through the following simple scenario. Let's say you're considering trading a share. You put down £1,000 for a CFD trade on a share with a potential return of £1,200 if the position goes your way. Your stop-loss is at £950. Your risk is £50 (1,000-950), while the reward is the potential profit of £200 (£1,200-£1,000). Here, the risk/reward is expressed as 4:1, indicating that for every £1 you risk, you stand to gain £4.
What is the highest risk/reward ratio?
The highest risk/reward ratio is dependent on the trade being considered. Generally, the highest risk/reward ratios are found in trades with a relatively low risk and high potential reward. This might be an emerging market or innovative technology stock that is potentially undervalued now, but has strong growth prospects. It’s important to understand that higher risk/reward ratios often come with higher levels of uncertainty and volatility, requiring considered analysis and risk management.