Pulse: Q1 2023 retail investor trading trends
Pulse by Capital.com is a quarterly data report from online trading platform capital.com, revealing trends in behaviour among traders across multiple global markets.
Our traders experienced another turbulent quarter – from a white-knuckle ride into the new year, fueled by fears of how hard the global economy would fall, to the uneasy sight of big banks in turmoil.
Analysts’ initial expectations for the economy’s landing were for it to be ‘hard’ or ‘soft’. But the consensus soon changed after the release of revised data that pointed to chances of a ‘no landing’ scenario being on the cards. This backdrop of shifting economic stats made taking stock of our traders’ reactions a fascinating venture, as you can imagine.
We observed a notable rise in positions opened on interest-rate-sensitive markets, such as forex, equities and gold. Moreover, there was next-to-no variance in stop-loss and take-profit use from the previous quarter’s record highs. This indicated a continuing air of cautiousness among our traders, who understand that protecting against losses is just as important as realising gains.
Another twist in the road in the last quarter was the collapse of Silicon Valley Bank. This event catalysed the renewal of our traders’ interest in banking stocks, to which UBS’s proposed acquisition of Credit Suisse also contributed.
As a business, we continued to make adjustments to improve how we support our traders. One of note was providing greater transparency on our overnight fees. Though this may seem like a small change, its outcome is significant, as it better equips our clients to choose how they trade and for how long they hold their positions.
Trading volumes reached more than $300bn in Q1 2023,12% higher than Q4 2022. The biggest contributors were the Middle East and Australia, where overall client trading volumes were up by 40.8% and 53.8% respectively in Q1 compared to Q4 2022.
For more information about Capital.com and our products and services, Visit our website.

Peter Hetherington
CEO, Capital.com
Across the markets
Our platform gives traders access to more than 3,000 instruments from across the globe, including stocks, exchange-traded funds, forex, commodities and indices. As at the end of Q1 2023, Capital.com Group had more than 550,000 new accounts opened globally.
We have group entities globally, including in the UK, Cyprus and Australia, which are authorised and regulated by the UK’s Financial Conduct Authority, the Cyprus Securities and Exchange Commission and the Australian Securities and Investments Commission, respectively.
Highlights from this report
Key insights drawn from Capital.com trading data in Q1, 2023
- After being unable to capture significant trader interest since Q4 2021, USD/JPY became one of our first most-traded markets in Q1, potentially due to the volatility caused by Japan’s central-bank action.
- We noticed a marked uptick in GBP/USD activity. This came during a period of slowed dollar growth and a seeming restoration of confidence in the post-Truss/Kwarteng era.
- Long gold positions were popular among our traders. But this soon changed after Powell’s testimony to the Senate committee in early March. Retail trading volumes for gold CFDs then dropped a staggering 88% in one day, and our traders reduced their long positions on the commodity from 61% to 59%.
- After a bout of banks breaking down, borrowing, and eventually collapsing, our traders turned their attention to global banking stocks. This renewed interest was particularly noteworthy after the fall of Silicon Valley Banks (SVB) on 10 March. Prior to the collapse of SVB and the rout across the banking sector, Capital.com traders have typically paid little attention to this segment of the market.
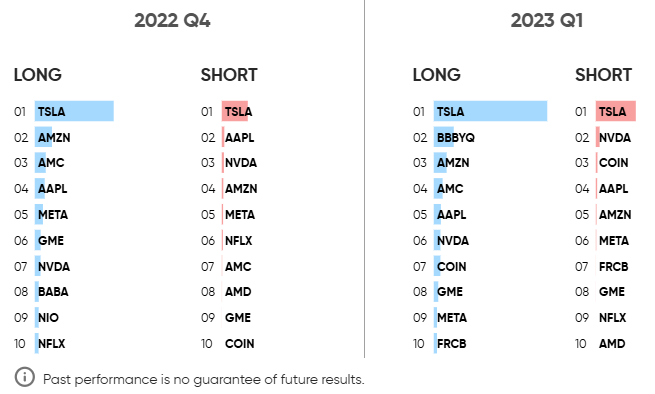
- In terms of single-stock popularity, Tesla (TSLA) held its top-traded position for a fourth consecutive quarter. Also in the top five were meme stock Bed Bath & Beyond (BBBY), e-com giant Amazon (AMZN), and tech titans Nvidia (NVDA) and Apple (AAPL). AMC Entertainment (AMC), Coinbase (COIN), GameStop (GME), Meta Platforms (META) and First Republic Bank (FRC) comprised the last five of the top ten.
- We observed insignificant changes to stop-loss use from the previous quarter’s record high of 12.9%, indicating that our clients continued to see the value in exercising caution while trading.
Trading stats
Stop-loss use remains at record levels
Use of our platform’s stop-loss (SL) and take-profit (TP) tools hit record highs at the end of 2022. So we were pleased to see that our traders had continued to carry out a risk-aware approach into Q1. This was shown by an insignificant change in stop-loss statistics, with stops applied 12.80% of the time in Q1 2023 vs 12.99% in Q4 2022.
Regular stop-loss orders get automatically triggered upon an instrument’s price reaching a specified level. Despite this, they aren’t infallible – especially during heightened market volatility. In such cases, an instrument’s price can significantly pass the stop-loss level in moments, causing the trader’s order to be executed at a worse level than specified. The result of this can be a greater-than-expected loss.
This is why we offer our traders the option to set a guaranteed stop-loss (GSL), which guarantees to exit the position at the exact price set, irrespective of volatility. This feature involves us undertaking more risk, meaning we charge a small fee if the GSL is triggered (GSL fee = GSL premium * position open price * quantity).
Most-traded markets
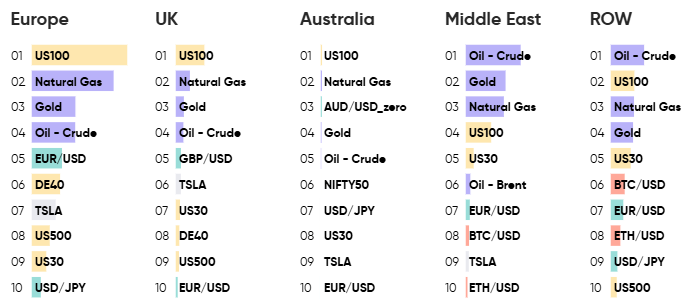
The US100 (NASDAQ) garnered the most global interest from our European, UK and Australian traders, most likely as its heavy weighting towards tech shares enables traders to gain exposure to them without having to invest in singular stocks. The so-called ‘tech-xodus’ which saw sweeping layoffs across the sector, along with the tech-banking crisis arising from the Silicon Valley Bank collapse, created ripe conditions for short-term positions.
The US100 (NASDAQ) was the most traded instrument in 3 regions out of 5
Number of trades per region.
 *Past performance is no guarantee of future results.
Crude Oil and natural gas also saw plenty of interest as the popular commodity navigated its way through the winter. With the Russian war in Ukraine raging on, and the energy crisis still reverberating through the cooler European months, fuel prices were very much in the spotlight in Q1.
Daniela Hathorn, Senior Analyst at Capital.com, said:
Tesla tops the list of most-traded single stocks
Tesla was the most traded single stock in both short and long positions
Number of trades in the last 2 quarters.
Market themes
Shifting economic data sparks an influx of interest-rate-sensitive market trades
Heading into 2023, the big debate was about the economy’s landing, with widespread concern about it being ‘hard’. But, by mid-January, soft-landing optimism prevailed – thanks to China reopening and the UK seeing unexpected GDP growth, among other factors.
For a while, analysts thought the economy was on a tightrope, with a hard or soft landing being the only possible outcomes. However, in February, revised data emerged that pointed to chances of a third scenario – it not landing at all.
So how did our traders react to this constantly changing economic outlook?
Hathorn said:
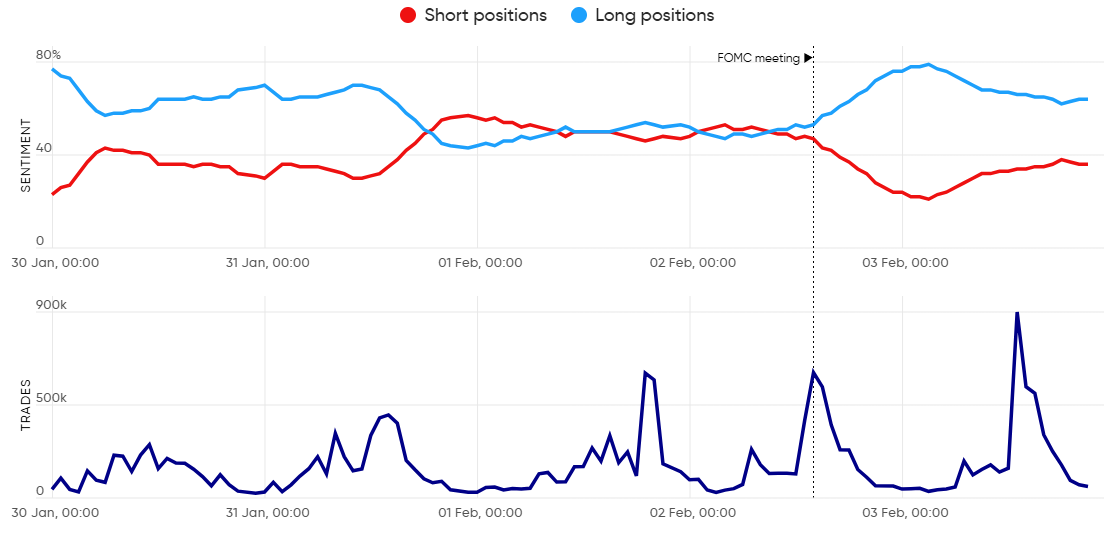
Gold gets more attention after the FOMC meeting in February
Our traders went long on gold after the FOMC’s February meeting, in which the Fed raised its benchmark interest rate by another quarter percentage point. With little indication that it was nearing the end of its hiking strategy, people naturally flocked to the safe-haven metal as an antidote to dollar instability.
Gold long trades soar after the FOMC’s meeting
Gold sentiment and number of trades.
 *Past performance is no guarantee of future results.
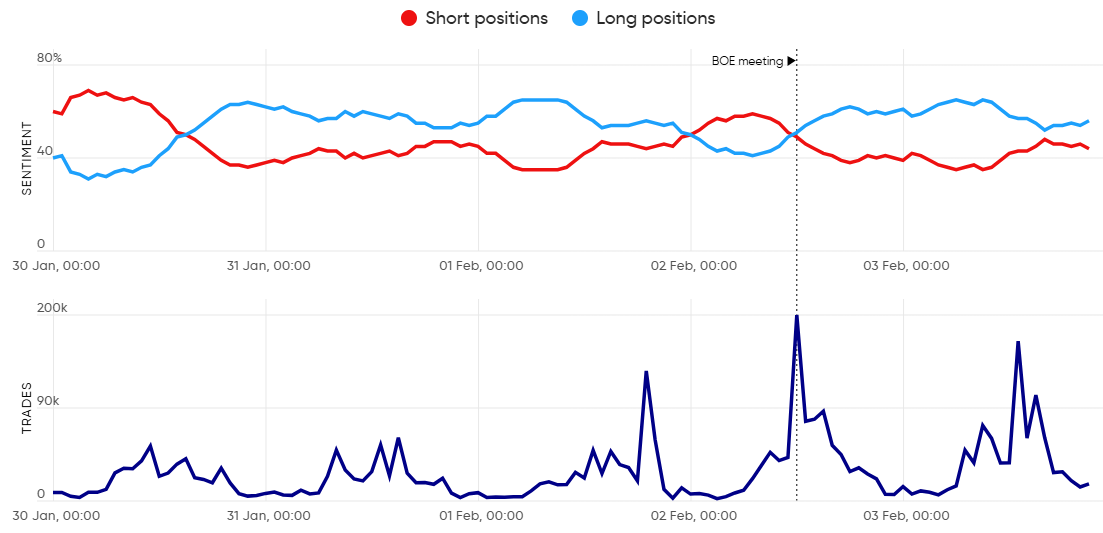
Traders show bearish GBP/USD sentiment in the build-up to BoE’s February meeting
The UK central bank hiked rates by 50 basis points (bps) in February, to 4%, in an attempt to curb inflation. Ahead of the announcement, the general feeling among traders appeared to be that the MPC was still bearish in its approach, and that such a strategy wouldn’t be enough to boost sterling. After the announcement, Governor Bailey emphasised that while the Bank has started to turn a corner in rate hikes, it was still early to decide whether there will be more rate hikes needed. As it turned out, the Bank did raise the rate again in March, to 4.25%.
GBP/USD bearish sentiment leading up to BOE’s meeting
GBP/USD sentiment and number of trades.
 *Past performance is no guarantee of future results.
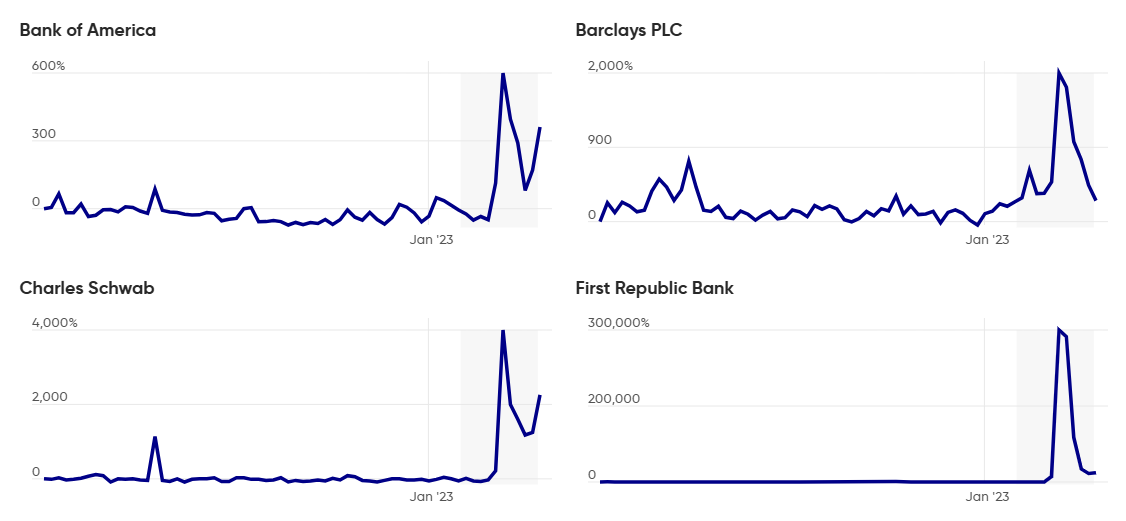
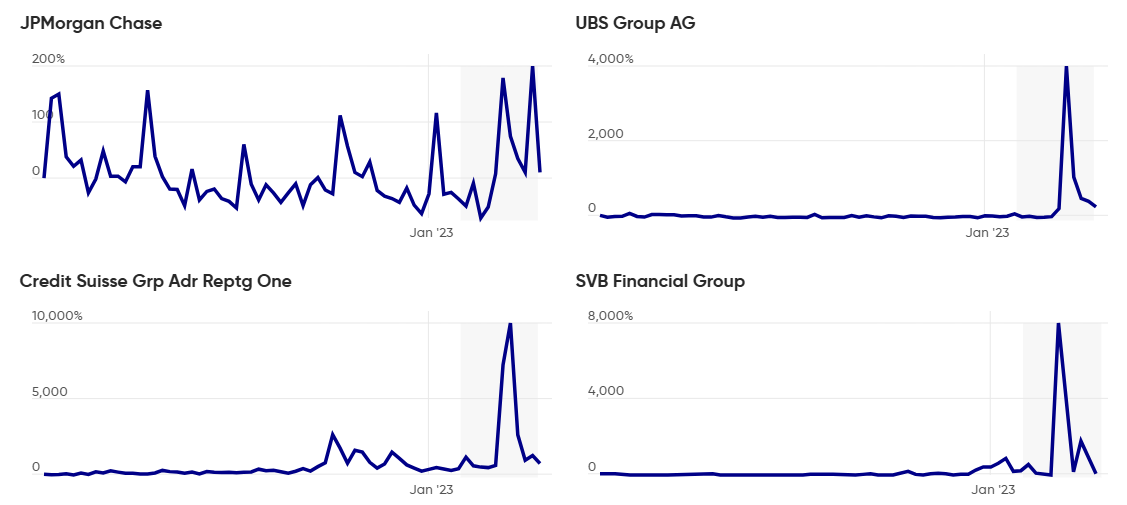
Financial sector stress turns traders’ eyes back to banking stocks
The global banking turmoil in March, kickstarted by Silicon Valley Bank’s (SVB) downfall, regenerated interest in banking stocks among our traders. As a result, trading activity on these instruments climbed significantly from the previous quarter: we saw an increase of over 8,000% in CFD positions taken on SVB shares.
Around the time that news broke of its planned takeover by UBS, total CFD trades on Credit Suisse shares climbed by 9,644%. UBS shares were of less interest to our traders, though, but still saw trading-volume gains of over 4,000%. First Republic Bank, the recipient of the $30bn Wall St rescue package, saw CFD trades on its shares climb by a staggering 314,467% on our platform. There was no clear trend with regards to sentiment, with traders taking advantage of lower bank valuations to buy the dip while simultaneously selling off the back of negative news flows.
Global banking stocks make their way back into the spotlight in March
Number of trades percentage change from start of 2023
 *Past performance is no guarantee of future results.
Reflecting on the Silicon Valley collapse, Capital.com Senior Analyst Daniela Hathorn said:
“SVB’s collapse also served to reprice expectations of the FOMC meeting being a chance to see a 50 bps hike, which became a strong probability after Powell’s hawkish comments, but was completely priced out.”
JPY picks up traction in the wake of central-bank action
Japan’s central-bank action was another key volatility event in Q1, resulting in USD/JPY emerging as one of the ten most-traded markets on the platform.
The Bank of Japan (BoJ) surprised investors by leaving its yield curve control (YCC) unchanged, going against market expectations. The decision was based mostly on the fact that the BoJ fails to see inflation remaining above 2% in the long term, which it feels would justify the need for more policy support.
This policy stance was out of sync with most other central banks. Markets were seemingly expecting some sort of amendment at this meeting, which explains the ensuing pullback in the Japanese Yen and bond yields.
USD/JPY picked up some upside momentum again after BOJ leadership candidate Kazuo Ueda appeared to support the current ultra-loose monetary policy as necessary. He showed no inclination to change it, hinting that any adjustments would depend only on upcoming data.
Looking Ahead
Our Senior Analyst Daniela Hathorn reflects on the key events sparking interest this quarter, and how this may play out into the months ahead. She said: