
GameStop stock forecast: debt exchange, Q2 profit
GameStop is a US video-game retailer. In Q2 fiscal 2026, net sales fell to $790.2m, while operating income rose to $160.2m. Explore third-party GME price targets and technical analysis. Past performance is not a reliable indicator of future results.
GameStop Corporation (GME) is trading around $19.04 at 10:29am UTC on 9 September 2026,, within an intraday range of $18.61–$19.41. Past performance is not a reliable indicator of future results.
GameStop's second-quarter fiscal 2026 results, published after market close, showed net sales falling to $790.2 million from $972.2 million a year earlier, while operating income rose to $160.2 million and net income reached $298.7 million. Results included around $238 million in eBay-related investment gains, while the company raised its Adjusted EBITDA outlook to above $650 million from above $600 million.
GameStop also completed a convertible note exchange on 3 September, retiring around $1.4 billion of notes and reducing long-term debt to approximately $2.8 billion. Digital-asset-related losses of around $75 million partly offset investment gains during the quarter (GameStop, 8 September 2026).
Third-party GameStop outlook: Q2 profit rises as sales decline
As of 9 September 2026, third-party GameStop stock predictions vary considerably, reflecting limited formal sell-side coverage alongside third-party and model-based estimates.
MarketWatch (analyst estimates)
MarketWatch shows average, high, low and median 12-month targets of $13.50, based on one tracked sell-side analyst. The identical figures reflect the limited breadth of coverage in its dataset (MarketWatch, 29 August 2026).
MarketBeat (consensus rating)
MarketBeat reports a consensus hold rating and average 12-month target of $13.50, while noting that Wall Street Zen raised its own rating from hold to buy. Its consensus is based on one tracked analyst report (MarketBeat, 6 September 2026).
TipRanks (AI Analyst)
TipRanks' AI Analyst projects a 12-month target of $24, around 31% above the price used by the tool at the time. It cites profitability and valuation, while its technical indicators return a sell signal (TipRanks, 1 September 2026).
Tickeron (earnings preview)
Tickeron reports a sell or strong-sell rating from the lone tracked formal analyst, with a target near $13.50. It separately cites other estimates averaging $31.50 and a Morgan Stanley target of $37 (Tickeron, 6 September 2026).
MoneyCheck (earnings preview)
MoneyCheck reported a consensus hold recommendation ahead of GameStop's second-quarter results, with analysts expecting limited near-term upside relative to the prevailing trading range (MoneyCheck, 1 September 2026).
Predictions and third-party forecasts are inherently uncertain, as they cannot fully account for unexpected market developments. Past performance is not a reliable indicator of future results.
GameStop latest earnings: second-quarter fiscal 2026 results
GameStop released its second-quarter fiscal 2026 results on 8 September, covering the 13 weeks ended 1 August. Net sales fell to $790.2m from $972.2m a year earlier, while operating income rose to $160.2m from $66.4m and net income reached $298.7m from $168.6m.
Collectibles sales rose 57% year on year to $356.3m, representing 45.1% of total sales versus 23.4% a year earlier. GameStop held $5.4bn in cash, cash equivalents, marketable securities and digital assets, alongside an eBay equity investment valued at around $4.9bn.
On 3 September, GameStop retired around $1.4bn of convertible notes, reducing long-term debt to approximately $2.8bn. It also raised its fiscal 2026 adjusted EBITDA outlook to above $650m from above $600m (GameStop, 8 September 2026).
Past or simulated performance is not a reliable indicator of future results, and forward-looking guidance figures are inherently uncertain.
GME stock price: technical overview
The GME stock price trades near $19.04, above its 20-day simple moving average but below its 50-, 100- and 200-day averages at roughly $18, $20, $22 and $22 respectively. This places the price between shorter- and longer-term references.
The 14-day relative strength index stands at 47.46, within neutral territory, while the average directional index is 26.15, indicating some trend strength without showing its direction.
The nearest resistance references sit at $19.99 and $21.60, while lower references include the classic pivot near $18.89, the 20-day average near $18.44 and S1 near $17.85. These are technical reference points rather than predictions (TradingView, 9 September 2026).
This is technical analysis for informational purposes only and does not constitute investment advice or a recommendation to buy or sell any instrument.
GameStop share price history (2024–2026)
As of 10:29am UTC on 9 September 2026, GME’s stock price closed at $21.09 on 10 September 2024 and later reached a two-year intraday high of $37.55 on 28 May 2025 before falling back into the low $20s by mid-June.
The stock ended 2025 at $20.50. In 2026, shares traded largely between $18–$26, spending much of the spring above $23 before moving lower through the summer. They reached $18.60 on 3 August before further volatility around the company's convertible-note restructuring.
GME closed at $19.05 on 9 September 2026, around 8.2% lower year to date and 23.8% lower year on year.

Past performance is not a reliable indicator of future results. Share prices are indicative and may differ from live market prices.
GameStop (GME): Capital.com analyst view
GameStop's performance has increasingly reflected its cash and investment holdings alongside its retail operations. A larger cash position and lower debt may provide greater balance-sheet flexibility, while falling retail sales and the contribution of investment gains to recent profits could weigh on perceptions of earnings quality.
Stronger operating results or investment gains may support sentiment, while weaker retail sales or investment losses could weigh on the shares. Retail-investor activity may also contribute to short-term moves in either direction. Past or simulated performance is not a reliable indicator of future results.
Capital.com’s client sentiment for GameStop CFDs
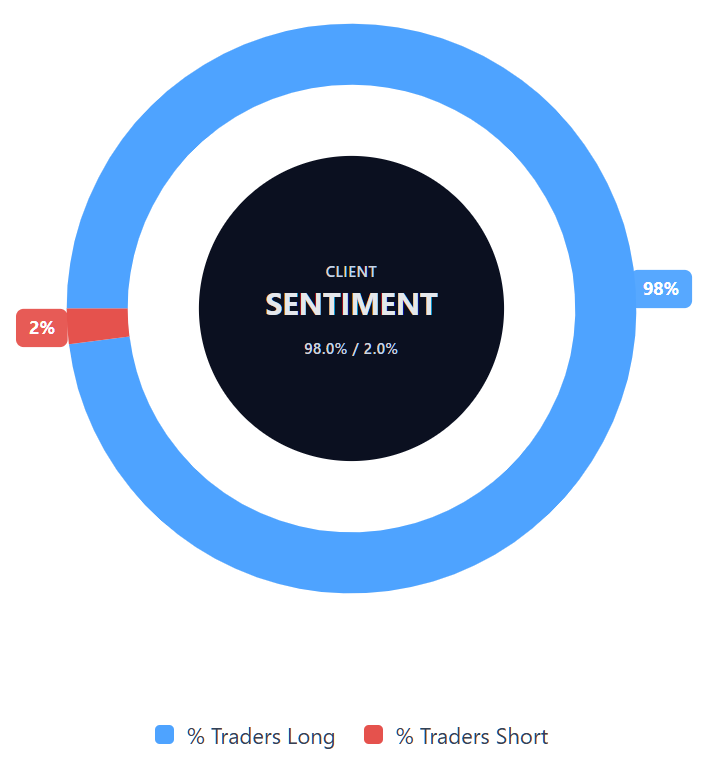
As of 9 September 2026, Capital.com client positioning in GameStop CFDs is weighted towards long positions, with 98% long and 2% short. This reflects open positions at the time of measurement rather than future price direction and can change.
Summary – GameStop 2026
- As of 10:29am UTC on 9 September 2026, GameStop traded near $19.04, within an intraday range of $18.61–$19.41.
- According to TradingView data, the stock was above its 20-day moving average but below its 50-, 100- and 200-day averages, with RSI near 47.5 and ADX near 26.2.
- Key factors include lower retail sales, higher operating income, investment gains and September's convertible-note exchange.
- Stronger operating or investment performance may
Past performance is not a reliable indicator of future results.
FAQ
Who owns the most GameStop stock?
This article does not identify GameStop's largest shareholder or provide a breakdown of its ownership structure. Instead, it focuses on recent earnings, investment holdings, debt reduction, analyst forecasts and share-price performance. Ownership can change over time as institutional, retail and other investors adjust their positions, so current shareholder disclosures would need to be checked separately when assessing who holds the largest stake in GameStop.
What is the five-year GameStop share price forecast?
The article does not provide a five-year GME stock forecast. The third-party estimates covered here focus mainly on 12-month targets, ranging from $13.50–$37. Longer-term forecasts carry greater uncertainty because GameStop's retail performance, investment returns, balance sheet and wider market conditions can change substantially over several years. These estimates should therefore be treated as scenarios rather than reliable indications of where the share price may trade in five years.
Is GameStop a good stock to buy?
This article does not classify GameStop as a good or bad stock to buy. A larger cash position, lower debt and stronger operating income may support sentiment, while falling retail sales and the contribution of investment gains to recent profits could weigh on it. Third-party forecasts also vary widely, reflecting limited formal analyst coverage. These factors provide context for assessing the stock but do not amount to an investment recommendation.
Could GameStop stock go up or down?
Yes. GameStop shares can move in either direction as company-specific and market conditions change. Stronger operating results, further investment gains or improving retail performance could support sentiment, while weaker sales, investment losses or renewed balance-sheet pressures could weigh on the shares. Retail-investor activity may also contribute to short-term volatility in either direction. Technical levels can provide reference points, but they do not reliably predict future price movements.
Should I invest in GameStop stock?
Whether GameStop shares are suitable for you depends on your circumstances, objectives and tolerance for risk, and this article does not provide investment advice or a personal recommendation. Factors to consider include retail sales, operating performance, investment gains and losses, debt levels, cash holdings and retail-investor activity. Each can influence the share price positively or negatively, while unexpected developments may change the outlook. Past or simulated performance is not a reliable indicator of future results.
Can I trade GameStop CFDs on Capital.com?
Yes, you can trade GameStop CFDs on Capital.com. Trading share CFDs lets you speculate on price movements without owning the underlying asset and to take long or short positions. However, contracts for difference (CFDs) are traded on margin, and leverage amplifies both profits and losses. You should ensure you understand how CFD trading works, assess your risk tolerance, and recognise that losses can occur quickly.