
Brent tests $104 as shipping attacks renew supply concerns
Can Brent push through its September ceiling? Tanker attacks, freight rates and inventories are set against the key levels on the four-hour chart.
Brent has pushed towards $104 as Houthi strikes on Saudi Arabia, the heaviest week of tanker attacks around Hormuz since the Iran war began and record freight costs to Asia bring the security of Middle Eastern supply back into focus. With a hurricane curbing US offshore output and diesel stocks already low, the question is whether these pressures can outweigh recovering Gulf exports and faster emergency stock releases.
Brent futures rose by around 4% at one point on 8 October, a day after International Energy Agency (IEA) members agreed to speed up emergency stock releases. That decision produced only a modest dip, and Thursday’s rally suggests the plan has done little so far to ease concerns about supply.
On the four-hour chart, Brent CFDs reached 104.534 on 8 October, the highest level on that feed since mid-September, as tanker attacks and US Gulf shut-ins drove the rally. The price then slipped back beneath resistance near 103.86, suggesting the market is not yet prepared to price in a sustained disruption. Where four-hour candles close relative to that level will provide a clearer signal than the intraday high.
Since retreating from the September peak near 107.80, Brent has traded broadly between 95.39 and 103.86, and the range reflects the balance in the fundamentals. Lows have moved higher, from around 94.00 on 22 September to around 96.50 on 7 October, as buyers stepped in on each dip while supply risks persisted. Rallies have stalled near 103.86 in late September and early October as recovering Gulf exports and the prospect of emergency releases capped the advance. Wicks below 95.39 support treating that level as a zone rather than an unbroken floor.
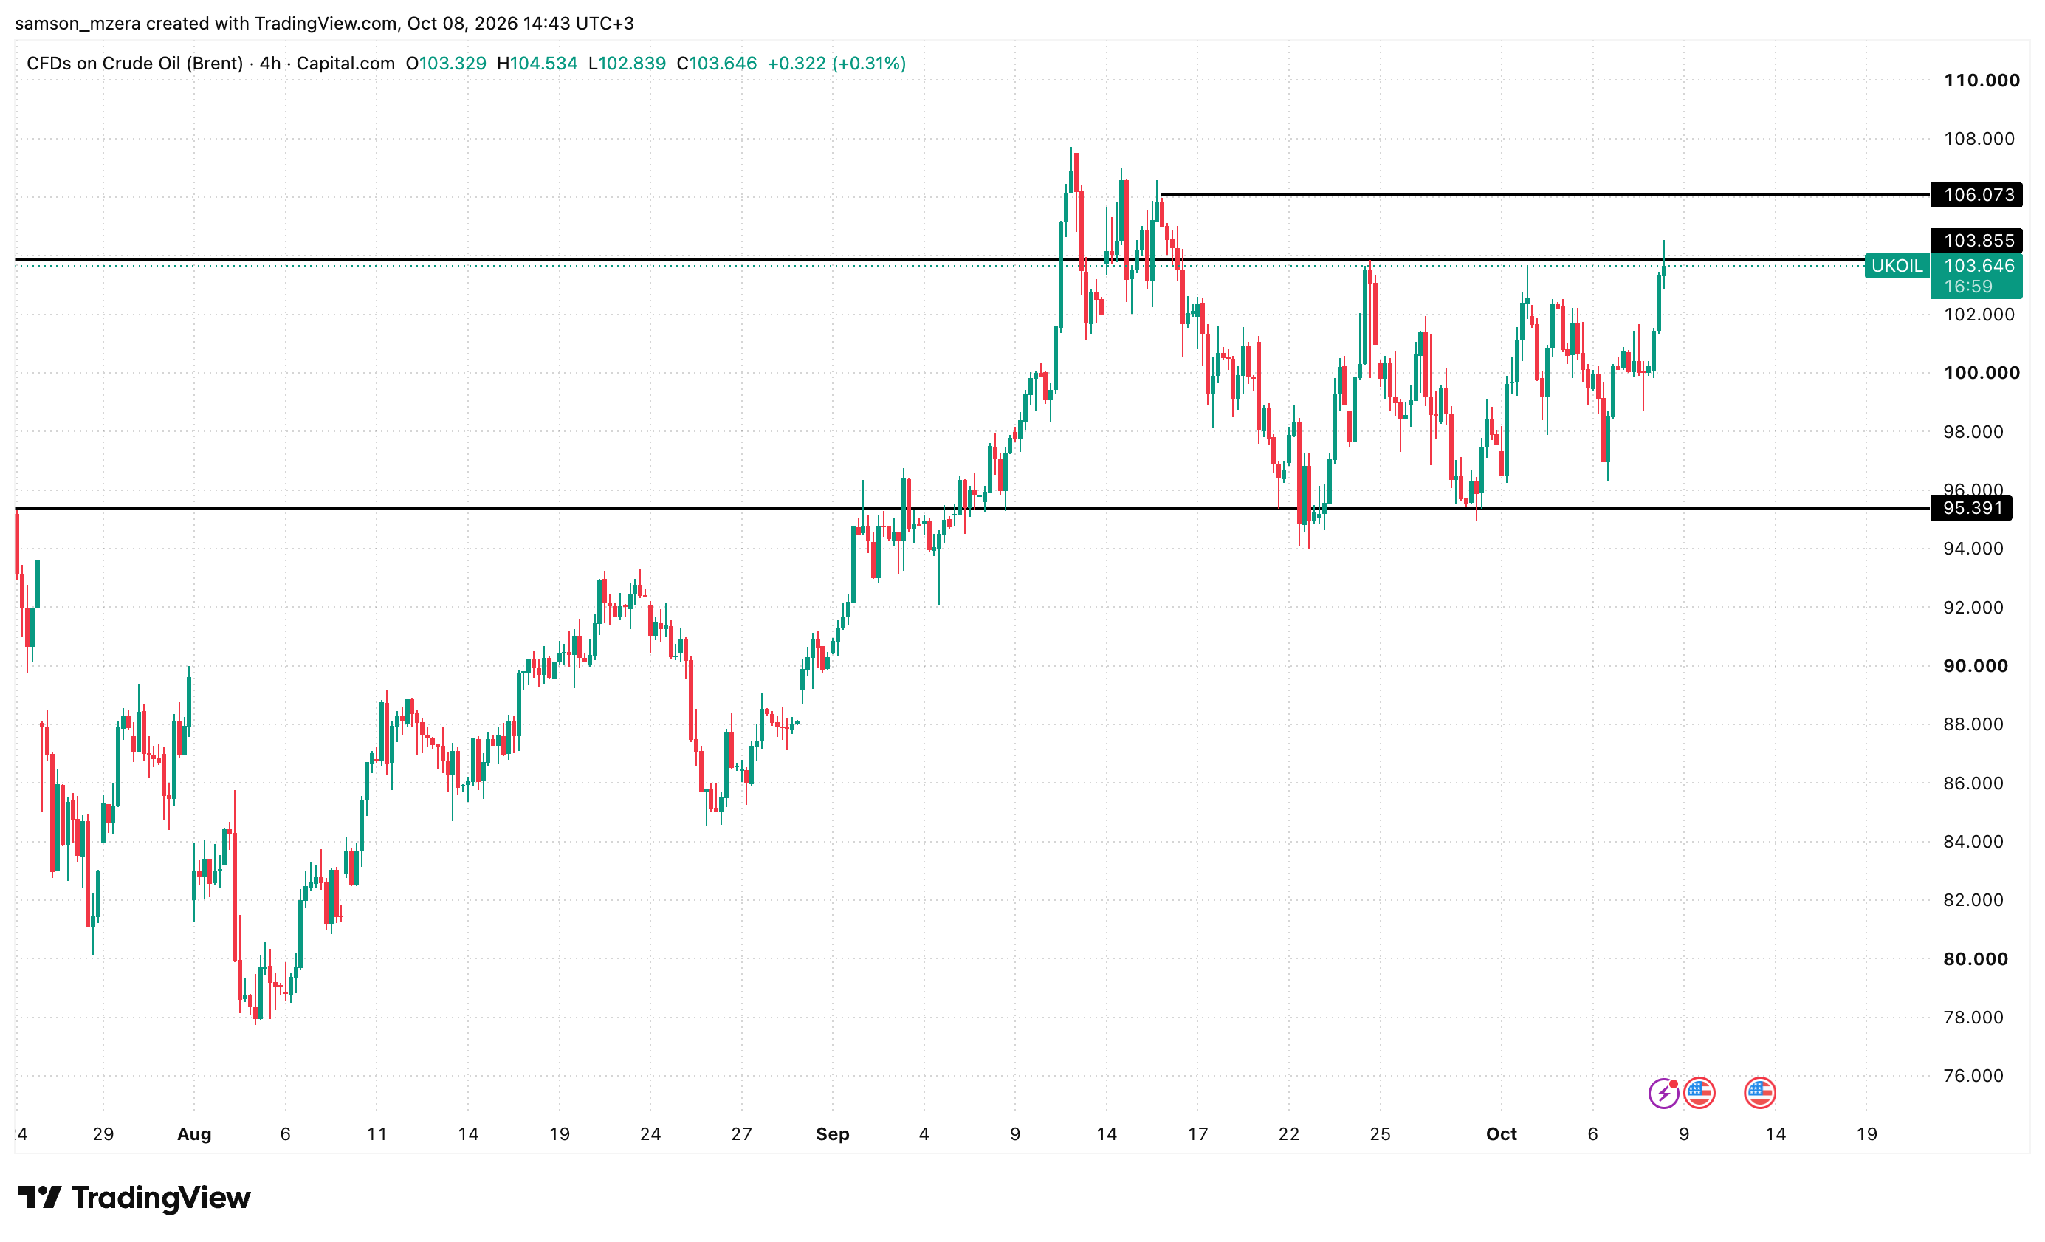
Brent CFD, four-hour chart, 8 October 2026, 14:43 UTC+3. Source: Capital.com via TradingView. Past performance is not a reliable indicator of future results.
The move reflects concern about how reliably oil can reach buyers, rather than a confirmed loss of Middle Eastern production.
Houthi strikes on airports in Abha and Riyadh on 6 and 7 October killed three people, according to Saudi authorities. The attacks did not hit oil supply, but they widen a conflict in which the Houthis control much of Yemen’s Red Sea coast near Bab el-Mandeb, a route Gulf exporters have relied on more heavily since Hormuz came under pressure.
Hormuz itself remains exposed. Maritime security sources counted at least 12 attacks on tankers in the strait in the week to 5 October, the most since the war began. On 7 October, a tanker north of Qatar was struck by multiple projectiles, with casualties reported.
Shipping costs show the strain. The rate for carrying crude from the Gulf to China hit a record $1.3 million a day on 5 October, against an average of close to $60,000 a day last year, according to Baltic Exchange data. Poten & Partners estimates this adds almost $33 to each barrel shipped to Asia. Higher delivered costs could push Asian refiners towards Atlantic Basin crude priced against Brent. Against that, Gulf exports exceeded pre-war levels for about half of September, and the latest attacks threaten that recovery rather than having reversed it.
Inventories offer a limited buffer. US commercial crude stocks fell by 3.2 million barrels in the week to 2 October, against expectations of a build, although they remain about 1% above the five-year average. Diesel is tighter, with East Coast distillate stocks 32% below their seasonal average in September. Hurricane Isaias has also shut in around a quarter of US Gulf oil output as a precaution. A quick restart would limit the impact, while damage to Gulf Coast refineries would be a bigger concern.
The main relief comes from emergency stocks. The IEA is accelerating the release of around 100 million barrels still outstanding from its March programme, prioritising diesel. Those barrels can ease short-term shortages, but sustained relief depends on safer shipping and steadier production.
What to watch
The area around 103.86 is where the chart and the fundamentals meet. A break above it would indicate the market is pricing disruption as more than temporary; continued rejection would suggest recovering flows and emergency stocks are still holding prices in check.
If further shipping attacks, elevated freight rates or a slow restart of US offshore output keep supply concerns in focus, four-hour closes above 103.86 followed by a successful retest would strengthen the breakout case and bring 106.07 into focus, followed by the September high near 107.80. These are resistance references rather than assured targets.
If attacks ease, Gulf offshore output restarts quickly and IEA barrels reach the market, prices would be more likely to remain within the range. The 100.00 area, where prices consolidated in early October, would be the first reference, with the 7 October higher low around 96.50 and the broader support zone near 95.39 below. A break beneath 96.50 would end the sequence of rising lows, while a sustained move below 95.39 would mark a breakdown from the range and suggest the market sees the supply risk receding.
For now, Brent has tested the top of its range without confirming a break. The next move is likely to depend less on a single session than on whether the disruption to shipping proves persistent.