S&P 500 Finds Resistance at 6,850 As Oracle Tests Key Support
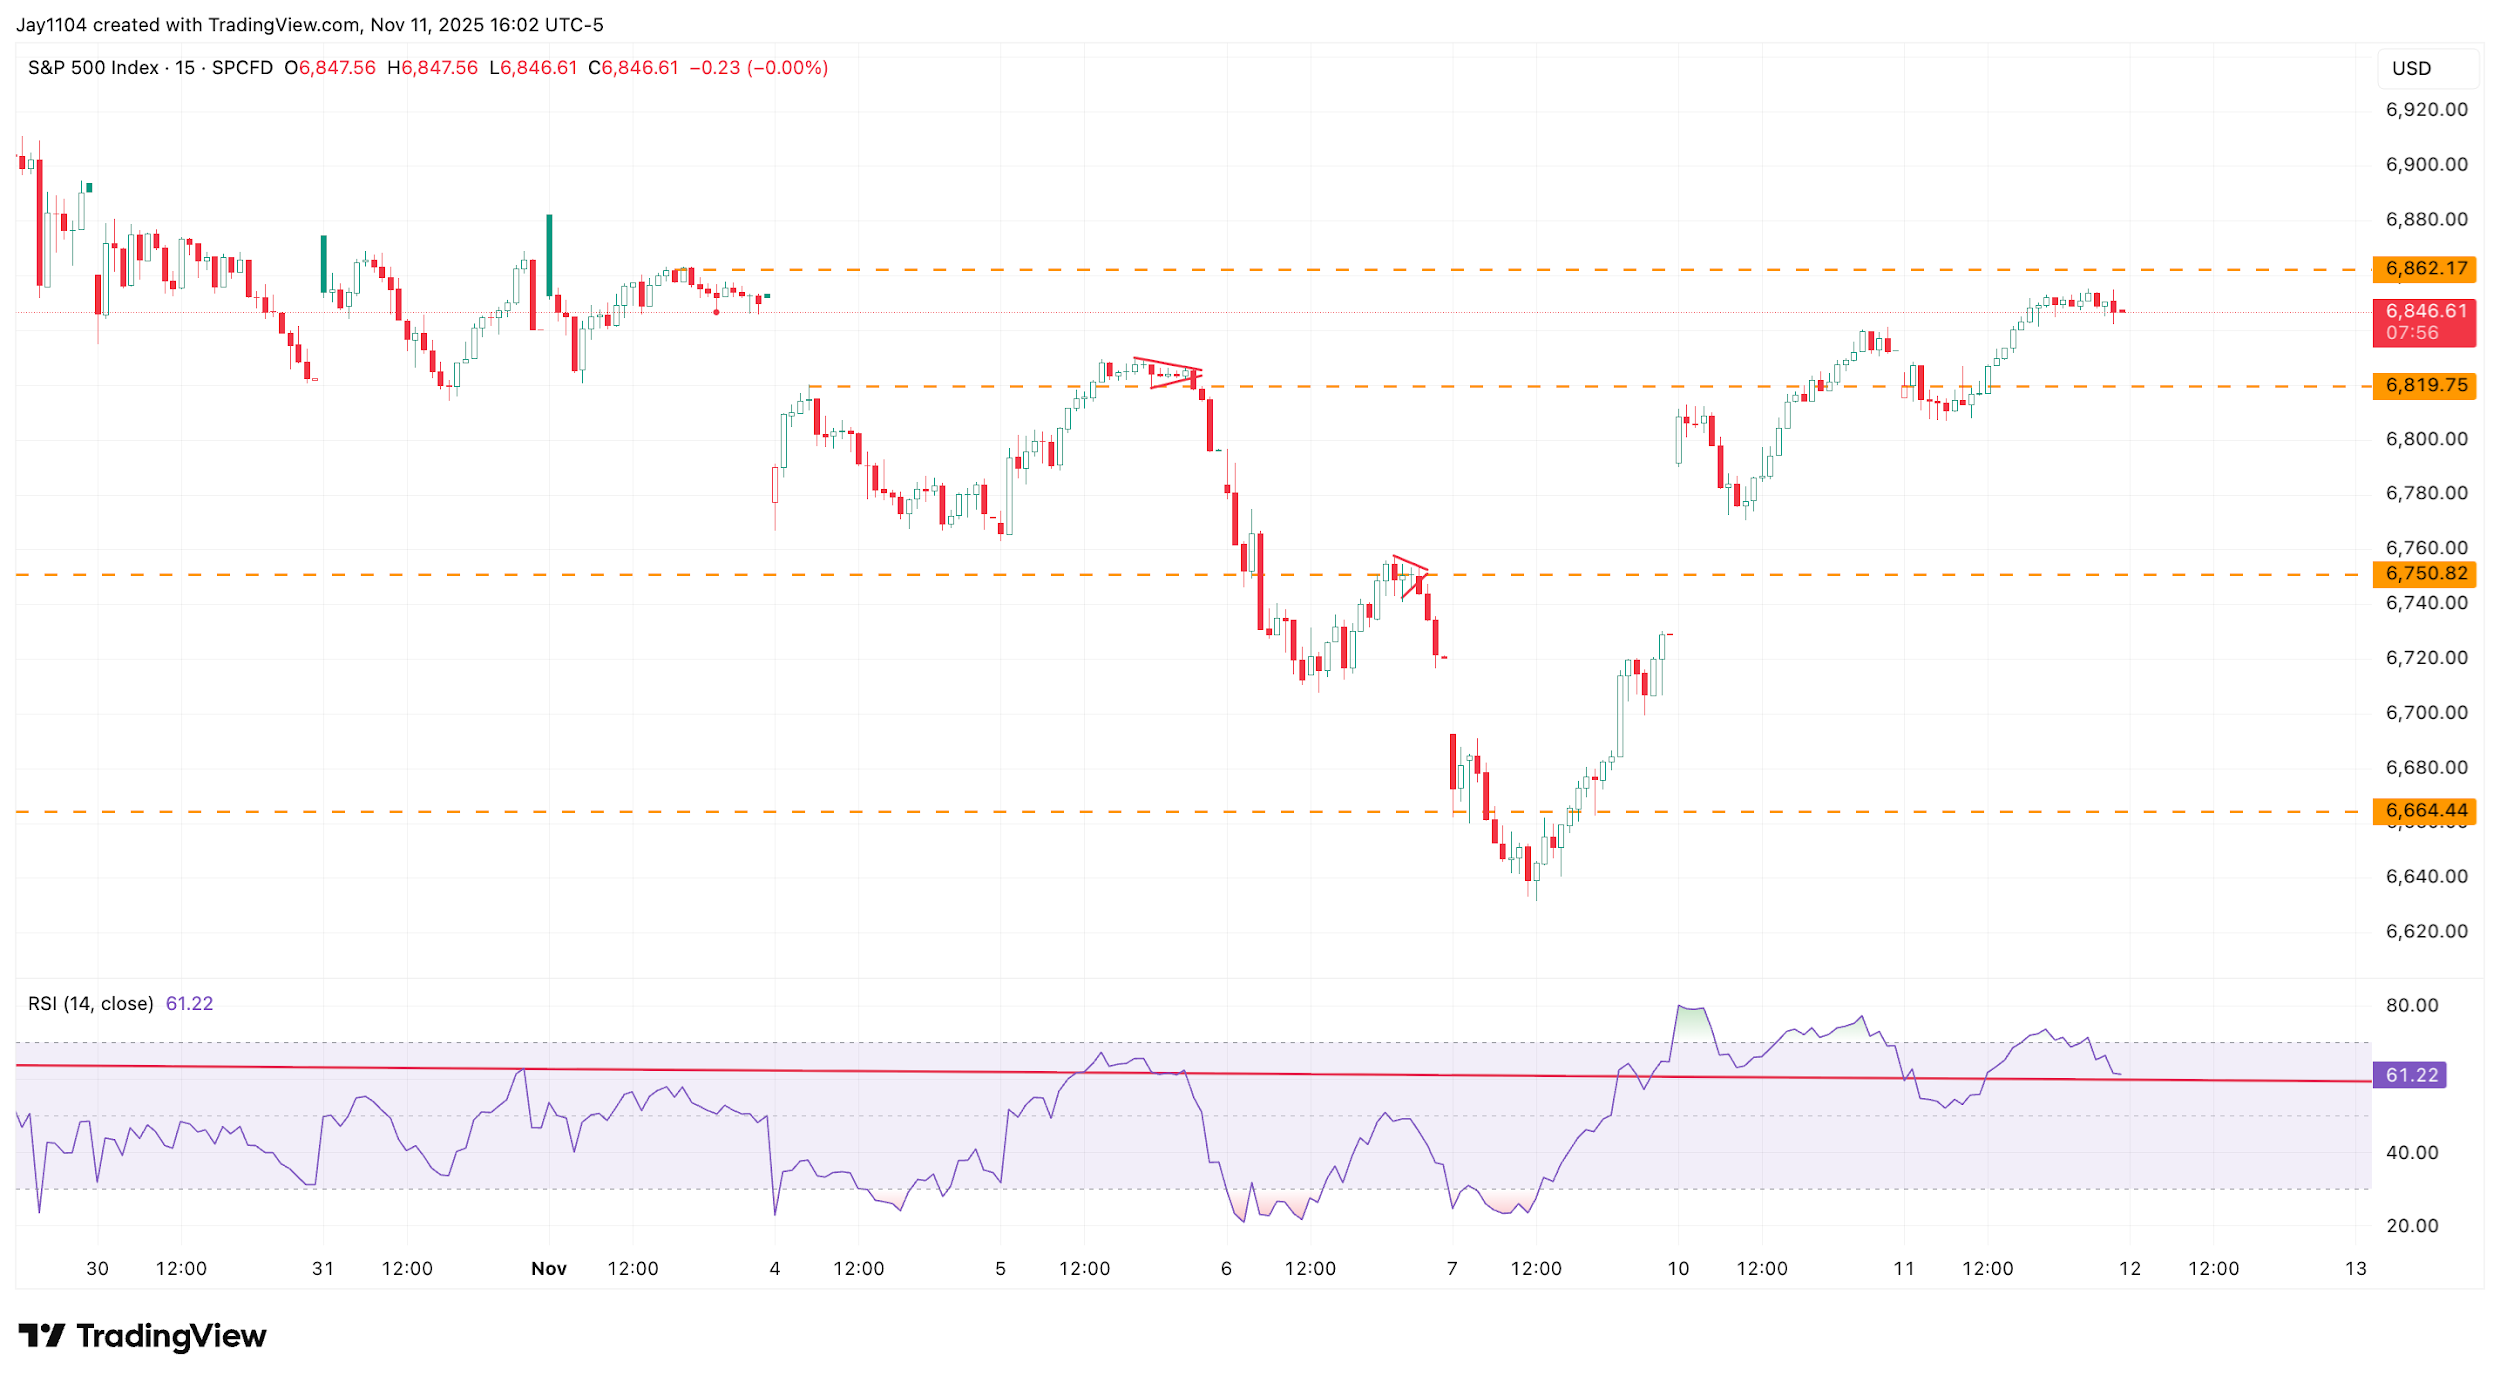
The S&P 500 rose by roughly 20 basis points on 11 November; however, the move was much more subdued than that on 10 November.
This was mainly because implied volatility, as noted on 10 November, had already been reset. As a result, the market lacked the higher implied volatility needed to drive hedges to unwind, which pushes the index’s value up.
(Source: TradingView)
Past performance is not a reliable indicator of future results.
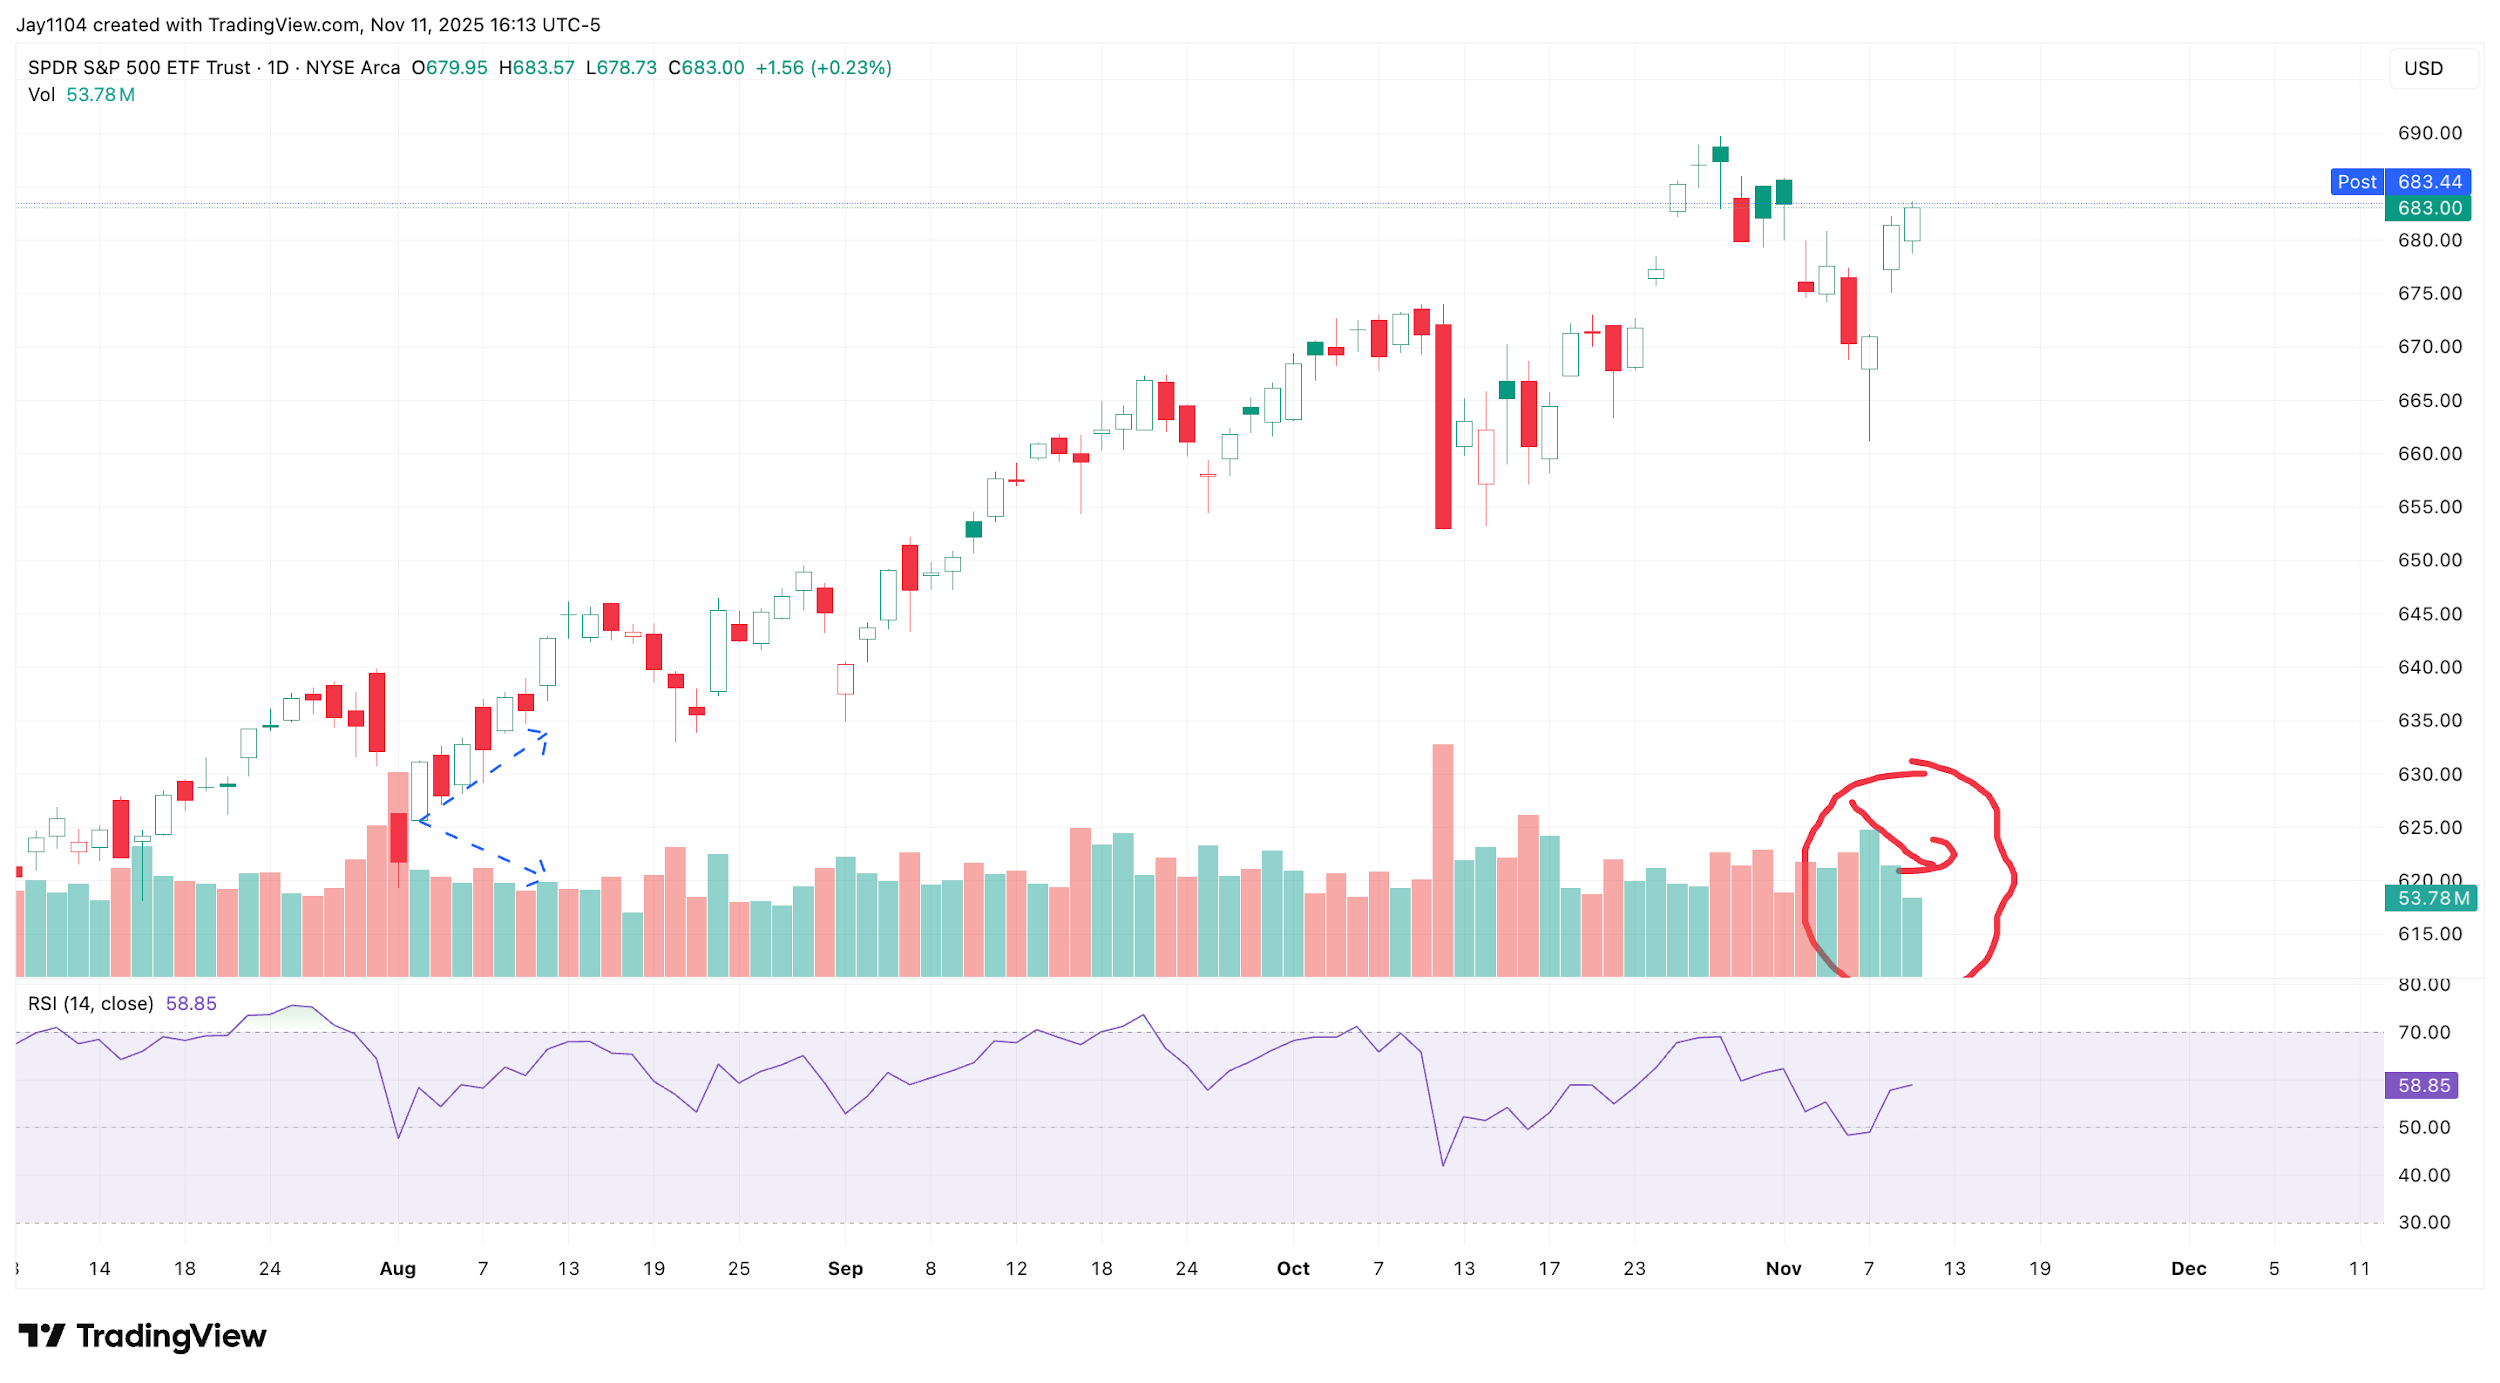
More interestingly, the index appeared to stall at a major option gamma level around 6,850, which also helped to cap the index as we move into midweek. Tuesday was a US holiday—Veterans Day—so the bond market was closed. With the bond market shut, trading volumes in the SPDR S&P 500 ETF (SPY) were lighter than usual, resulting in an incomplete trading session.
(Source: TradingView)
Past performance is not a reliable indicator of future results.
The S&P 500, therefore, depended heavily on options positioning, which kept the index near the 6,850-gamma level. A breakout on 12 November could push the index to test the next key gamma level, at 6,900, but that seems unlikely. From a technical standpoint, the index could rise to around 6,860, but the remainder of the week is likely to be more challenging due to US Treasury settlement dates on Wednesday and Thursday, as liquidity is needed to fund those Treasury purchases.
Healthcare’s Big Advance
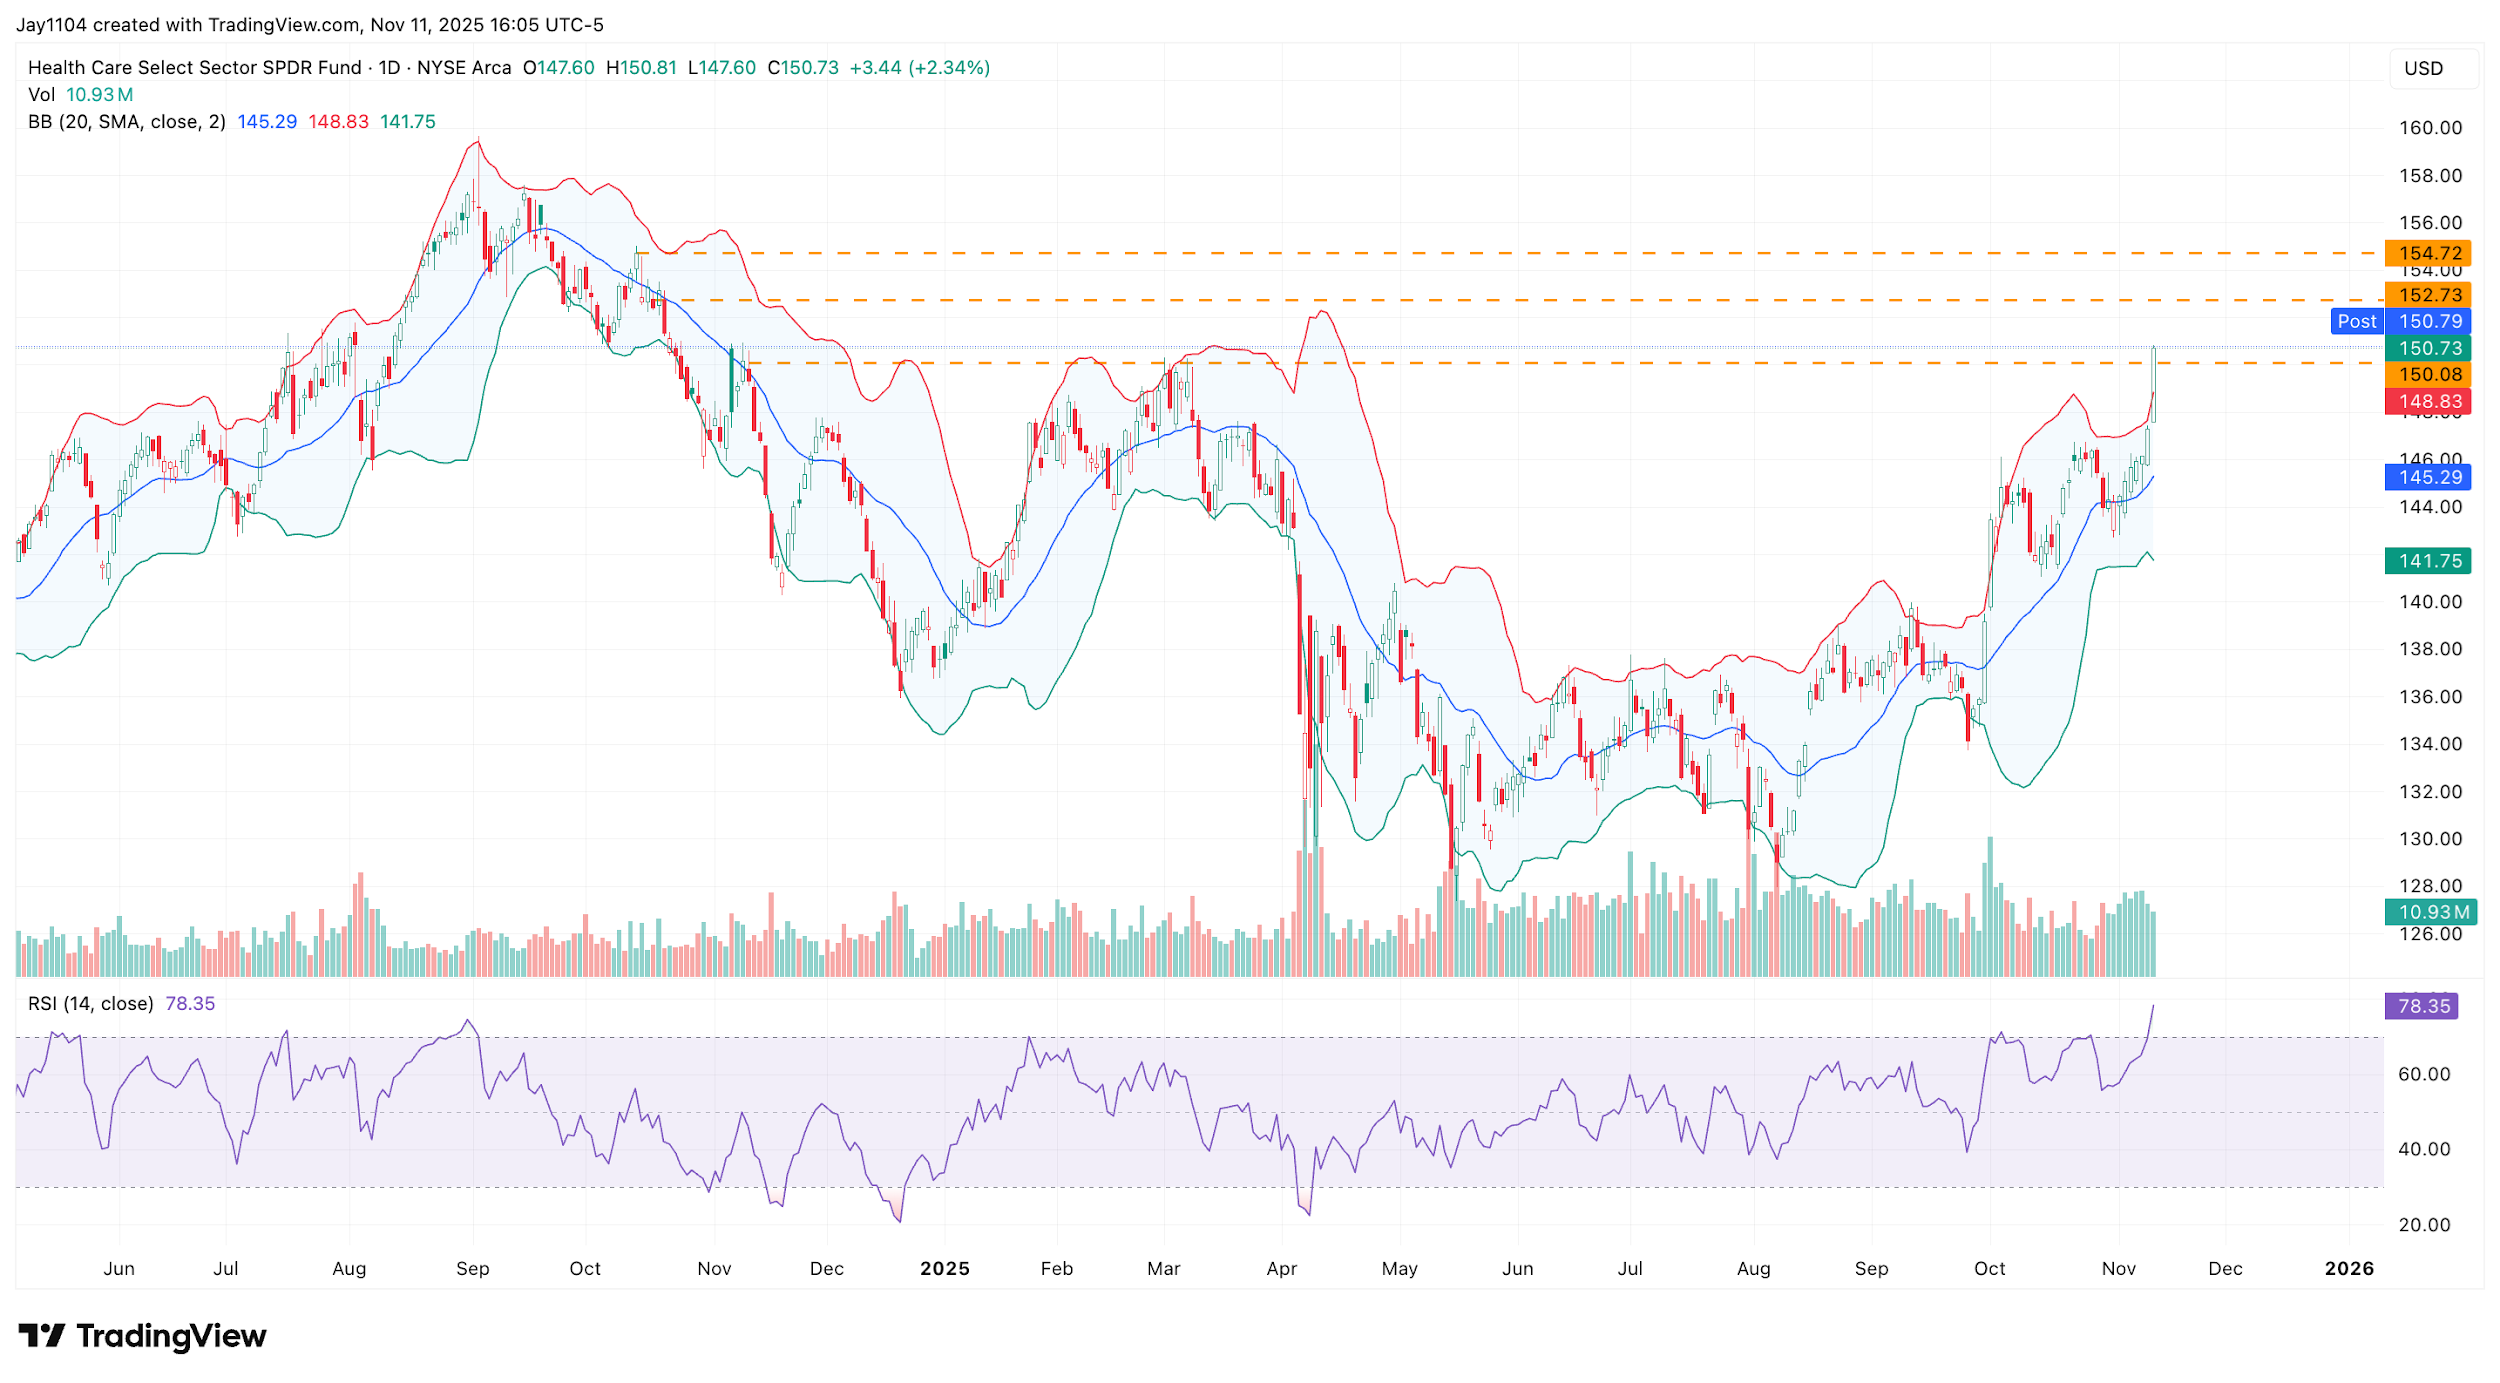
The healthcare sector had a strong day, with the Select Sector SPDR XLV ETF rising by more than 2%. The ETF is now approaching a major resistance level around $150, which dates to November 2024. This level has previously acted as a resistance level on two occasions.
It is worth noting that the ETF is now entering overbought territory, trading above its upper Bollinger Band, with the RSI reaching 78.4. This suggests that the ETF is currently overbought and could consolidate for a few days or even pull back towards the 20-day moving average near $146, with the potential to move higher again.
Should the ETF break above the $150 resistance level and push further into overbought territory, the next potential target range would be around $152.5 to $154.
(Source: TradingView)
Past performance is not a reliable indicator of future results.
Oracle Bounce Back
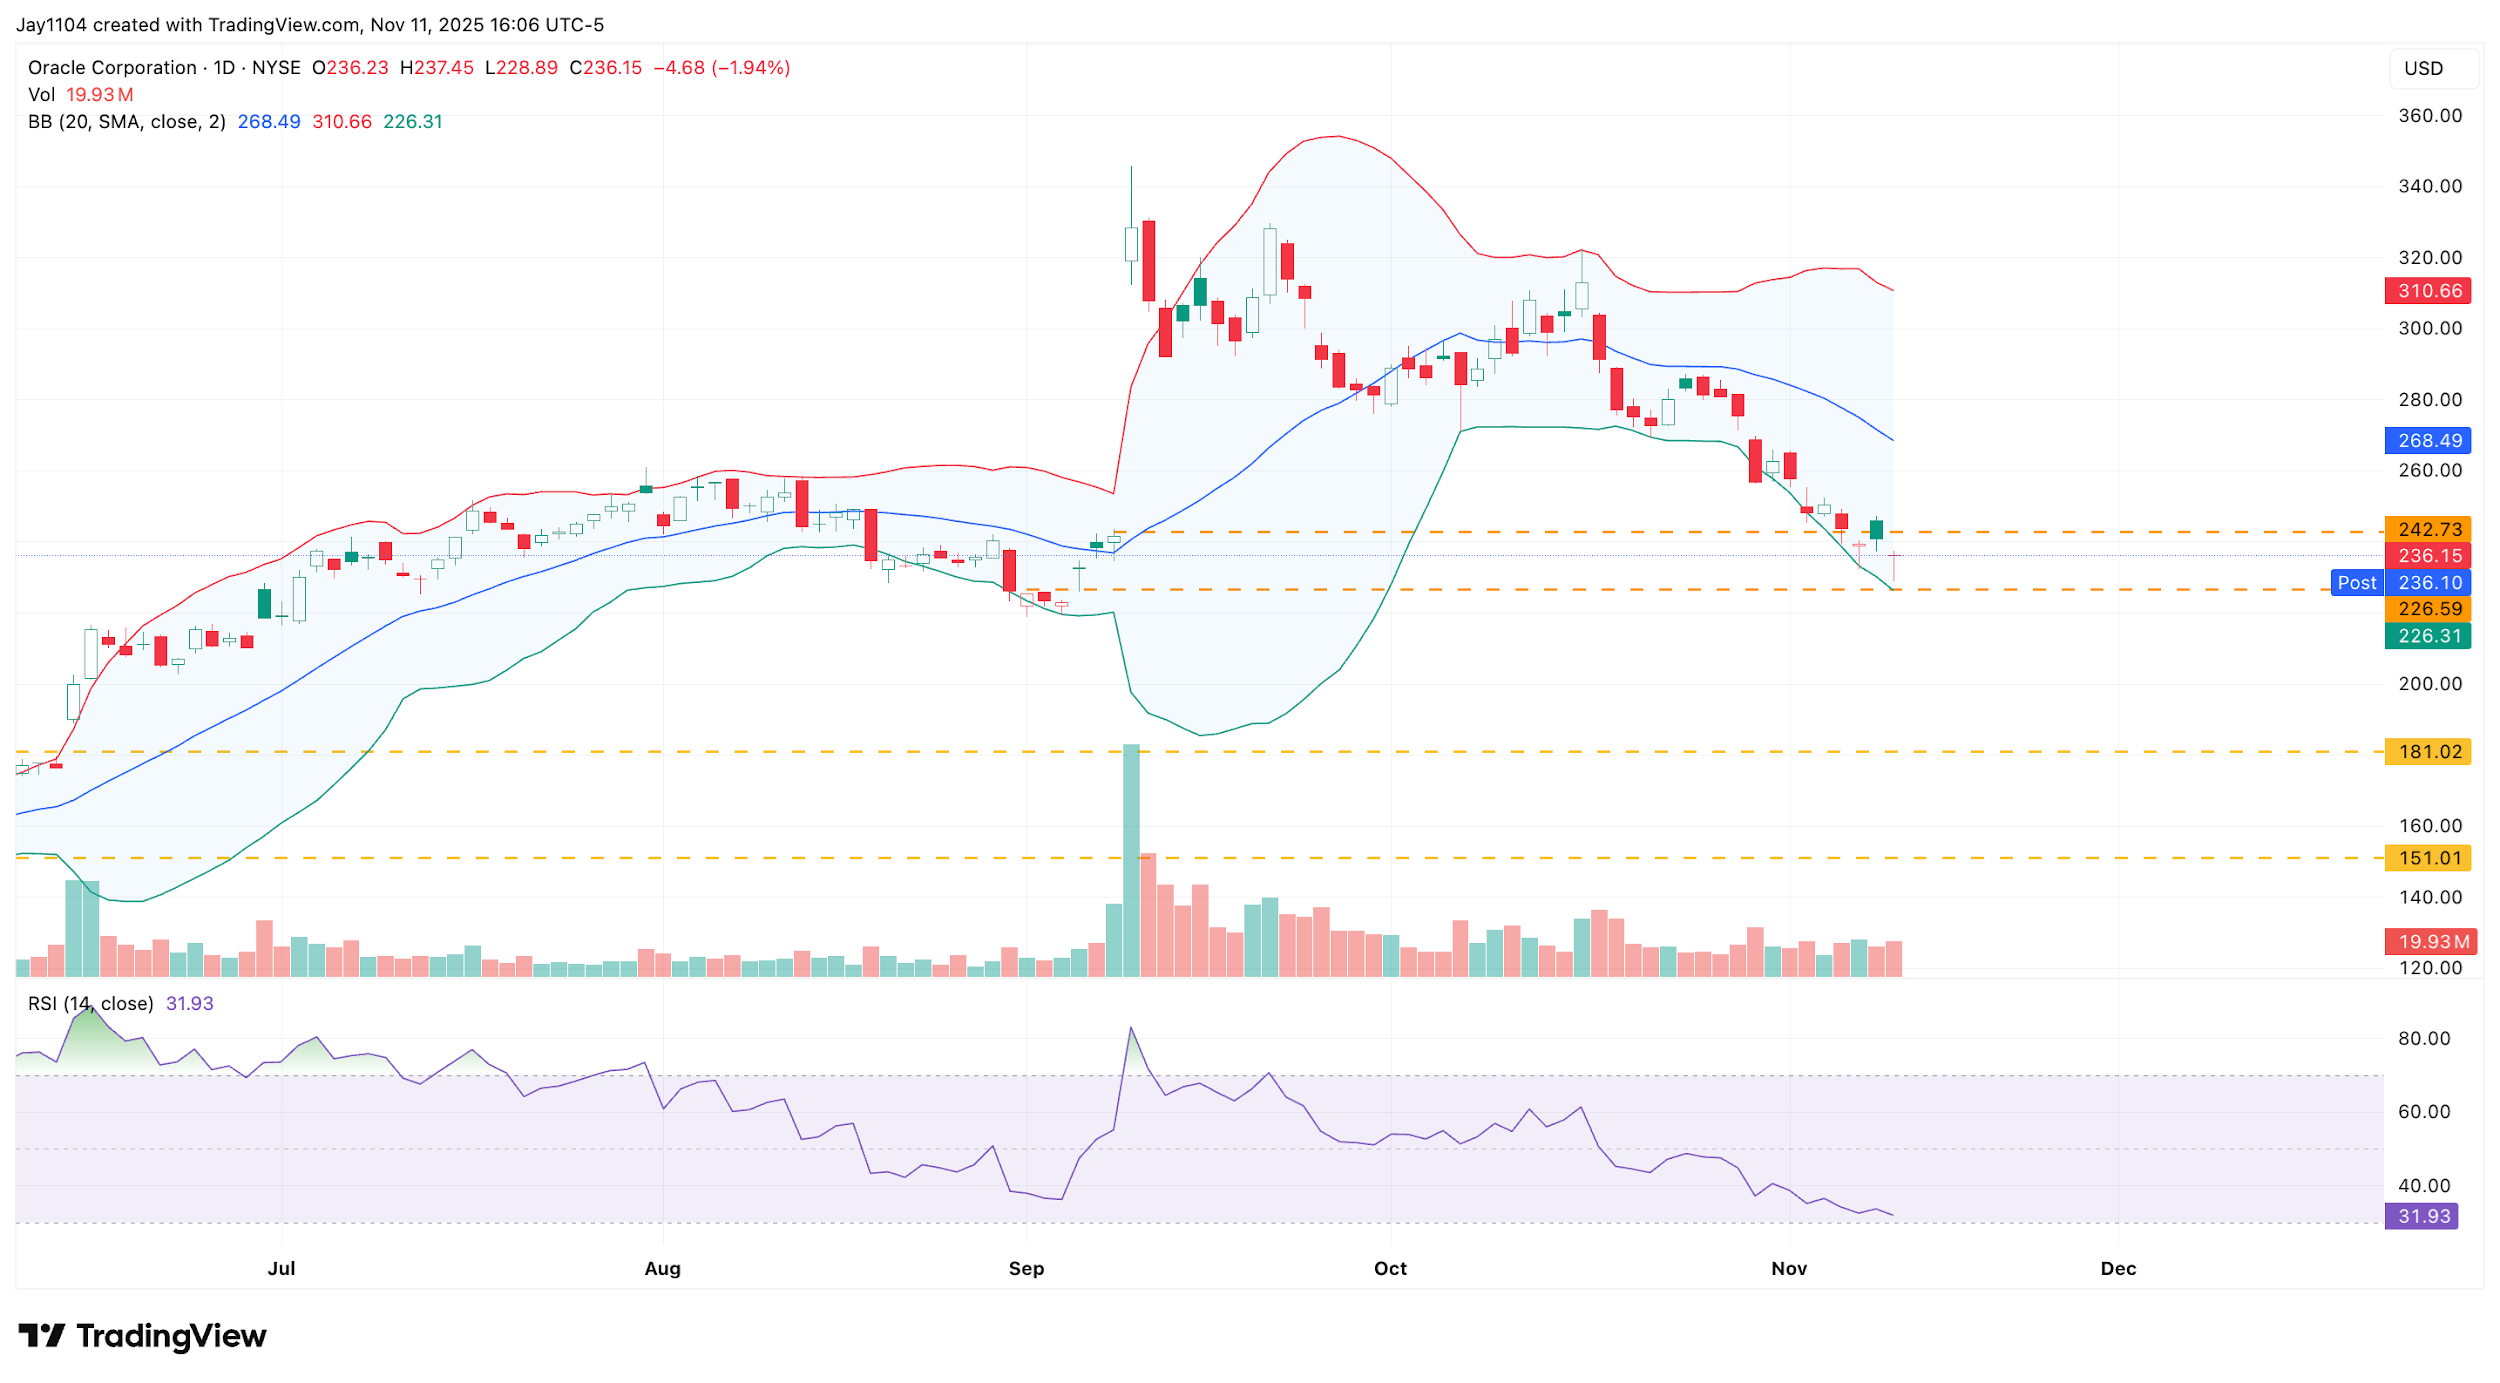
Oracle shares continued to struggle, falling by another 2%. However, the stock is now approaching oversold territory on a technical basis, with the RSI nearing 30 and the price moving towards the lower end of the Bollinger Band. There also appears to be a potential support region between $225 and $230.
(Source: TradingView)
Past performance is not a reliable indicator of future results.
From an options market perspective, Oracle has significant put gamma around $230, which could also act as support. At present, the stock is in a negative gamma environment, meaning market makers are likely to be directional sellers if the shares continue to fall. However, the $230 strike price could mark an area where put holders begin to monetise their positions, providing potential support and even triggering a short-term bounce.
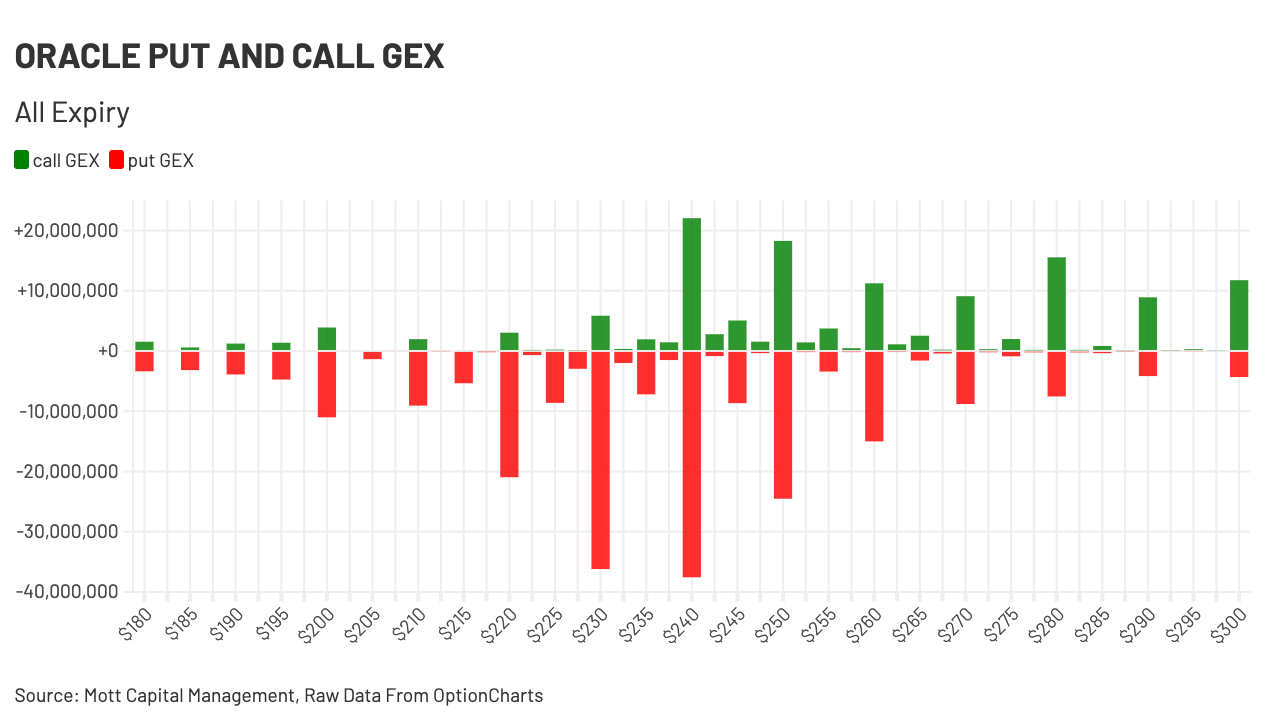
(Source: TradingView)
Past performance is not a reliable indicator of future results.
Bitcoin Fails at Resistance
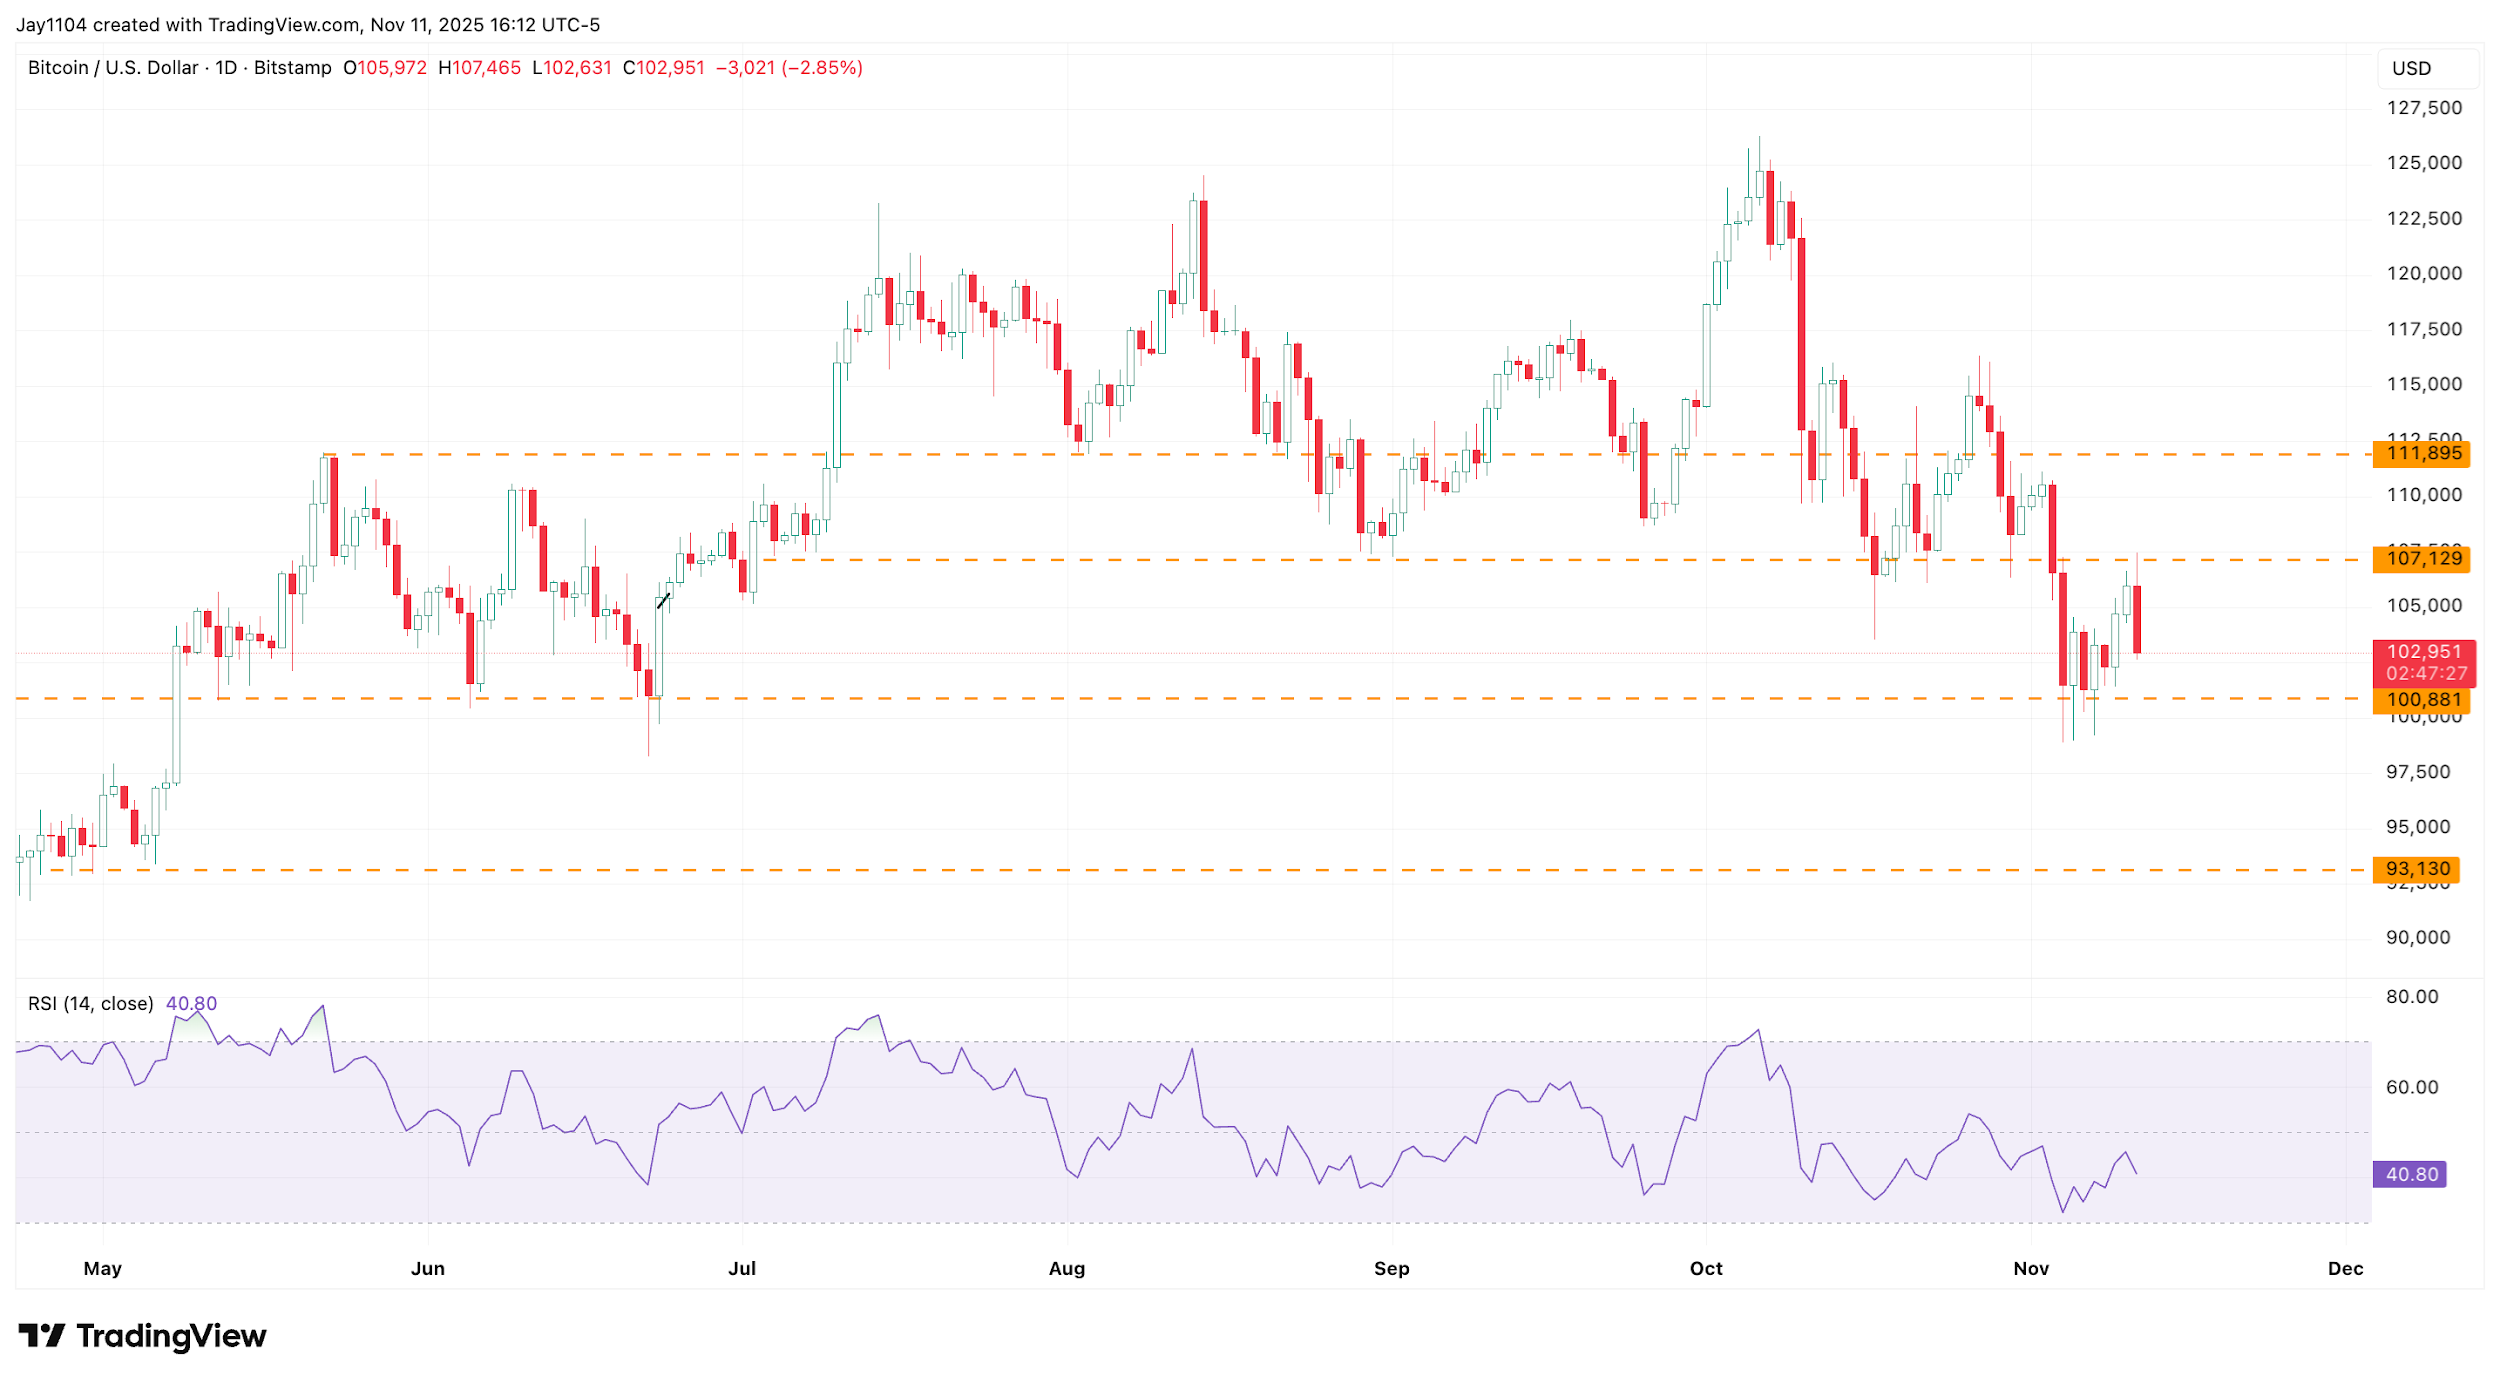
Bitcoin fell by more than 2.7% after testing the $106,000-$107,000 resistance zone and failing to break through it. It is now trading lower, around $103,000, and is facing a test of support in the $100,000-$101,000 range, again.
This price action may also be signalling that liquidity is leaving the broader market, potentially serving as a warning for risk assets. A break below $100,000 on Bitcoin would likely be negative for both risk assets and equity prices going forward. With Treasury settlement dates scheduled over the next few trading days, Bitcoin’s weakness could be an early indication that liquidity is tightening across the marketplace.
(Source: TradingView)
Past performance is not a reliable indicator of future results.