What is a bull market?

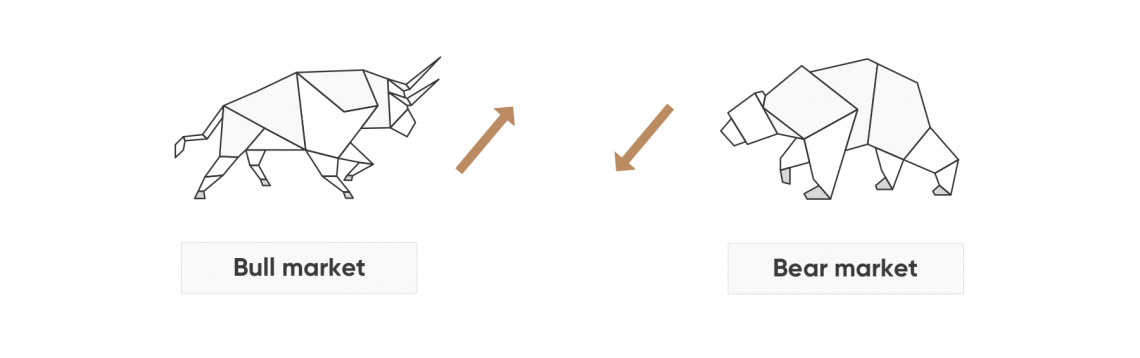
Searching for a bull market definition? When prices start rising and then continue to rise it’s known as a bull market. It’s when traders have confidence that prices are good, so they are optimistic about the future. The opposite of a bull market is a bear market – a period characterised by falling prices and general trader pessimism.
Key takeaways
-
A bull market is a period of rising prices driven by high demand and trader optimism, typically occurring when economies are strong and unemployment is low, applicable to stocks, bonds, currencies, and commodities.
-
Bull markets progress through three phases: accumulation (informed investors enter at low prices), public participation (longest phase with largest price movements as conditions improve), and excess (informed investors exit while new buyers enter near peaks).
-
Typical bull markets last 8.5 years with 458% cumulative returns based on 1926-2014 data, while the longest modern US bull market (1982-2000) lasted 18 years with 16.8% average annual Dow returns.
-
Bull markets often signal economic expansion ahead and rise before key economic indicators improve, as stock prices are driven by sentiment and markets typically lead macroeconomic data by several months.
-
Investors should focus on investment quality rather than market psychology, with the ideal strategy being to buy early in upward trends and sell at peaks, though predicting market trends remains inherently uncertain.
Where have you heard about bull markets?
The term is often used in the media when stock markets are rising, or when confidence returns, and people think a bear market is coming to an end.
What you need to know about bull markets
The ‘bull’ and ‘bear’ terminology to describe markets derives from the different ways the two animals attack their opponents. A bull attacks by lifting its horns upward, but a bear strikes with its claws in a downward motion. Using these actions as metaphors for market movement, we talk about a bull market if the trend is up, and a bear market if the trend is down.
The term ‘bull market’ is usually used to refer to the stock market, but it can also be applied to bonds, currencies, commodities and anything that’s traded. Bull markets are triggered when there’s a lot of demand – when people want to buy. They usually happen when economies are doing well, and unemployment is low. In a bull market, the ideal strategy for an investor is to take advantage of rising prices by buying early in the trend and then selling them when they’ve reached their peak.
Economic cycle
Bull and bearmarkets tend to be closely linked to the economic cycle, which theorists say consists of four phases: expansion, peak, contraction and trough. The start of a bull market often signifies economic expansion ahead. As stock prices tend to be driven by sentiment, the market generally rises before key economic measures (such as gross domestic product growth) start to improve. Similarly, bear markets tend to set in before the wider economy starts to shrink. The market is usually ahead of the macroeconomic data.
Bull market phases
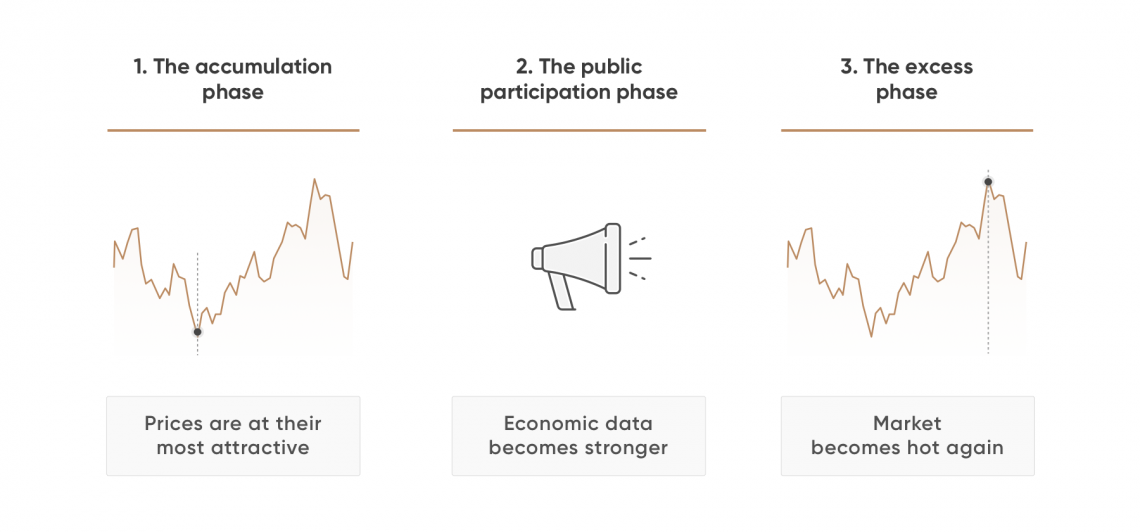
Analysts and economists talk of three main phases to a bull market:
- The first stage is referred to as the accumulation phase. It typically comes at the end of a downtrend, when everything seems at its worst. But, it’s also the time when prices are at their most attractive, because by this stage most of the bad news has already been priced in. Informed investors start to enter the market. The accumulation phase can be hard to spot and often comes amid continuing market pessimism, with many investors believing things can only get worse. The start of the accumulation phase sees a period of price consolidation, and during later stages of this phase the price of the market starts to move higher.
- The second stage is known as the public participation phase. In this period, negative sentiment starts to fade as business conditions improve and economic data becomes stronger. The steady flow of good news encourages more and more investors to move back in, which sends prices higher. The public participation phase tends to be the longest lasting of the three bull market phases, and also the one with the largest price movement. Long positions are taken up by technical and trend traders as the new upward primary trend confirms itself.
- The third stage of the three bull market phasesis known as the excess phase. At this point, the market becomes hot again for all investors, and informed investors start to scale back their positions, selling them off to new market entrants. The last of the buyers to enter the market do so after big gains have already been achieved. They hope that recent returns will continue, but they’re buying near the top. Smart investors look very carefully for signs of weakness in the trend. If the upward moves start to peter out, it could be a sign of an approaching primary downtrend – the onset of the next bear market.
Market top and market bottom
It's worth stressing that a market top (or high) isn’t usually a dramatic event – it just means that the market has reached the highest point it will see for the foreseeable future. A decline then follows, usually gathering in pace as time goes by.
A market bottom is the end of a market downturn, and the start of an upward trend (bull market). A market bottom is also very hard to pinpoint while it’s occurring, and investors who buy stocks during false market bottoms can get caught out if the slide resumes. Baron Rothschild once reportedly advised that the best time to buy is when there is ‘blood in the streets’.
Secondary trends
So, it’s important to be on your guard for the development of ‘secondary trends’ – short-term changes in price direction that last just a few weeks or months. A market correction is one type of secondary market trend – it’s used to denote a short-term price decline of around 5%-20%. There was a market correction between April and June 2010, when the S&P 500 went from above 1,200 to near 1,000. Initially this was hailed as the end of the bull market and start of a bear market, but the market turned back up.
Bullish stocks
As well as bull and bearmarkets, investors often speak about bullish and bearish stocks. Bullish stocksare those characterised by very strong uptrend moves, in which the price rises in waves. The length and strength of such price increases are often far more pronounced than the price rise of other stock. And the most bullish stocksalso see only very small pullbacks.
Bull market analysis
The most long-running bull market in modern US history began in 1982 and ended in the dotcom crash of 2000, with a brief upset occurring in the crash of 1987. During this 18-year ‘secular’ bull market – secular meaning one lasting for over five years – the Dow Jones Industrial Average averaged annual returns of 16.8%. The bull market was even more pronounced on the tech-heavy NASDAQ, whose value grew fivefold between 1995 and 2000.
Bull markets can last for years and they can be local – one market might be ‘bullish’ while others around the world are struggling. An analysis of Morningstar stock market data from 1926 to 2014 found that a typical bull market ‘lasted 8.5 years with an average cumulative total return of 458%’, while annualised gains for bull markets varied from 14.9% to 34.1%.
Ultimately, there’s no sure way to predict market trends, so savvy investors are often advised to invest their money based on the quality of the investments, rather than on the underlying market psychology. A strong investment could buck a downward trend, and a weak one could underperform an upward trend.
Find out more about bull markets…
If you want to explore bull and bear markets further, our comprehensive glossary has lots more definitions of related terms including bear market, stock market, trend and investor.
In November 2017, CNBC ran a piece entitled ‘Here's what “bull market” means and how you know if you're in one’. Interestingly, it reveals that over half of respondents in a financial fitness survey couldn’t define the financial term. Here’s a link to the article.
Visit related finance terms
What is bear market

What is market trend