CFDs are complex instruments and come with a high risk of losing money rapidly due to leverage. 79% of retail investor accounts lose money when trading CFDs with this provider. You should consider whether you understand how CFDs work and whether you can afford to take the high risk of losing your money.
US English
4.717
0.34%
Market Trading Hours* (UTC) Opens on Thursday at 08:00

Mon - Fri: 08:00 - 12:00 12:03 - 16:30

  • Summary
  • Historical Data
  • Events
  • Income Statement
  • Balance Sheet
  • Cash Flow
  • Ownership
Trading Conditions
Spread 0.093
Long position overnight fee

Long position overnight fee


Margin. Your investment $1,000.00
Overnight fee -0.025262 %
Charges from full value of position ($-4.80)
Trade size with leverage ~ $20,000.00
Money from leverage ~ $19,000.00

Go to platform
-0.025262%
Short position overnight fee

Short position overnight fee


Margin. Your investment $1,000.00
Overnight fee 0.003344 %
Charges from full value of position ($0.64)
Trade size with leverage ~ $20,000.00
Money from leverage ~ $19,000.00

Go to platform
0.003344%
Overnight fee time 22:00 (UTC)
Min traded quantity 1
Currency GBP
Margin 5%
Stock exchange United Kingdom of Great Britain and Northern Ireland
Commission on trade 0%

*Information provided by Capital.com

BP PLC ESG Risk Ratings

High Medium Low Negligible

‘C’ score indicates satisfactory relative ESG performance and moderate degree of transparency in reporting material ESG data publicly.

More ESG coverage

Key Stats
Prev. Close* 4.701
Open* 4.733
1-Year Change* -2.09%
Day's Range* 4.701 - 4.762
52 wk Range 4.47-5.71
Average Volume (10 days) 32.00M
Average Volume (3 months) 701.41M
Market Cap 79.39B
P/E Ratio 3.86
Shares Outstanding 16.96B
Revenue 181.91B
EPS 1.21
Dividend (Yield %) 4.89656
Beta 1.14
Next Earnings Date Feb 5, 2024

All data is provided by Refinitiv, except for data marked with an asterisk, which is *data provided by Capital.com

  • Last Week
  • Last Month
  • Last Year
  • Last two Years
  • Max
  • Daily
  • Weekly
  • Monthly
Date Close Change Change (%) Open High Low
Nov 29, 2023 4.717 0.045 0.96% 4.672 4.764 4.672
Nov 28, 2023 4.701 -0.025 -0.53% 4.726 4.778 4.701
Nov 27, 2023 4.748 0.024 0.51% 4.724 4.769 4.687
Nov 24, 2023 4.712 0.074 1.60% 4.638 4.778 4.638
Nov 23, 2023 4.712 0.016 0.34% 4.696 4.747 4.688
Nov 22, 2023 4.633 -0.090 -1.91% 4.723 4.779 4.597
Nov 21, 2023 4.757 0.057 1.21% 4.700 4.778 4.700
Nov 20, 2023 4.765 0.000 0.00% 4.765 4.823 4.753
Nov 17, 2023 4.748 0.045 0.96% 4.703 4.787 4.683
Nov 16, 2023 4.678 -0.112 -2.34% 4.790 4.808 4.655
Nov 15, 2023 4.812 -0.004 -0.08% 4.816 4.831 4.767
Nov 14, 2023 4.752 -0.093 -1.92% 4.845 4.860 4.752
Nov 13, 2023 4.827 0.053 1.11% 4.774 4.857 4.679
Nov 10, 2023 4.765 0.015 0.32% 4.750 4.803 4.669
Nov 9, 2023 4.745 0.044 0.94% 4.701 4.762 4.671
Nov 8, 2023 4.776 0.031 0.65% 4.745 4.819 4.745
Nov 7, 2023 4.795 -0.039 -0.81% 4.834 4.867 4.795
Nov 6, 2023 4.891 0.051 1.05% 4.840 4.927 4.796
Nov 3, 2023 4.845 -0.178 -3.54% 5.023 5.045 4.814
Nov 2, 2023 4.975 0.060 1.22% 4.915 5.009 4.885

BP PLC - GBP Events

Time (UTC) Country Event
Monday, February 5, 2024

Time (UTC)

07:00

Country

GB

Event

Q4 2023 BP PLC Earnings Release

Forecast

-

Previous

-
Friday, April 26, 2024

Time (UTC)

12:00

Country

GB

Event

BP PLC Annual Shareholders Meeting

Forecast

-

Previous

-
View all events
  • Annual
  • Quarterly
2022 2021 2020 2019 2018
Total revenue 241392 157739 105944 159307 298756
Revenue 241392 157739 105944 159307 298756
Cost of Revenue, Total 171894 120004 80616 113625 253705
Gross Profit 69498 37735 25328 45682 45051
Total Operating Expense 226986 144237 127944 151627 283904
Selling/General/Admin. Expenses, Total 13449 11931 10397 11057 12179
Research & Development 585 424 10280 964 1445
Depreciation / Amortization 14318 14805 14889 17780 15457
Unusual Expense (Income) 26740 -2927 11762 8201 1118
Operating Income 14406 13502 -22000 7680 14852
Interest Income (Expense), Net Non-Operating 1109 2404 -2321 1262 2434
Other, Net -110 -679 -567 -788 -563
Net Income Before Taxes 15405 15227 -24888 8154 16723
Net Income After Taxes 477 8487 -20729 4190 9457
Minority Interest -1130 -922 424 -164 -195
Net Income Before Extra. Items -653 7565 -20305 4026 9262
Net Income -2487 7565 -20305 4026 9383
Total Adjustments to Net Income -1 -2 -1 -1 -1
Income Available to Common Excl. Extra. Items -654 7563 -20306 4025 9261
Income Available to Common Incl. Extra. Items -2488 7563 -20306 4025 9382
Dilution Adjustment 0 0 0
Diluted Net Income -2488 7563 -20306 4025 9382
Diluted Weighted Average Shares 18987.9 20260.4 20221.5 20399.7 20102.5
Diluted EPS Excluding Extraordinary Items -0.03444 0.37329 -1.00418 0.19731 0.46069
Dividends per Share - Common Stock Primary Issue 0.24212 0.2142 0.315 0.41 0.39722
Diluted Normalized EPS 1.30172 0.3191 -0.01454 0.6907 0.62221
Total Extraordinary Items -1834 121
Jun 2023 Mar 2023 Dec 2022 Sep 2022 Jun 2022
Total revenue 48538 56182 69257 55011 67866
Revenue 48538 56182 69257 55011 67866
Cost of Revenue, Total 35789 36569 41476 47804 47345
Gross Profit 12749 19613 27781 7207 20521
Total Operating Expense 45154 44166 52463 53330 53595
Selling/General/Admin. Expenses, Total 3834 3747 3654 3262 3453
Research & Development 293 106 140 225 128
Depreciation / Amortization 3923 3800 3714 3467 3512
Unusual Expense (Income) 1315 -56 3479 -1428 -843
Operating Income 3384 12016 16794 1681 14271
Interest Income (Expense), Net Non-Operating 49 -227 92 283 -225
Other, Net 61 58 16 16 17
Net Income Before Taxes 3494 11847 16902 1980 14063
Net Income After Taxes 1953 8422 12995 -1984 9536
Minority Interest -161 -204 -358 -179 -279
Net Income Before Extra. Items 1792 8218 12637 -2163 9257
Net Income 1792 8218 10803 -2163 9257
Total Adjustments to Net Income 0 0 0 -1
Income Available to Common Excl. Extra. Items 1792 8218 12637 -2163 9256
Income Available to Common Incl. Extra. Items 1792 8218 10803 -2163 9256
Diluted Net Income 1792 8218 10803 -2163 9256
Diluted Weighted Average Shares 17901 18238.5 18509.4 18885.7 19619.6
Diluted EPS Excluding Extraordinary Items 0.10011 0.45058 0.68273 -0.11453 0.47177
Dividends per Share - Common Stock Primary Issue 0.0727 0.06548 0.06715 0.05513 0.06292
Diluted Normalized EPS 0.1944 0.44878 0.80862 -0.16581 0.44271
Dilution Adjustment
Total Extraordinary Items -1834
  • Annual
  • Quarterly
2022 2021 2020 2019 2018
Total Current Assets 107688 92590 72982 82059 71310
Cash and Short Term Investments 23907 26221 29527 20965 21340
Cash 15008 9101 6235 6462 6148
Cash & Equivalents 8321 16840 22959 14334 14970
Short Term Investments 578 280 333 169 222
Total Receivables, Net 34946 28036 19078 26063 25823
Accounts Receivable - Trade, Net 28883 22712 13297 20297 20270
Total Inventory 28081 23711 16873 20880 17988
Prepaid Expenses 2092 2486 1269 857 963
Other Current Assets, Total 18662 12136 6235 13294 5196
Total Assets 288120 287272 267654 295194 282176
Property/Plant/Equipment, Total - Net 106044 112902 114836 132642 135261
Property/Plant/Equipment, Total - Gross 250777 280616 286753 289828 306348
Accumulated Depreciation, Total -144733 -167714 -171917 -157186 -171087
Goodwill, Net 11960 12373 12480 11868 12204
Intangibles, Net 10200 6451 6093 15539 17284
Long Term Investments 23271 33527 30083 31601 27661
Note Receivable - Long Term 2363 3615 5191 2777 2471
Other Long Term Assets, Total 26594 25814 25989 18708 15985
Total Current Liabilities 99018 80287 59799 73595 68237
Accounts Payable 49870 39492 24521 32404 28621
Accrued Expenses 8759 8346 6753 7447 6898
Notes Payable/Short Term Debt 0 0 0 0 0
Current Port. of LT Debt/Capital Leases 5300 7304 11292 12554 9373
Other Current Liabilities, Total 35089 25145 17233 21190 23345
Total Liabilities 220567 211809 196404 196782 182732
Total Long Term Debt 50193 62483 70634 64892 56426
Long Term Debt 43746 55619 63305 57237 55803
Capital Lease Obligations 6447 6864 7329 7655 623
Deferred Income Tax 10526 8780 6831 9750 9812
Minority Interest 15437 14976 14318 2296 2104
Other Liabilities, Total 45393 45283 44822 46249 46153
Total Equity 67553 75463 71250 98412 99444
Redeemable Preferred Stock 21 21 21 21 21
Common Stock 4774 5194 5362 5383 5381
Additional Paid-In Capital 13692 12745 12584 12417 12305
Retained Earnings (Accumulated Deficit) 64118 80726 76034 102410 107393
Treasury Stock - Common -12153 -12624 -13224 -14412 -15767
Other Equity, Total -2899 -10599 -9527 -7407 -9889
Total Liabilities & Shareholders’ Equity 288120 287272 267654 295194 282176
Total Common Shares Outstanding 17972.9 19640.6 20262.1 20239 20099.2
Total Preferred Shares Outstanding 12.706 12.706 12.706 12.706 12.706
Unrealized Gain (Loss) 0 0 0
Sep 2023 Jun 2023 Mar 2023 Dec 2022 Sep 2022
Total Current Assets 103407 95314 99258 107688 108440
Cash and Short Term Investments 30858 29585 30883 29773 29604
Cash & Equivalents 29926 28914 30433 29195 29304
Short Term Investments 932 671 450 578 300
Total Receivables, Net 32595 28665 30432 34946 35395
Accounts Receivable - Trade, Net 31558 27701 29426 34010 34817
Total Inventory 25671 23349 23905 28081 29492
Prepaid Expenses 1333 1673 1791 2092 1148
Other Current Assets, Total 12950 12042 12247 12796 12801
Total Assets 280236 276067 278661 288120 283482
Property/Plant/Equipment, Total - Net 107163 108126 105744 106044 105045
Goodwill, Net 12283 12206 12003 11960 11145
Intangibles, Net 9997 10447 10295 10200 6311
Long Term Investments 22926 23350 23787 23271 25106
Note Receivable - Long Term 2722 2677 2369 2363 2279
Other Long Term Assets, Total 21738 23947 25205 26594 25156
Total Current Liabilities 85595 81465 84587 99018 104142
Payable/Accrued 60440 56183 57854 63984 56270
Accrued Expenses 5958 6004 5829 6398 6327
Notes Payable/Short Term Debt 0 0 0 0 0
Current Port. of LT Debt/Capital Leases 5408 4803 4659 5300 5719
Other Current Liabilities, Total 13789 14475 16245 23336 35826
Total Liabilities 207818 205728 206886 220567 225301
Total Long Term Debt 54281 55896 52541 50193 48736
Long Term Debt 45938 47400 46096 43746 42683
Capital Lease Obligations 8343 8496 6445 6447 6053
Deferred Income Tax 10293 10648 10886 10526 9016
Minority Interest 15258 15264 15406 15437 15152
Other Liabilities, Total 42391 42455 43466 45393 48255
Total Equity 72418 70339 71775 67553 58181
Other Equity, Total 72418 70339 71775 67553 58181
Total Liabilities & Shareholders’ Equity 280236 276067 278661 288120 283482
Total Common Shares Outstanding 17119.2 17451.9 17636.7 17972.9 18599.6
Total Preferred Shares Outstanding 12.706 12.706 12.706 12.706 12.706
  • Annual
  • Quarterly
2022 2021 2020 2019 2018
Net income/Starting Line 15405 15227 -24888 8154 16723
Cash From Operating Activities 40932 23612 12162 25770 22873
Cash From Operating Activities 14318 14805 14889 17780 15457
Non-Cash Items 25885 -3457 23242 6229 -367
Cash Taxes Paid 10106 4179 2438 5437 5712
Changes in Working Capital -14676 -2963 -1081 -6393 -8940
Cash From Investing Activities -13713 -5694 -7858 -16974 -21571
Capital Expenditures -12069 -10887 -12306 -15418 -16707
Other Investing Cash Flow Items, Total -1644 5193 4448 -1556 -4864
Cash From Financing Activities -28021 -18079 3956 -8817 -4079
Financing Cash Flow Items -630 198 12191 353 -170
Total Cash Dividends Paid -4358 -4304 -6340 -6946 -6699
Issuance (Retirement) of Stock, Net -9996 -3151 -776 -1511 -355
Issuance (Retirement) of Debt, Net -13037 -10822 -1119 -713 3145
Foreign Exchange Effects -684 -269 379 25 -330
Net Change in Cash -1486 -430 8639 4 -3107
Mar 2023 Dec 2022 Sep 2022 Jun 2022 Mar 2022
Net income/Starting Line 11847 15405 -1497 -3477 -17540
Cash From Operating Activities 7622 40932 27361 19073 8210
Cash From Operating Activities 3850 14318 10922 7265 3674
Non-Cash Items -1165 25885 23883 25242 25112
Cash Taxes Paid 3155 10106 6524 3770 1265
Changes in Working Capital -6910 -14676 -5947 -9957 -3036
Cash From Investing Activities -2819 -13713 -6965 -4392 -1883
Capital Expenditures -3129 -12069 -8373 -5268 -2602
Other Investing Cash Flow Items, Total 310 -1644 1408 876 719
Cash From Financing Activities -3551 -28021 -20912 -11715 -2469
Financing Cash Flow Items -432 -630 -359 -308 -145
Total Cash Dividends Paid -1183 -4358 -3270 -2130 -1068
Issuance (Retirement) of Stock, Net -2448 -9996 -6756 -3880 -1592
Issuance (Retirement) of Debt, Net 512 -13037 -10527 -5397 336
Foreign Exchange Effects -14 -684 -861 -539 -125
Net Change in Cash 1238 -1486 -1377 2427 3733
Investor Name Investor Type Percent Outstanding Shares Held Shares change Holdings Date Turnover Rating
The Vanguard Group, Inc. Investment Advisor/Hedge Fund 4.5918 782245186 0 2023-02-17 LOW
Norges Bank Investment Management (NBIM) Sovereign Wealth Fund 3.0709 523150077 -40140043 2023-02-17 LOW
BlackRock Institutional Trust Company, N.A. Investment Advisor 2.7926 475727163 -480787 2023-10-01 LOW
BlackRock Investment Management (UK) Ltd. Investment Advisor/Hedge Fund 1.3652 232577293 483565 2023-10-01 LOW
Capital Research Global Investors Investment Advisor 1.3035 222049508 9452054 2023-08-30 LOW
Legal & General Investment Management Ltd. Investment Advisor/Hedge Fund 1.195 203566602 -2241144 2023-10-01 LOW
BlackRock Advisors (UK) Limited Investment Advisor/Hedge Fund 1.179 200846021 1090702 2023-10-01 LOW
State Street Global Advisors (UK) Ltd. Investment Advisor/Hedge Fund 0.8032 136836506 -275313 2023-10-01 LOW
M&G Investment Management Ltd. Investment Advisor 0.7488 127560481 -484566 2023-10-01 LOW
SAFE Investment Company Limited Sovereign Wealth Fund 0.727 123847736 2041110 2023-08-25 LOW
Artemis Investment Management LLP Investment Advisor/Hedge Fund 0.644 109705187 -596068 2023-08-30 MED
Geode Capital Management, L.L.C. Investment Advisor/Hedge Fund 0.5822 99178461 910571 2023-08-25 LOW
Capital World Investors Investment Advisor 0.5529 94182760 0 2023-08-25 LOW
Franklin Mutual Advisers, LLC Investment Advisor/Hedge Fund 0.5283 90001357 1757048 2023-08-25 LOW
Aviva Investors Global Services Limited Investment Advisor/Hedge Fund 0.5147 87689474 -251058 2023-10-01 LOW
Causeway Capital Management LLC Investment Advisor 0.4974 84730438 36128935 2023-08-30 MED
State Street Global Advisors (US) Investment Advisor/Hedge Fund 0.491 83643709 -358785 2023-10-01 LOW
Wellington Management Company, LLP Investment Advisor/Hedge Fund 0.4904 83550116 -38797 2023-10-01 LOW
Jupiter Asset Management Ltd. Investment Advisor/Hedge Fund 0.4487 76445799 -6898619 2023-08-30 LOW
Schroder Investment Management Ltd. (SIM) Investment Advisor/Hedge Fund 0.4341 73948812 -478417 2023-10-01 LOW

Trading calculator

Calculate your hypothetical P&L if you had opened a CFD trade on a certain date (select a date) and closed on a different date (select a date).

Trade commission
0
  • 1:1
Leverage
1:1
  • 20
  • 100
  • 500
  • 1000
  • 10000
Investment
Trade size (Leverage x Investement):
Open

Close

Short Long

For the avoidance of doubt, this calculation does not include the costs of holding a position overnight (for which there will be additional charges)

BP - GBP Company profile

What is BP?

BP (formerly known as British Petroleum) is a world-known, multinational oil and gas company. It operates in all areas of the oil and gas industry, from exploration and production to refining and distribution. Today, the company provides fuel for the transportation industry, energy for heat and light, lubricants for engines, and other petrochemical products.

What does the company do?

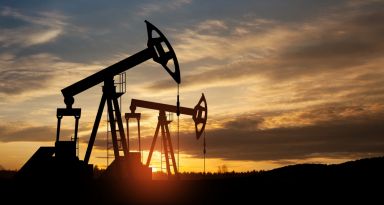
The company operates in two main segments: Upstream and Downstream. The Upstream is responsible for the exploration of natural gas and oil, further processing and transportation, while Downstream specialises in the global manufacturing of fuels and petrochemicals. BP works in 72 countries of the world, producing over 3.6 million barrels of oil equivalent per day. Operating over 18,000 service stations worldwide, the company’s largest division is BP America in the US.

A bit of BP’s history

Founded in 1908 with the discovery of a large amount of oil in Persia, BP’s story has always been about transformations: from coal to oil, from oil to gas, from onshore to deep water. Now it’s about a new mixture of energy sources, because the world is rapidly moving towards a lower carbon future.

The company was the first to obtain permission to explore oil in the Middle East. This event changed the history of the whole region.

Who founded BP?

The company was founded by William Knox D’Arcy. He formed the first Exploration Company in 1903 with a capital of £60,000. George Reinolds, was an explorer, who led D’Arcy’s exploration team in Persia. After several years of unsuccessful attempts to find oil, they finally made it. A year later, the Anglo-Persian Oil Company, that one day became BP, came into business. William D’Arcy, who had lost almost everything during the years of unsuccessful exploration, soon became richer than ever before.

Current size, team and locations

Headquartered in London, UK, BP operates in 70 countries of the world, running approximately 18,300 retail sites. The company’s proved reserves constitutes 18,441 million barrels of oil equivalent. BP produces 3.6 million barrels of oil equivalent daily. The team of BP consists of 74,000 employees, working worldwide.

Quick facts about BP

In 1959, BP broadened its business beyond the Middle East to Alaska and became one of the first companies to extract oil in the North Sea. 

BP was directly connected to several big environmental incidents:

  1. Texas City Refinery explosion in 2005
  2. Prudhoe Bay oil spill in 2006 
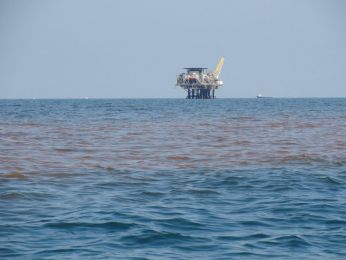
  3. Deepwater Horizon oil spill in 2010. The greatest accidental spill of oil into the sea in history. It caused harsh environmental, economic and health consequences and serious legal effects for BP. In order to correct the situation and clean up the water, 1.8 million gallons of Corexit oil dispersant was used. 

BP current business model

The company delivers energy services and products to people around the world. BP provides clients with energy for light and heat, fuel for transport, lubricants for engines and various petrochemicals used for everyday items, such as clothes, packages and paints. The company has a diverse portfolio of businesses besides oil and gas, including trading and transporting, marketing and manufacturing of fuels, generating renewable energy.

How to learn the BP share price?

BP is primarily listed on the London Stock Exchange (LSE)and is a constituent of the FTSE 100 Index. Secondary, the company is listed on the New York Stock Exchange and Frankfurt Stock Exchange. Join Capital.com to trade CFDs on the BPshare pricefluctuations and follow the BP chartin real-time.

Industry: Oil & Gas Refining and Marketing (NEC)

1 St. James's Square
LONDON
SW1Y 4PD
GB

Income Statement

  • Annual
  • Quarterly

News

Euro Zone CPI expected to continue dropping; economists warn about cutting too soon

EZ PI expected to drop further but speed of decline

08:16, 29 November 2023

A weaker Dollar drives gold higher

Gold prices have returned above $US2000 per ounce. We run through the factors driving gold and the commodity’s key technicals.

13:49, 28 November 2023

Q3 US Earnings Recap: Profits surprise to the upside, but outlook remains uncertain

US earnings for the third quarter were far better than expected. However, uncertainty about the outlook for company profits continues. We review the quarterly earnings and look ahead to what the markets expect from S&P 500 companies going forward.

13:20, 28 November 2023

RBNZ Preview: Rates expected to remain unchanged at final meeting of 2023

The RBNZ meets for the final time this year on Wednesday, 29th of November, 2023. We preview what to expect and how it could impact the New Zealand Dollar.

13:04, 28 November 2023

Crude prices slide on OPEC+ uncertainty

Crude prices have chopped sideways amid signs of turmoil within OPEC+. We look at the fundamentals of the oil market and the technical levels of WTI.

12:55, 28 November 2023
GBP

UK AUTUMN BUDGET: Will Hunt cut taxes? How will GBP react this time around?

UK Chancellor Hunt will deliver the 2023 autumn statement to MPs on Wednesday 22 November.

10:48, 21 November 2023

Gold Rises as Traders price-in Fed Rate Cuts

Gold prices have declined despite a drop in Treasury yields and a weaker US Dollar. We look at the key drivers and technical levels for the gold price.

13:17, 20 November 2023

People also watch

Oil - Crude

77.98 Price
+1.740% 1D Chg, %
Long position overnight fee -0.0164%
Short position overnight fee -0.0055%
Overnight fee time 22:00 (UTC)
Spread 0.030

Gold

2,046.34 Price
+0.250% 1D Chg, %
Long position overnight fee -0.0196%
Short position overnight fee 0.0114%
Overnight fee time 22:00 (UTC)
Spread 0.30

US100

16,021.60 Price
+0.080% 1D Chg, %
Long position overnight fee -0.0262%
Short position overnight fee 0.0040%
Overnight fee time 22:00 (UTC)
Spread 1.8

XRP/USD

0.61 Price
-0.590% 1D Chg, %
Long position overnight fee -0.0753%
Short position overnight fee 0.0069%
Overnight fee time 22:00 (UTC)
Spread 0.01168
video

Still looking for a broker you can trust?

Join the 570.000+ traders worldwide that chose to trade with Capital.com

1. Create & verify your account 2. Make your first deposit 3. You’re all set. Start trading