
US Treasury yields outlook: Can the upward trend persist any longer?
11:08, 29 November 2022

Bond prices rallied in November, with Treasury yields falling significantly on the long end of the curve as the market continues to price in a slowdown in growth and inflation that could force the Fed to pause rate hikes next year.
As yields fell, US Treasuries have appreciated significantly in price over the past few weeks. The Ishares 20+ year Treasury bond ETF (TLT) has risen by 12% from lows, breaking over its 50-day moving average and heading closer to its 2022 negative trendline.
The latest developments in the Treasury market have caused investors to question whether the significant increase in US yields over the past year can still be prolonged, as we approach a key FOMC meeting in December.
As of the end of November, the yield on the US 2-year Treasury, which is used as a proxy for the expectations for the federal funds rate, is now trading at roughly 4.40%. This represents a drop of almost 50 basis points from its peak, which was reached on November 4th. In the first eleven months of 2022, the 2-year Treasury yield increased 365 basis points from its beginning level of 0.76 percent.
Instead, the yield on the benchmark 10-year US Treasury note has fallen to levels not seen in over two months, hovering at 3.65% (down 66bps from its peak on October 21st, but up 140bps from January 1st). Moving to the longer end of the curve, the 30-year Treasury yield is 3.72%, down 70 basis points from its peak in October.
Is this the foundation of a trend reversal in US Treasury yields, or is this only a brief pullback? What can we expect next?
What is your sentiment on TLT?
Chart: 20+ year Treasury ETF rallied in November but remains in a bear market
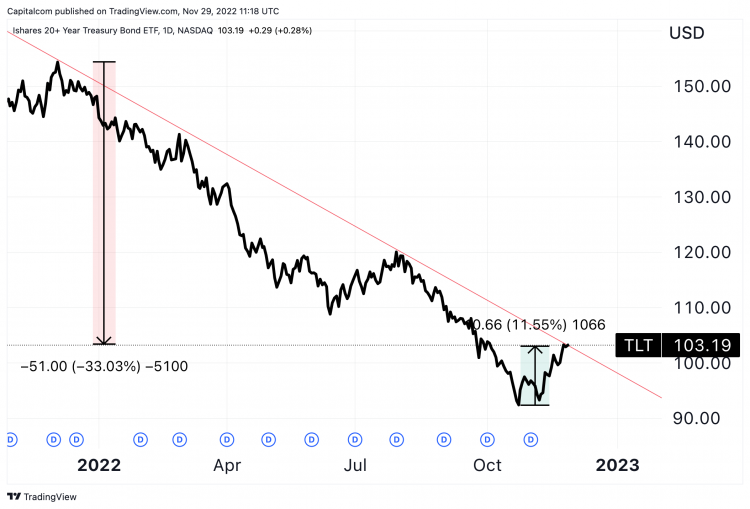 Ishares 20+ year Treasury bond ETF (TLT) daily chart since November 2021 – Photo: Capital.com, Source: Tradingview
US interest rate forecast: Will the Fed overtighten in comparison to market pricing?
| FOMC meeting | Rate priced | Increase priced (bps) | Sum of increases priced (bps) |
|---|---|---|---|
| 14-Dec-22 | 4.39% | 55 | 55 |
| 01-Feb-23 | 4.79% | 40 | 95 |
| 22-Mar-23 | 4.95% | 17 | 112 |
| 03-May-23 | 5.02% | 6 | 118 |
| 14-Jun-23 | 5.02% | 0 | 118 |
| 26-Jul-23 | 4.99% | -3 | 115 |
| 20-Sep-23 | 4.91% | -8 | 107 |
| 01-Nov-23 | 4.79% | -13 | 95 |
| 13-Dec-23 | 4.63% | -16 | 79 |
Table of US interest rates implied by Fed futures as of November 28, 2022
Investors anticipate a 50-basis-point raise at the December 2022 FOMC meeting, which would be a deceleration following four consecutive 75-basis-point hikes.
The market then expects Fed interest rates to reach their peak in May 2023 at about 5%, which would represent a cumulative increase of 125 bps from the current levels. The federal funds rate is then expected to decline to 4.63% by December 2023, implying approximately 40bps of interest-rate cuts factored in from June 2023.
Interest rate futures markets are already pricing in a scenario in which US inflation slows down significantly from here and the growth forecast also worsens, putting pressure on the Fed to not only halt its rate rise cycle but also deliver rate cuts in the second half of 2023.
According to the Fed's economic forecasts from September, the median fed funds rate was expected to reach its highest point of 4.6% in 2023 and then fall to 3.9% in 2024. However, at the FOMC press conference in November, Fed Chair Jerome Powell signalled that interest rates are likely to peak at a higher level than previously forecast by the Fed, and that financial conditions will need to stay tight for longer in order to adequately curb inflation.
Markets may have gone too far down the road by pricing in Fed cuts in 2023, which contrasts with recent statements by Powell and Fed officials.
If the Fed maintains committed to rising interest rates above current market pricing and maintaining them at higher levels for a longer period of time, US Treasury yields may be supported by a floor that might be difficult to breach even during a downturn. Only a severe recession combined with deflationary repercussions may successfully force the Federal Reserve to reassess its tight monetary policy and allow for additional loosening of financial conditions. In such a scenario, Treasury rates might decline further and bond prices could prolong their gain.
US dollar analysis: Decoupling from short-term US yields and tracking longer-term ones
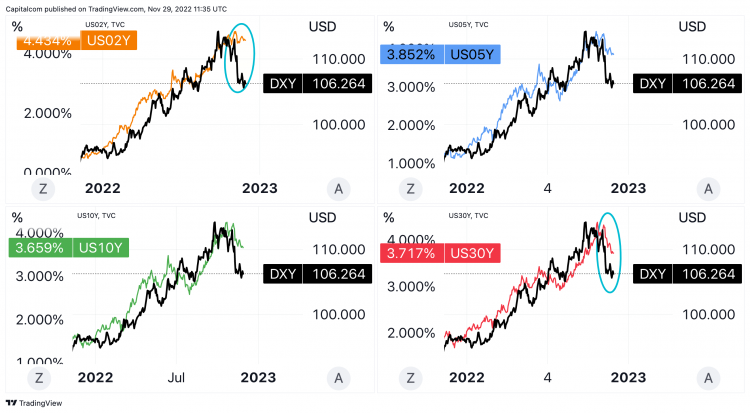 US dollar index (DXY) and US 2-year, 5-year, 10-year, 30-year yield – Photo: Capital.com, Source: Tradingview
The dollar had a poor month, with the DXY index dropping more than 4% and falling more than the link with Treasury rates would suggest.
The dollar has effectively decoupled from a pattern of strong correlation with Treasury rates, particularly for the 2-year maturity.
While the latter declined little, the dollar tumbled more in accordance with the yields on the longer end of the Treasury curve (10 years and 30 years).
It is a sign that the market's focus is turning from Federal Reserve rate rises, which powered the greenback rally during 2022, to concerns about economic growth in 2023, which puts downward pressure on the long end of the Treasury curve and affects the prospects of the dollar.
Ishares 20+ year Treasury bond ETF (TLT): Breakout in sight or new pullback?
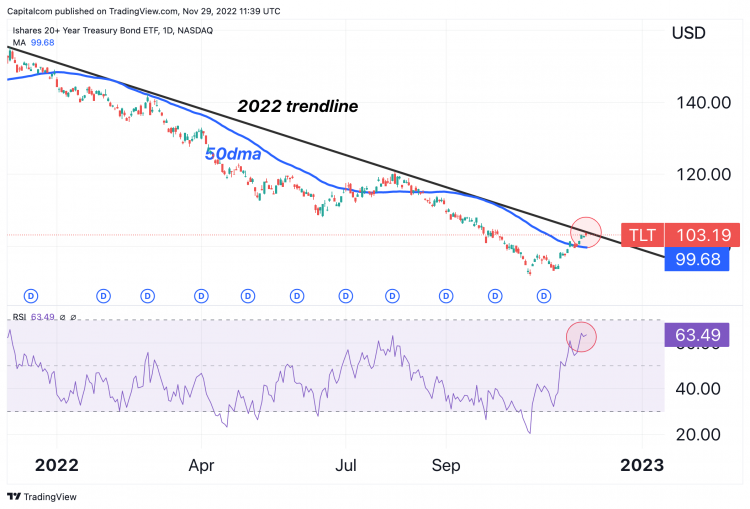 Ishares 20+ year Treasury bond ETF (TLT) daily chart and technical analysis – Photo: Capital.com, Source: Tradingview
US yields have fallen over the past month, which has led to a significant increase in the value of long-term US Treasuries, as represented by the Ishares 20+ year Treasury bond ETF (TLT). This occurs after US Treasuries were battered earlier in the year and have lagged the stock market.
The Ishares 20+ year Treasury bond ETF has gained 12% from its October lows, surpassing its 50-day moving average and nearing its negative trendline for 2022.
The current level of 103.2 is a significant dynamic barrier for this market, where profit-taking may resume. Momentum indicators are starting to show high values for an asset in a bear market. The daily RSI, while not in overbought territory, is at its highest level of the year.
Given the most recent Fed comments, the potential of a hawkish FOMC meeting in December, and the possibility of an upward surprise in November CPI, the recent advance in TLT may lose some steam and begin to retreat. The psychological level of 100, which corresponds with the 50-day moving average, may serve as the market's first line of support.
Key upcoming data and events affecting US Treasuries
- Wednesday November 30 2022 (1:15pm UTC): ADP employment change (consensus 200k, previous 239k)
- Wednesday November 30 2022 (1:30pm UTC): GDP Growth Rate QoQ 2nd Est Q3 (consensus 2.7%, previous -0.6%)
- Wednesday November 30 2022 (6:30pm UTC): Fed Chair Powell's speech on "The economic outlook and the labor market" at Brookings Institution
- Thursday December 01 2022 (3:00pm UTC): ISM Manufacturing PMI November (consensus 49.8, previous 50.2)
- Friday December 02 2022 (1:30pm UTC): Non farm payrolls November (consensus 200k, previous 261k)
- Friday December 02 2022 (1:30pm UTC): Unemployment rate (consensus 3.7%, previous 3.7%)
Monday December 05 2022 (3:00pm UTC): ISM Non-Manufacturing PMI November (previous 54.4)
Friday December 09 2022 (1:30pm UTC): PPI MoM November (previous 0.2%)
Friday December 09 2022 (3:00pm UTC): Michigan Consumer Sentiment December (previous 56.8)
Tuesday December 13 2022 (1:30pm UTC): Inflation rate (previous 7.7%)
Wednesday December 14 2022 (7:00pm UTC): FOMC meeting and interest rate decision
Markets in this article
Related topics

